All Excel Linked Bar Chart Graph Powerpoint Diagram Slide
-
 43839871 style essentials 2 financials 3 piece powerpoint presentation diagram template slide
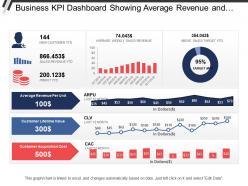
Presenting this set of slides with name - Business Kpi Dashboard Showing Average Revenue And Clv. This is a three stage process. The stages in this process are Business Dashboard, Business Kpi, Business Performance.
-
 98633483 style essentials 2 financials 6 piece powerpoint presentation diagram infographic slide
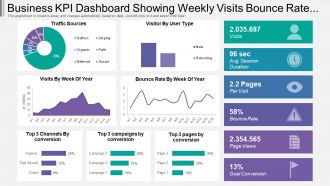
Presentation graphic is totally compatible with Google slides. Multiple display options i.e. standard and widescreen. 100 percent editable designs to show your creativity. Similar designs available with different nodes and stages. Easy to download and convert into JPEG or PDF format. Alteration can be done in color, text and shape. Pre-designed PPT slide just download and insert it in the presentation. Quick download with easy to save. Choice to add company logo and replace text as required. High resolution quality ensures no pixilation.
-
 28908029 style concepts 1 growth 3 piece powerpoint presentation diagram infographic slide
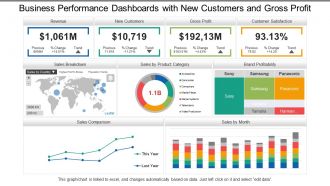
Presenting, business performance dashboards Snapshot with new customers and gross profit PowerPoint ideas for your ease. Information based slides, creating an impact on the viewer, can be used by specialists from any background, entrepreneurs, and scholars. Engaging and editable font style, type, text design and the content of the icons or the PPT slides. Full-screen view choice available and can be transformed into the desired format. Compatible with Google Slides. Open in widescreen size 16:9 after downloading.
-
 35237686 style essentials 2 financials 5 piece powerpoint presentation diagram infographic slide
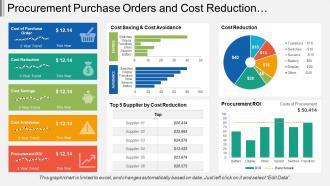
Presenting this set of slides with name - Procurement Purchase Orders And Cost Reduction Dashboard. This is a five stage process. The stages in this process are Purchase, Procurement, Buy.
-
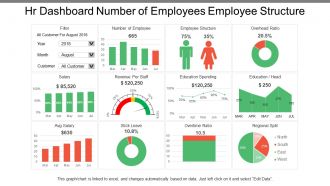 97426304 style essentials 2 financials 4 piece powerpoint presentation diagram infographic slide
Presenting this set of slides with name - Hr Dashboard Number Of Employees Employee Structure. This is a four stage process. The stages in this process are Hr Dashboard, Human Resource Dashboard, Hr Kpi.
-
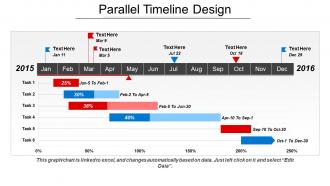 40916474 style essentials 1 roadmap 6 piece powerpoint presentation diagram infographic slide
This business template is highly recommended as it is 100% editable and can be changed as per you requirements. The font size, font color and font style can be easily modified as per your needs. This presentation is compatible with Google slides and can be viewed in widescreen in ratio of 16:9 or standard screen of 4:3. The orientation, size and color of the shapes and the designs used in this deck can be easily modified by just following the instructions given in the sample slides. You can add or remove any sort of information from this set of PPT templates.
-
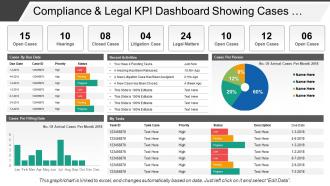 47865712 style essentials 2 financials 4 piece powerpoint presentation diagram infographic slide
Presenting this set of slides with name - Compliance And Legal Kpi Dashboard Showing Cases By Due Date. This is a four stage process. The stages in this process are Compliance And Legal, Legal Governance, Risk Management.
-
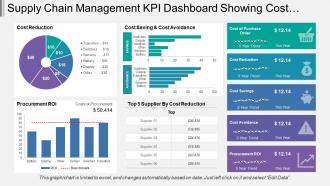 62107827 style essentials 2 financials 5 piece powerpoint presentation diagram infographic slide
Presenting this set of slides with name - Supply Chain Management Kpi Dashboard Showing Cost Reduction And Procurement Roi. This is a five stage process. The stages in this process are Demand Forecasting, Predicting Future Demand, Supply Chain Management.
-
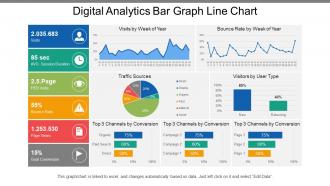 23296329 style essentials 2 financials 3 piece powerpoint presentation diagram infographic slide
Presenting this set of slides with name - Digital Analytics Bar Graph Line Chart. This is a five stage process. The stages in this process are Digital Analytics, Digital Dashboard, Digital Kpis.
-
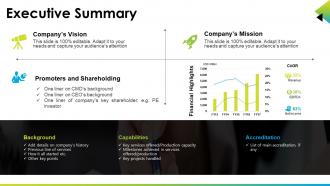 82135922 style essentials 2 financials 4 piece powerpoint presentation diagram infographic slide
High resolution Presentation design is easy to portray and share with audience. PPT diagram is easy to amend as elements like font, colors and shape are editable. Download is hasty which saves time as well as effort. Tailor it by injecting corporation trade name and design. Display in both Standard and Widescreen format. Presentation design is totally responsive with Google slides. PPT PowerPoint slide comes with creative and professional approach.
-
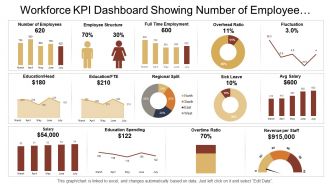 10954454 style essentials 2 financials 3 piece powerpoint presentation diagram infographic slide
Presenting this set of slides with name - Workforce Kpi Dashboard Showing Number Of Employee Overhead Ratio And Salary. This is a three stage process. The stages in this process are Staff, Personnel, Workforce.
-
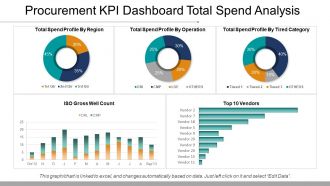 66265408 style essentials 2 financials 5 piece powerpoint presentation diagram infographic slide
Presenting procurement kpi dashboard total spend analysis ppt samples. This is a procurement kpi dashboard total spend analysis ppt samples. This is a five stage process. The stages in this process are business, strategy, growth, finance, chart and graph.
-
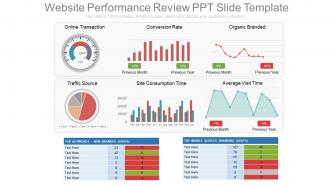 31657559 style essentials 2 financials 6 piece powerpoint presentation diagram infographic slide
These are exclusively codified PPT design schemes which are quite suitable for online business managers, process experts etc. These PPT graphics can be acclimating with divergent software’s and Google slides. These are wonderfully conceived pictorial Presentation templates which can be customizable in to other file formats like PDF or JPG. They have an alterable designs, forms, colors, contents etc. These Website performance PPT design can also provide a space to add the title or subtitle as per your need.
-
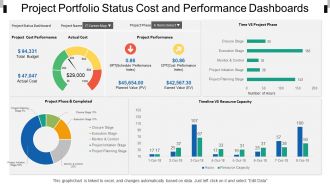 68043903 style essentials 2 dashboard 4 piece powerpoint presentation diagram infographic slide
Presenting, project portfolio status cost and performance dashboards snapshot. This is an appealing design for project portfolio status cost and performance focused PowerPoint presentation. This PPT template can be used by experts from various backgrounds to present their ideas in a contemporary way. This slide is cooperative with google slides and after downloading you can use it in full version and insert your company's logo for your best practice. Unique thinking to mesmerize your audience. Fully editable PowerPoint colors, orientation, text, and graphics.
-
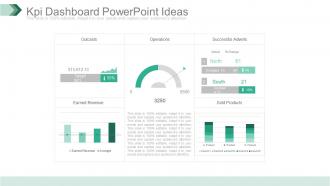 73555808 style essentials 2 dashboard 5 piece powerpoint presentation diagram template slide
Fabulously composed PPT design useful for business professionals, organizational experts or researchers , students and many more from diverse areas , Comprehensive and convenient PPT Images with ductile dummy data options, Consonant with all available graphic software’s and Google slides, Accessible to other file configurations like PDF or JPG. Multi-color options, background images, styles and other characteristics are fully editable, Expeditious downloading process, Allows to introduce your company logo or brand name in the PPT slides.
-
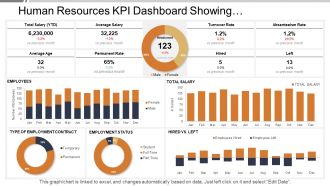 27024422 style essentials 2 financials 5 piece powerpoint presentation diagram infographic slide
SlideTeam presents the Human Resources Kpi Dashboard Showing Employment Status Turnover Rate PPT which will help you keep a track of the human capital working under you. All the slides in the slideshow are 100 percent editable and you can make all the desired changes in the presentation. You can also add or delete the slides All the slides are fully compatible with Google slides as well. Your audience will be amazed by Google slides. You can even view the document in 16:9 widescreen size.
-
 48662031 style essentials 2 financials 3 piece powerpoint presentation diagram infographic slide
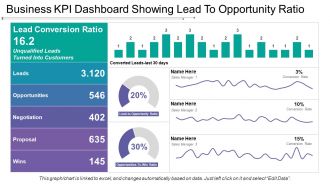
Presenting this set of slides with name - Business Kpi Dashboard Showing Lead To Opportunity Ratio. This is a three stage process. The stages in this process are Business Dashboard, Business Kpi, Business Performance.
-
 68197382 style division donut 4 piece powerpoint presentation diagram infographic slide
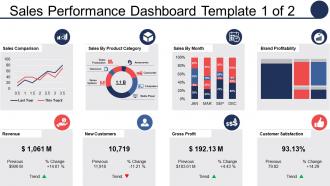
Introducing sales performance dashboard sales comparison sales by product category PPT design. Tailor the design with trade name, icon and even tagline. Fast download and easy to convert into JPG and PDF. Alternative to share presentation diagram in standard and widescreen display view. High quality PowerPoint slide comes with editable options as color, text and font can be edited at any stage. PowerPoint graphic is available with different nodes and stages.
-
 94738173 style essentials 2 financials 7 piece powerpoint presentation diagram infographic slide
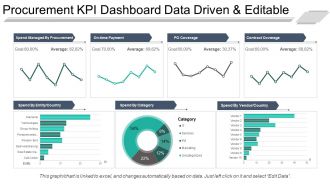
Presenting procurement kpi dashboard snapshot data driven and editable ppt sample file. This is a procurement kpi dashboard data driven and editable ppt sample file. This is a seven stage process. The stages in this process are business, strategy, growth, finance, chart and graph.
-
 32758047 style essentials 2 financials 5 piece powerpoint presentation diagram infographic slide
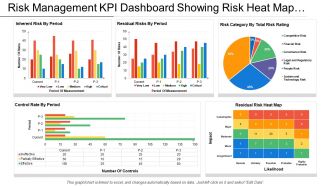
Presenting this set of slides with name - Risk Management Kpi Dashboard Showing Risk Heat Map And Control Rate By Period. This is a five stage process. The stages in this process are Risk Management, Risk Assessment, Project Risk.
-
 22967863 style essentials 2 financials 4 piece powerpoint presentation diagram infographic slide
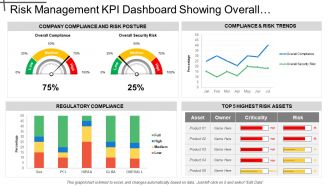
Presenting this set of slides with name - Risk Management Kpi Dashboard Showing Overall Security Risk And Regulatory Compliance. This is a four stage process. The stages in this process are Risk Management, Risk Assessment, Project Risk.
-
 46459822 style essentials 2 financials 5 piece powerpoint presentation diagram infographic slide
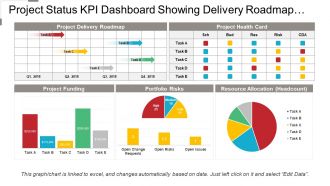
Presenting project status KPI dashboard snapshot showing delivery roadmap and resource allocation. Simple data input with linked Excel chart, just right click to input values. This PowerPoint theme is fully supported by Google slides. Picture quality of these slides does not change even when project on large screen. Fast downloading speed and formats can be easily changed to JPEG and PDF applications. This template is suitable for marketing, sales persons, business managers and entrepreneurs. Adjust PPT layout, font, text and color as per your necessity.
-
 Growth chart with arrow for data driven study powerpoint slides
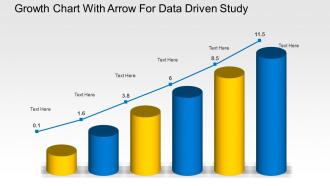
We are proud to present our growth chart with arrow for data driven study powerpoint slides. Graphic of growth chart with arrow has been used to design this power point template diagram. This PPT diagram contains the concept of data driven growth analysis. Use this PPT diagram for business and finance related presentations.
-
 83204842 style essentials 2 financials 5 piece powerpoint presentation diagram infographic slide
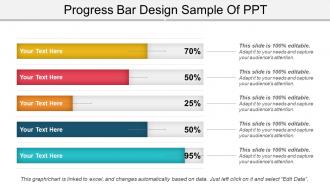
Presenting a PowerPoint slide named Progress Bar Design Sample of PPT. Use this completely customizable and easy-to-edit PPT slide to communicate your ideas in the presentation. You can format the font size, color and style of the slide. Add your desired content anywhere in the slide. Its compatibility with Google Slides makes it readily accessible. You can save it in PDF, JPEG or JPG formats. This PPT slide is Excel-linked. You can avail it in a widescreen size as well a standard size screen.
-
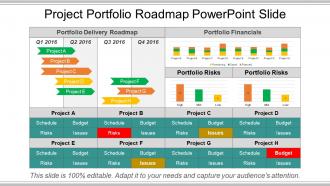 94666944 style essentials 2 financials 4 piece powerpoint presentation diagram infographic slide
Presenting project portfolio roadmap PowerPoint slide. This is professional developed Presentation graphic. The PPT layout also provides the high resolution quality levels which remains unaffected even when projected on to the wider screens. This PPT slide is also simple to use and download. All the features diagram, chart, design, pattern, size, color, and PowerPoint image etc. are totally modifiable. This is also well conversant with the Google Slides and other operating software. Can be used with the different file formats such as PDF or JPG.
-
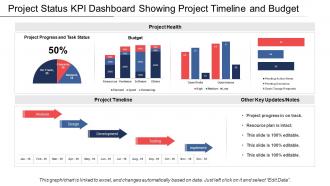 36987347 style essentials 2 financials 5 piece powerpoint presentation diagram infographic slide
Presenting this set of slides with name - Project Status Kpi Dashboard Showing Project Timeline And Budget. This is a five stage process. The stages in this process are Project Health Card, Project Performance, Project Status.
-
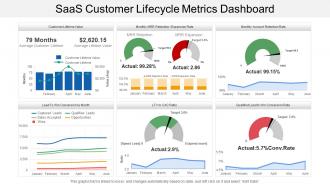 72671910 style essentials 2 financials 6 piece powerpoint presentation diagram infographic slide
Presenting this set of slides with name - Saas Customer Lifecycle Metrics Dashboard. Highlighting Saas customer lifecycle metrics dashboard PowerPoint presentation. Offer 100% access to change the size and style of the slides once downloaded and saved in the desired format. Beneficial for the business managers, marketing professionals and the strategy designers. Access to convert the presentation design into JPG and PDF. High quality images and visuals used in the designing process. Choice to get presentation slide in standard or in widescreen view. Easy to convert in JPEG and PDF document.
-
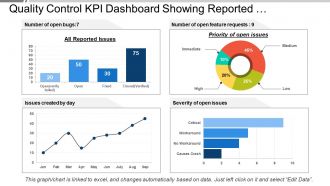 97612759 style essentials 2 financials 4 piece powerpoint presentation diagram infographic slide
Presenting this set of slides with name - Quality Control Kpi Dashboard Showing Reported Issues And Priority. This is a four stage process. The stages in this process are Quality Management, Quality Control, Quality Assurance.
-
 93740919 style essentials 2 financials 4 piece powerpoint presentation diagram infographic slide
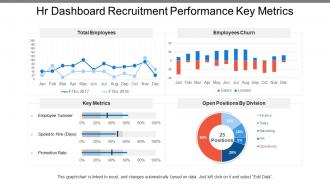
Presenting this set of slides with name - Hr Dashboard Snapshot Recruitment Performance Key Metrics. This is a four stage process. The stages in this process are Hr Dashboard, Human Resource Dashboard, Hr Kpi.
-
 69223260 style essentials 2 financials 3 piece powerpoint presentation diagram infographic slide
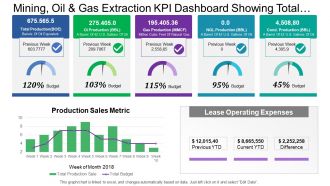
Presenting this set of slides with name - Mining Oil And Gas Extraction Kpi Dashboard Showing Total Production And Budget. This is a three stage process. The stages in this process are Mining, Oil And Gas Extraction, Refinery, Natural Gas.
-
 Manufacturing kpi dashboard showing overall equipment effectiveness
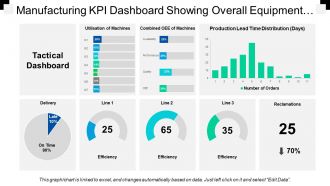
Presenting this set of slides with name - Manufacturing Kpi Dashboard Showing Overall Equipment Effectiveness. This is a eight stage process. The stages in this process are Manufacturing, Production, Manufacture.
-
 Data driven human resource management powerpoint slides
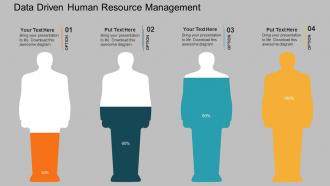
All images are 100% editable in the presentation design. Good quality images can be used to compliment message. Works well in Windows 7, 8, 10, XP, Vista and Citrix. Editing in presentation slide show can be done from anywhere by any device. Students, teachers, businessmen or industrial managers can put to use the PPT layout as per their requirement. Compatibility with Google slides. PPT graphic offers font size which can be read from a distance. High resolution is offered by the presentation slide show.
-
 54724502 style essentials 2 financials 5 piece powerpoint presentation diagram infographic slide
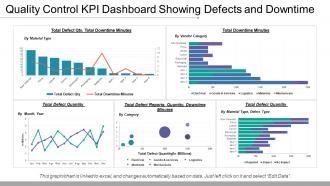
Presenting this set of slides with name - Quality Control Kpi Dashboard Showing Defects And Downtime. This is a five stage process. The stages in this process are Quality Management, Quality Control, Quality Assurance.
-
 40148407 style essentials 2 financials 4 piece powerpoint presentation diagram infographic slide
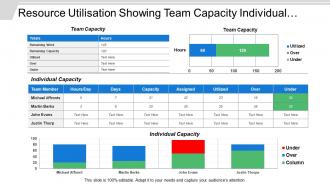
Presenting this set of slides with name - Resource Utilisation Showing Team Capacity Individual Capacity. This is a four stage process. The stages in this process are Resource Management, Resource Utilization, Resource Allocation.
-
 40186317 style essentials 2 financials 7 piece powerpoint presentation diagram infographic slide
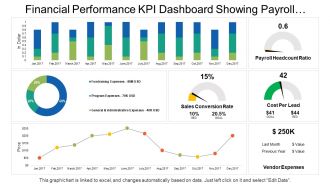
Presenting this set of slides with name - Financial Performance Kpi Dashboard Showing Payroll Headcount Ratio Cost Per Lead. This is a seven stage process. The stages in this process are Financial Performance, Financial Report, Financial Review.
-
 6595417 style essentials 2 financials 4 piece powerpoint presentation diagram infographic slide
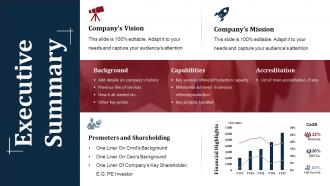
Presenting executive summary powerpoint slide background image. • Tension free download possible. • Once downloaded, the presentation can be modified to any format like JPG, JPEG, PDF, etc • It’s also compatible with multiple software and Google slides. • The provided executive summary PPT presentation template can easily be used solely or as part your pre built presentation. • Be happy to customize and personalize the presentation with company specifications. • There is no hassle when any fact, figures or text is to be included or excluded in the presentation. • Picture quality compatible with wide screen exposure. • Much appreciated and used by business executives, professionals, students and teachers.
-
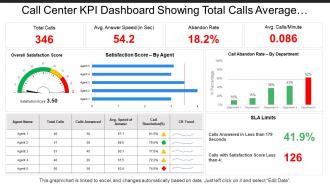 38203634 style essentials 2 financials 5 piece powerpoint presentation diagram infographic slide
Presenting this set of slides with name - Call Center Kpi Dashboard Showing Total Calls Average Answer Speed Abandon Rate. This is a five stage process. The stages in this process are Call Center Agent, Customer Care, Client Support.
-
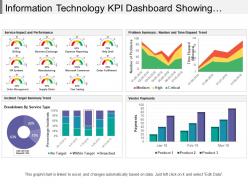 75506128 style essentials 2 financials 5 piece powerpoint presentation diagram infographic slide
Presenting this set of slides with name - Information Technology Kpi Dashboard Showing Incident Target Summary Trend. This is a five stage process. The stages in this process are Information Technology, It, Iot.
-
 70257157 style division donut 2 piece powerpoint presentation diagram infographic slide
Presenting project name cost baseline portfolio dashboards PPT template. Download is quick and can be easily shared. Conveys a sense of change over time. Suitable for corporate leaders and business associates. Flexible PPT slide as can be used whenever required. PowerPoint design can be shared in Standard and Widescreen view. High quality graphics and visuals used in the PPT. Option to include business content i.e. name, logo and text. Effortless conversion into PDF/ JPG format. Can be easily merged with your ongoing presentation slides.
-
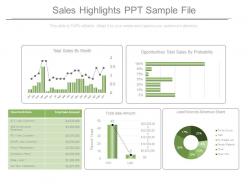 70238124 style essentials 2 financials 5 piece powerpoint presentation diagram infographic slide
Presenting sales highlights ppt sample file. This is a sales highlights ppt sample file. This is a five stage process. The stages in this process are total sales by month, opportunities total sales by probability, opportunity name amount, total sale amount, lead sources revenue share.
-
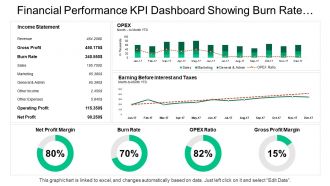 19907513 style essentials 2 financials 4 piece powerpoint presentation diagram infographic slide
Presenting this set of slides with name - Financial Performance Kpi Dashboard Showing Burn Rate Opex Ratio Gross Profit. This is a four stage process. The stages in this process are Financial Performance, Financial Report, Financial Review.
-
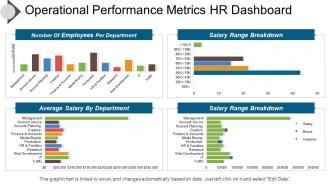 22655294 style essentials 2 financials 4 piece powerpoint presentation diagram infographic slide
Introducing operational performance metric HR PPT image. Fully regulated PowerPoint template quite reasonable for the HR and management professionals and business specialists. Extensive scope for reviving the dummy data and can add company logo, trademark etc. Reconvert able background PPT image, subject matter, designs, context etc. according to need. Versant with all Google Slides and other system applications. Can be easily projected over wide screen with exceptional picture quality.
-
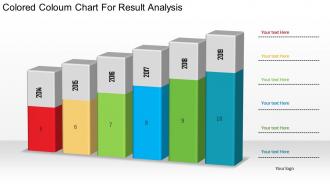 1214 colored coloum chart for result analysis powerpoint slide
We are proud to present our 1214 colored coloum chart for result analysis powerpoint slide. Colored column chart has been used to craft this power point template. This PPT slide contains the concept of result analysis. Use this PPT slide for your finance and marketing related presentations.
-
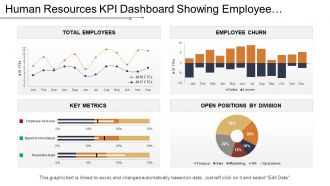 61035884 style essentials 2 financials 4 piece powerpoint presentation diagram infographic slide
Presenting this set of slides with name - Kpi Dashboard Showing Employee Churn Key Metrics And Open Positions. This is a four stage process. The stages in this process are Human Resource, Hrm, Human Capital.
-
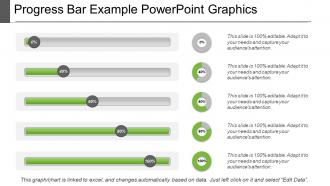 38673194 style essentials 2 financials 5 piece powerpoint presentation diagram infographic slide
We brings to you the progress bar example PowerPoint graphics. You can download this PPT completely free of cost. You just have to edit the data in a pre-designed format and present it. You can insert pictures and new slides to this ready-made deck of slides. All these slides are fully compatible with Google Slides. This presentation can be downloaded in JPG and PDF formats. It can be viewed in the 16:9 ratio widescreen size and the ratio of 4:3 standard screen size.
-
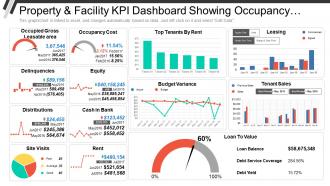 53694906 style essentials 2 financials 4 piece powerpoint presentation diagram infographic slide
Presenting Property And Facility KPI Dashboard Showing Occupancy Cost Delinquencies And Distributions PPT slide. The Property And Facility KPI Dashboard PPT slide designed professionally by the team of SlideTeam to present the different parameters. These parameters have illustrated by different charts such as bar, line and pie chart, along with that the text in the KPI metric dashboard slide is customizable in PowerPoint. The logistics KPI dashboard template is compatible with Google Slide. A user can do alteration in the font size, font type, color and dimensions of the different figures as per the requirement.
-
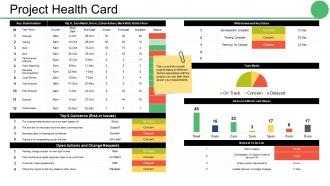 97795543 style essentials 2 compare 3 piece powerpoint presentation diagram infographic slide
Presenting health card PPT gallery rules. This layout is fully compatible with Google slides and data driven. User can edit the data in linked excel sheet and graphs and charts gets customized accordingly. Easy to put in company logo, trademark or name; accommodate words to support the key points. Images do no distort out even when they are projected on large screen. Adjust colors, text and fonts as per your business requirements
-
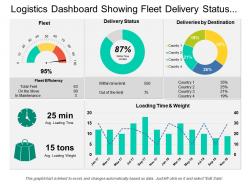 181595 style essentials 2 financials 3 piece powerpoint presentation diagram infographic slide
Presenting this set of slides with name - Logistics Dashboard Showing Fleet Delivery Status And Delivery By Destination. This is a three stage process. The stages in this process are Logistics Dashboard, Logistics Kpis, Logistics Performance.
-
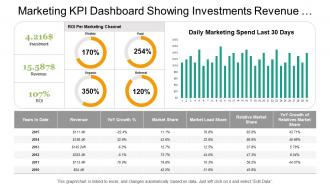 2166426 style division donut 3 piece powerpoint presentation diagram infographic slide
Presenting marketing kpi dashboard showing investments revenue metrics details presentation template slide. The PPT template is very user friendly as it allows you to make numerous changes to the editable slides. You can amend the font size, font style and also the font color as per your requirements. Template slide can be downloaded quickly and cab be saved in format of PDF or JPG easily. The template slide after being downloaded can be viewed in large screen display ratio of 16:9 or standard size display ratio of 4:3.
-
 60486942 style essentials 2 financials 4 piece powerpoint presentation diagram infographic slide
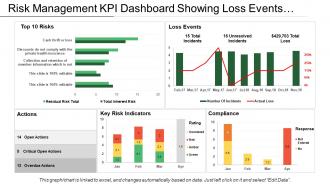
Presenting this set of slides with name - Risk Management Kpi Dashboard Showing Loss Events Actions And Compliance. This is a four stage process. The stages in this process are Risk Management, Risk Assessment, Project Risk.
-
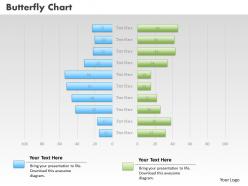 0414 butterfly bar chart business illustartion powerpoint graph
You can use slide fluently on all software. Rapid transformation to JPG and PDF formats. Highly compatible with Google slides for easy and shared information access. Widescreen viewing without PPT graphics pixelation. Add company logo, name and trademark for specificity. Editable layout with the option to alter features like font, text, color and design. High resolution PPT graphics for better clarity. Usable in businesses, small and large, startups, project management, strategic firms, quality assurance departments, government offices and educational institutes.
-
 54039612 style essentials 2 dashboard 4 piece powerpoint presentation diagram template slide
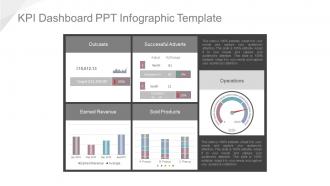
Presenting kpi dashboard ppt infographic template. This is a Kpi Dashboard Ppt Infographic Template. This is a four stage. The Stages in this process are outcasts, successful adverts, earned revenue, sold products, operations.
-
 50469508 style essentials 2 financials 6 piece powerpoint presentation diagram infographic slide
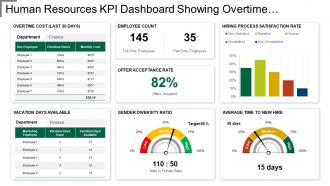
Presenting this set of slides with name - Kpi Dashboard Showing Overtime Cost Gender Diversity Ratio. This is a six stage process. The stages in this process are Human Resource, Hrm, Human Capital.
-
 54110994 style essentials 2 financials 4 piece powerpoint presentation diagram infographic slide
Presenting project name status schedule and management dashboard PowerPoint template. Presentation slides are compatible with Google slides. Download is quick and can be easily shared. Conveys a sense of change over time. Suitable for corporate leaders and business associates. Flexible PPT slide as can be used whenever required. PowerPoint design can be shared in Standard and Widescreen view. High quality graphics and visuals used in the PPT. Option to include business content i.e. name, logo and text. Effortless conversion into PDF/ JPG format.
-
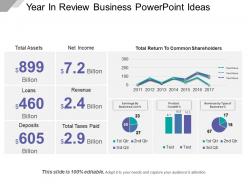 68619290 style essentials 2 financials 3 piece powerpoint presentation diagram template slide
Presenting Year In Review Business PowerPoint Ideas. Get this Excel linked PPT slide and deliver quality presentations to your audience. You are free to make changes in any part of the slide. Modify the colors as per your choice, change the font type and font size and save this in JPG and PDF formats. This is entirely compatible with Google Slides and can be viewed on the standard screen and widescreen.
-
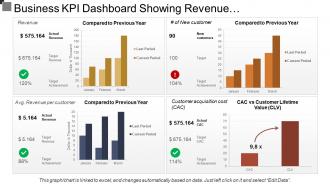 40357147 style essentials 2 financials 4 piece powerpoint presentation diagram infographic slide
Presenting this set of slides with name - Business Kpi Dashboard Showing Revenue And Customer Lifetime Value. This is a four stage process. The stages in this process are Business Dashboard, Business Kpi, Business Performance.
-
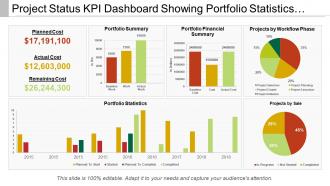 59551623 style essentials 2 financials 6 piece powerpoint presentation diagram infographic slide
Presenting Project Status Kpi Dashboard Showing Portfolio Statistics And Workflow Phase PPT template. All around planned layout slide. This template slide is completely perfect with Google. Tend to upgrade the general effect of your introduction. Introduced to be spared in JPEG, JPG or PDF arrange whenever required. Space accessible to include your organization data as and when required. The format slide is famous and popular because of its simple utilize and openness. Basic and accommodating downloading by following clear advances. This slide keeps up the demonstrable skill of the introduction.
-
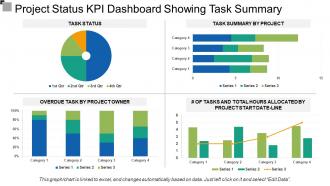 63007252 style essentials 2 financials 4 piece powerpoint presentation diagram infographic slide
Presentation template is attainable in standard and widescreen view. Presentation slides created with high quality resolution design. Totally variable design as color, text and font can be edited with ease. PPT slide easy to download with different slides. Easy to transmute the presentation slide into JPEG and PDF document. Download is quick. PowerPoint slide helps you to save time and effort. Just enter the business information and share with your shareholders, clients, team etc. Professionally crafted with concept in mind.
-
 52956137 style concepts 1 growth 5 piece powerpoint presentation diagram infographic slide
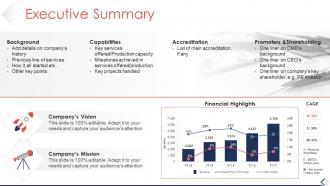
Presenting Executive Summary PowerPoint Slide Download template. You can include charts and graphs for a clear representation of facts. The PPT also supports the standard (4:3) and widescreen (16:9) aspect ratios. It is having compatibility with Google Slides. Save this into common images or document formats like JPEG, PNG, or PDF. High-quality graphics will ensure that picture quality does not deteriorate.
-
 51964122 style essentials 2 financials 2 piece powerpoint presentation diagram infographic slide
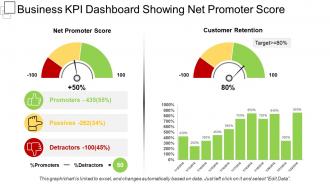
Presenting this set of slides with name - Business Kpi Dashboard Snapshot Showing Net Promoter Score. This is a two stage process. The stages in this process are Business Dashboard, Business Kpi, Business Performance.


