All Division Pie Powerpoint Diagram Slide
-
 24549710 style division pie 3 piece powerpoint presentation diagram infographic slide
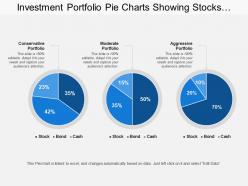
Presenting this set of slides with name - Investment Portfolio Pie Charts Showing Stocks Bonds Cash With Conservative Portfolio. This is a three stage process. The stages in this process are Investment Portfolio, Funding Portfolio, Expenditure Portfolio.
-
 54168160 style division pie 4 piece powerpoint presentation diagram infographic slide
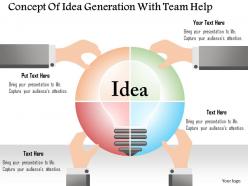
Innovative slide design with the concept of idea generation with team help useful for business analysts, market researchers, sales and marketing people, etc. Completely editable content including fonts, text, colors, etc. Compatible with number of software options. Personalize the presentation with individual company name and logo. Excellence in picture quality even on wide screen output. Easy and quick downloading process. Compatible with Google slides. Adaptable PPT designs as can be converted into JPEG and PDF.
-
 53840771 style circular loop 4 piece powerpoint presentation diagram infographic slide
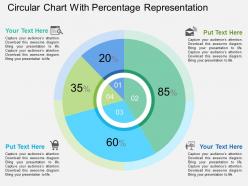
We are proud to present our circular chart with percentage representation flat powerpoint design. Graphic of circular chart and percentage graphics has been used to design this power point template diagram. This PPT diagram contains the concept of financial analysis. Use this PPT diagram for business and marketing related presentations.
-
 33259178 style division pie 5 piece powerpoint presentation diagram infographic slide
Presenting leadership presentation man on pie chart. This is a leadership presentation man on pie chart. This is a five stage process. The stages in this process are leadership presentation, directionship outline, governship introduction.
-
 42309004 style essentials 2 financials 5 piece powerpoint presentation diagram infographic slide
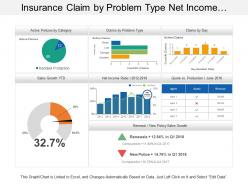
Presenting this set of slides with name - Insurance Claim By Problem Type Net Income Ratio Dashboard. This is a five stage process. The stages in this process are Assurance, Surety, Insurance.
-
 10569879 style division pie 5 piece powerpoint presentation diagram infographic slide
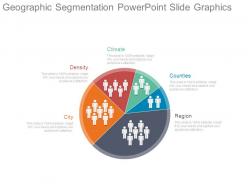
Presenting geographic segmentation powerpoint slide graphics. This is a geographic segmentation powerpoint slide graphics. This is a five stage process. The stages in this process are city, density, climate, counties, region.
-
 29605289 style division pie 5 piece powerpoint presentation diagram infographic slide
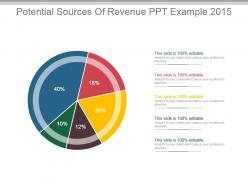
Presenting potential sources of revenue ppt example 2015. This is a potential sources of revenue ppt example 2015. This is a five stage process. The stages in this process are business, management, marketing, finance, pie.
-
 94044753 style division pie 3 piece powerpoint presentation diagram infographic slide
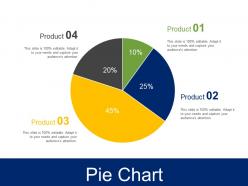
Presenting pie chart ppt infographic template. This is a pie chart ppt infographic template. This is a four stage process. The stages in this process are chart, percentage, business, marketing, strategy.
-
 26439980 style division pie 5 piece powerpoint presentation diagram infographic slide
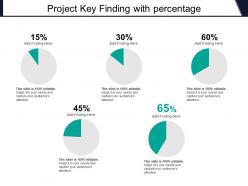
Presenting this set of slides with name - Project Key Finding With Percentage. This is a five stage process. The stages in this process are Key Findings, Key Achievements, Key Accomplishment.
-
 42579406 style division pie 9 piece powerpoint presentation diagram infographic slide
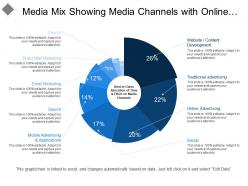
Presenting this set of slides with name - Media Mix Showing Media Channels With Online And Traditional Advertising. This is a nine stage process. The stages in this process are Media Mix, Communication Channel, Mass Media.
-
 66824655 style concepts 1 leadership 6 piece powerpoint presentation diagram infographic slide
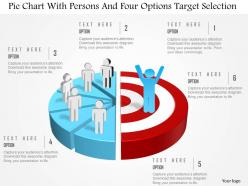
We are proud to present our 0115 pie chart with persons and six options target selection powerpoint template. This power point template slide has been crafted with graphic of pie chart ,persons and six options. This PPT contains the concept of option representation for targets selection. This PPT diagram is can be used business and sales presentations.
-
 24901146 style division pie 5 piece powerpoint presentation diagram infographic slide
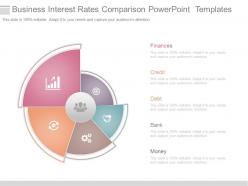
Presenting business interest rates comparison powerpoint templates. This is a business interest rates comparison powerpoint templates. This is a five stage process. The stages in this process are finances, credit, debt, bank, money.
-
 85757183 style division pie 6 piece powerpoint presentation diagram infographic slide
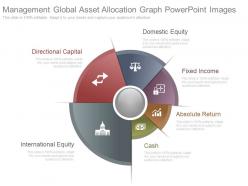
Presenting management global asset allocation graph powerpoint images. This is a management global asset allocation graph powerpoint images. This is a six stage process. The stages in this process are domestic equity, fixed income, absolute return, cash, international equity, directional capital.
-
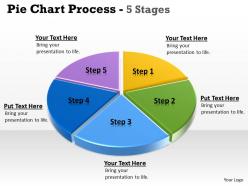 59065975 style division pie 5 piece powerpoint template diagram graphic slide
This template is skillfully designed and is completely editable to suit all the needs and requirements of the user. The color of the font, its size, style, and all other elements can be customized according to the user's desire The text in the PPT placeholder can be replaced with the desired information making this template highly flexible and adaptable as well. This template is also compatible with various Microsoft versions and formats like Google Slides, JPG, PDF, etc so the user will face no issue in saving it in the format of his choice.
-
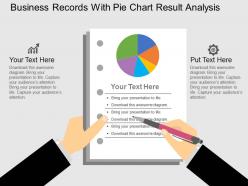 75296555 style concepts 1 opportunity 2 piece powerpoint presentation diagram infographic slide
Presenting we business records with pie chart result analysis flat powerpoint design. This Power Point template diagram has been crafted with graphic of business records and pie chart diagram. This PPT diagram contains the concept of business result analysis. Use this PPT diagram for business and marketing related presentations.
-
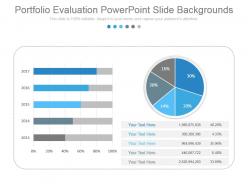 15827367 style division pie 5 piece powerpoint presentation diagram infographic slide
Presenting portfolio evaluation powerpoint slide backgrounds. This is a portfolio evaluation powerpoint slide backgrounds. This is a five stage process. The stages in this process are business, marketing, management, strategy, process.
-
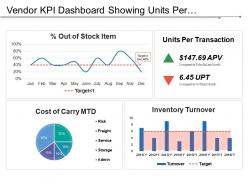 82188138 style essentials 2 financials 4 piece powerpoint presentation diagram infographic slide
Presenting this set of slides with name - Vendor Kpi Dashboard Showing Units Per Transaction Percentage Out Of Stock Items. This is a four stage process. The stages in this process are Vendor, Supplier, Retailer.
-
 86267609 style division pie 3 piece powerpoint presentation diagram infographic slide
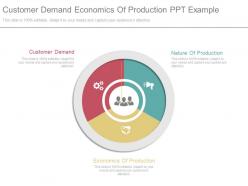
Presenting customer demand economics of production ppt example. This is a customer demand economics of production ppt example. This is a three stage process. The stages in this process are nature of production, economics of production, customer demand.
-
 38296880 style division pie 5 piece powerpoint presentation diagram infographic slide
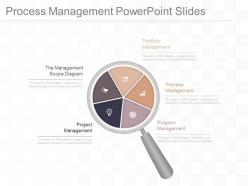
Presenting process management powerpoint slides. This is a process management powerpoint slides. This is a five stage process. The stages in this process are portfolio management, process management, program management, project management, the management scope diagram.
-
 12883535 style division pie 4 piece powerpoint presentation diagram infographic slide
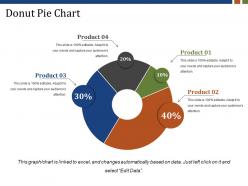
Presenting Donut Pie Chart Presentation PowerPoint slide. This PPT theme is available in both 4:3 and 16:9 aspect ratios. As this PowerPoint template is 100% editable, you can modify color, font size, font type, and shapes as per your requirements. This PPT presentation is Google Slides compatible hence it is easily accessible. You can download and save this PowerPoint layout in different formats like PDF, PNG, and JPG.
-
 63495381 style circular loop 7 piece powerpoint presentation diagram template slide
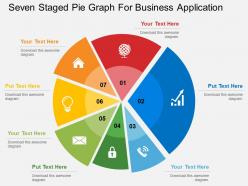
We are proud to present our seven staged pie graph for business application flat powerpoint design. Seven staged pie graph has been used to craft this power point template diagram. This PPT diagram contains the concept of business application. Use this PPT diagram for business and marketing related presentations.
-
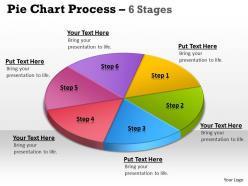 31209988 style division pie 6 piece powerpoint template diagram graphic slide
This template is skillfully designed and is completely editable to suit all the needs and requirements of the user. The color of the font, its size, style, and all other elements can be customized according to the user's desire The text in the PPT placeholder can be replaced with the desired information making this template highly flexible and adaptable as well. This template is also compatible with various Microsoft versions and formats like Google Slides, JPG, PDF, etc so the user will face no issue in saving it in the format of his choice.
-
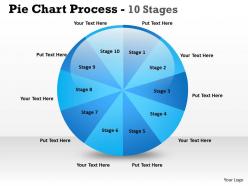 70478218 style division pie 10 piece powerpoint template diagram graphic slide
This template is skillfully designed and is completely editable to suit all the needs and requirements of the user. The color of the font, its size, style, and all other elements can be customized according to the user's desire The text in the PPT placeholder can be replaced with the desired information making this template highly flexible and adaptable as well. This template is also compatible with various Microsoft versions and formats like Google Slides, JPG, PDF, etc so the user will face no issue in saving it in the format of his choice.
-
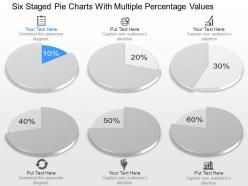 61578473 style division pie 6 piece powerpoint presentation diagram infographic slide
Presenting pp six staged pie charts with multiple percentage values powerpoint template. Six staged pie chart diagram and percentage values has been used to craft this power point template diagram. This PPT diagram contains the concept of business data and result analysis representation. Use this PPT diagram for business and finance related presentations.
-
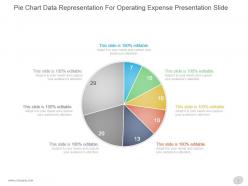 87660521 style division pie 7 piece powerpoint presentation diagram infographic slide
Presenting pie chart data representation for operating expense presentation slide. This is a pie chart data representation for operating expense presentation slide. This is a seven stage process. The stages in this process are business, marketing, pie, circle, piece.
-
 95461007 style essentials 1 location 2 piece powerpoint presentation diagram infographic slide
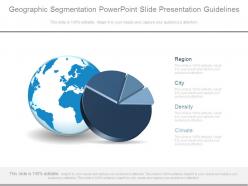
Presenting geographic segmentation powerpoint slide presentation guidelines. This is a geographic segmentation powerpoint slide presentation guidelines. This is a two stage process. The stages in this process are region, city, density, climate.
-
 67647718 style division pie 4 piece powerpoint presentation diagram template slide
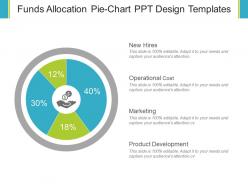
Presenting funds allocation pie chart PPT design templates presentation slide. The cyclic design template is completely compatible with Google Slides and a user can edit it in PowerPoint. You can insert your organization's name and logo in this slide. Slide's quality remains the same, even after doing changes in it such as color, font size, font type, aspect ratio and insert text as per requirement. You may download this pie chart diagram template easily. The pie chart slide is compatible with other formats such as JPEG and PDF.
-
 93760140 style division pie 7 piece powerpoint template diagram graphic slide
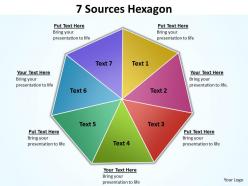
This template is skillfully designed and is completely editable to suit all the needs and requirements of the user. The color of the font, its size, style, and all other elements can be customized according to the user's desire The text in the PPT placeholder can be replaced with the desired information making this template highly flexible and adaptable as well. This template is also compatible with various Microsoft versions and formats like Google Slides, JPG, PDF, etc so the user will face no issue in saving it in the format of his choice.
-
 26635721 style division pie 2 piece powerpoint presentation diagram infographic slide
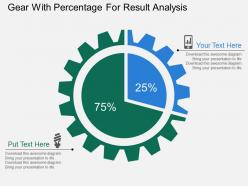
We are proud to present our grear with percentage for result analysis flat powerpoint design. This power point template diagram has been crafted with graphic of gear and percentage graphics. This PPT diagram contains the concept of result analysis. Use this PPT diagram for business and finance related presentations.
-
 82984721 style division pie 3 piece powerpoint presentation diagram infographic slide
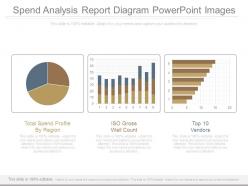
Presenting spend analysis report diagram powerpoint images. This is a spend analysis report diagram powerpoint images. This is a three stage process. The stages in this process are total spend profile by region, iso gross well count, top vendors.
-
 97104956 style division pie 3 piece powerpoint presentation diagram infographic slide
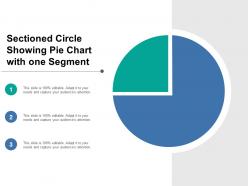
Presenting this set of slides with name - Sectioned Circle Showing Pie Chart With One Segment. This is a three stage process. The stages in this process are Sectioned Circle, Segmented Circle, Partitioned Circle.
-
 33724209 style division pie 3 piece powerpoint presentation diagram infographic slide
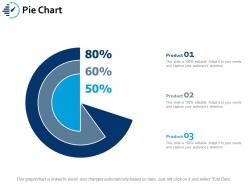
Presenting this set of slides with name - Pie Chart Ppt Portfolio Graphics Example. This is a three stage process. The stages in this process are Business, Management, Strategy, Analysis, Marketing.
-
 22277796 style division pie 5 piece powerpoint presentation diagram infographic slide
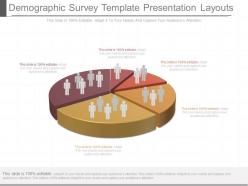
Presenting ppt demographic survey template presentation layouts. This is a demographic survey template presentation layouts. This is a five stage process. The stages in this process are strategy, business, finance, marketing, planning.
-
 84566967 style division pie 4 piece powerpoint presentation diagram infographic slide
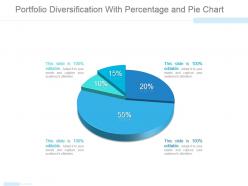
Presenting portfolio diversification with percentage and pie chart ppt design. This is a portfolio diversification with percentage and pie chart ppt design. This is a four stage process. The stages in this process are pie, percentage, divide, chart, portfolio.
-
 90005844 style division pie 5 piece powerpoint presentation diagram infographic slide
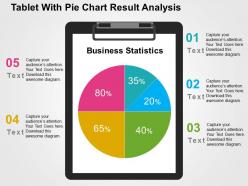
We are proud to present our tablet with pie chart result analysis flat powerpoint design. Graphic of tablet with pie chart been used to craft this power point template diagram. This PPT diagram contains the concept of result analysis. Use this PPT diagram for internet technology and business related presentations.
-
 46175448 style concepts 1 growth 11 piece powerpoint presentation diagram infographic slide
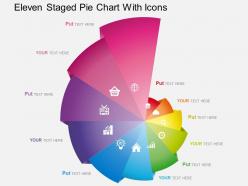
Presenting es eleven staged pie chart with icons powerpoint template. Eleven staged pie chart and icons diagram has been used to craft this PowerPoint template diagram. This PPT diagram contains the concept of result analysis. Use this PPT diagram for business and marketing related presentations.
-
 25887092 style division pie 3 piece powerpoint presentation diagram infographic slide
Presenting commercial report presentation images PowerPoint presentation which is 100% editable. This PPT template is crafted with attractive display and unique components. This PPT slide is easy to customize and enables you to personalize it as per your own criteria. The presentation slide is fully compatible with Google slides, multiple format and software options. In case of any assistance, kindly take instructions from our presentation design services and it is easy to download in a very short span of time. The images, layouts, designs are of high quality and ensures quality in widescreen.
-
 90334853 style division pie 2 piece powerpoint presentation diagram infographic slide
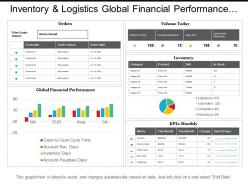
Presenting this set of slides with name - Inventory And Logistics Global Financial Performance Dashboards. This is a two stage process. The stages in this process are Inventory And Logistics, Inventory Management, Warehousing And Inventory Management.
-
 99011717 style division pie 4 piece powerpoint template diagram graphic slide
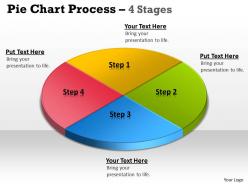
This template is skillfully designed and is completely editable to suit all the needs and requirements of the user. The color of the font, its size, style, and all other elements can be customized according to the user's desire The text in the PPT placeholder can be replaced with the desired information making this template highly flexible and adaptable as well. This template is also compatible with various Microsoft versions and formats like Google Slides, JPG, PDF, etc so the user will face no issue in saving it in the format of his choice.
-
 80744440 style essentials 2 financials 2 piece powerpoint presentation diagram infographic slide
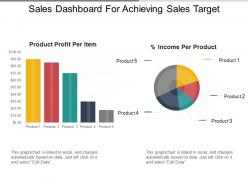
SlideTeam would like to introduce all of you with this totally alterable and user-friendly sales dashboard for achieving sales target PPT templates. This PowerPoint presentation is fully editable which allows you to make changes to its predesigned slides. It allows you to change the size, color, and orientation of various features. By simply following the instructions given in the sample slides you can make these changes. The presentation allows you to save it in the format of either JPG or PDF. You can add or delete any given information from the already prepared slides.
-
 86041218 style division pie 4 piece powerpoint presentation diagram infographic slide
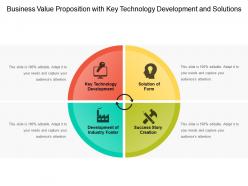
Presenting this set of slides with name - Business Value Proposition With Key Technology Development And Solutions. This is a four stage process. The stages in this process are Business Value Proposition, Business Value Analysis, Value Chain Analysis.
-
 2324425 style division pie 6 piece powerpoint presentation diagram infographic slide
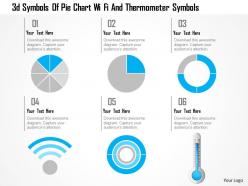
We are proud to present our 1214 3d symbols of pie chart wi fi and thermometer symbols powerpoint template. This power point template has been crafted with graphic of 3d pie charts with Wi-Fi symbol and thermometer. This PPT contains the concept of calculation and result analysis. Use this PPT for your business and science related presentations.
-
 89774903 style concepts 1 growth 1 piece powerpoint presentation diagram infographic slide
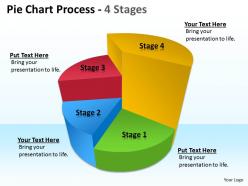
This template is skillfully designed and is completely editable to suit all the needs and requirements of the user. The color of the font, its size, style, and all other elements can be customized according to the user's desire The text in the PPT placeholder can be replaced with the desired information making this template highly flexible and adaptable as well. This template is also compatible with various Microsoft versions and formats like Google Slides, JPG, PDF, etc so the user will face no issue in saving it in the format of his choice.
-
 44699135 style division pie 6 piece powerpoint presentation diagram infographic slide
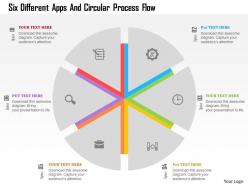
We are proud to present our six different apps and circular process flow flat powerpoint design. This power point template diagram has been crafted with graphic of six different apps and circular process. This PPT diagram contains the concept of process flow. Use this PPT diagram for business process flow related topics in any presentation.
-
 60477596 style division pie 7 piece powerpoint presentation diagram infographic slide
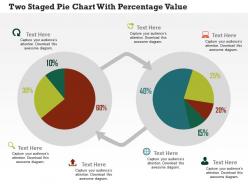
We are proud to present our two staged pie chart with percentage value flat powerpoint design. This power point template has been crafted with two staged pie chart and percentage value. This PPT diagram contains the concept of financial analysis. Use this PPT diagram for business and finance r elated presentations.
-
 49619726 style division pie 5 piece powerpoint presentation diagram infographic slide
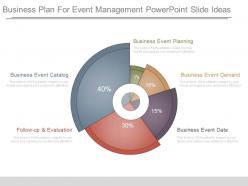
Presenting business plan for event management powerpoint slide ideas. This is a business plan for event management powerpoint slide ideas. This is a five stage process. The stages in this process are business event planning, business event demand, business event date, follow up and evaluation, business event catalog.
-
 47624704 style circular loop 8 piece powerpoint presentation diagram infographic slide
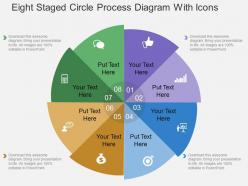
Presenting ex eight staged circle process diagram with icons flat powerpoint design. Eight staged circle process diagram with icons has been used to craft this power point template diagram. This PPT diagram contains the concept of process flow indication. Use this PPT diagram for business and marketing related presentations.
-
 39274305 style division pie 5 piece powerpoint presentation diagram infographic slide
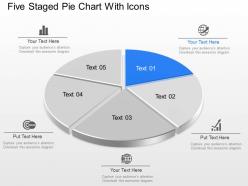
Presenting ml five staged pie chart with icons powerpoint template slide. Five staged pie chart and icons has been used to craft this power point template diagram. This PPT diagram contains the concept of business result analysis. Use this PPT diagram for marketing and business related presentation.
-
 11289864 style division pie 6 piece powerpoint presentation diagram infographic slide
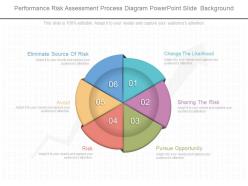
Presenting performance risk assessment process diagram powerpoint slide background. This is a performance risk assessment process diagram powerpoint slide background. This is a six stage process. The stages in this process are eliminate source of risk, change the likelihood, avoid, sharing the risk, risk, pursue opportunity.
-
 96430418 style division pie 5 piece powerpoint presentation diagram infographic slide
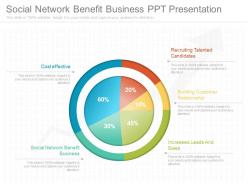
Presenting social network benefit business ppt presentation. This is a social network benefit business ppt presentation. This is a five stage process. The stages in this process are process, strategy, finance, marketing.
-
 96743287 style division pie 4 piece powerpoint presentation diagram infographic slide
Presenting this set of slides with name - Pie Chart Ppt File Design Templates. This is a four stage process. The stages in this process are Product, Pie, Process, Percentage, Finance.
-
 77129948 style division pie 5 piece powerpoint template diagram graphic slide
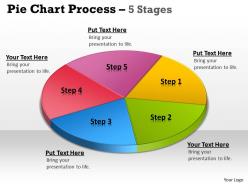
This template is skillfully designed and is completely editable to suit all the needs and requirements of the user. The color of the font, its size, style, and all other elements can be customized according to the user's desire The text in the PPT placeholder can be replaced with the desired information making this template highly flexible and adaptable as well. This template is also compatible with various Microsoft versions and formats like Google Slides, JPG, PDF, etc so the user will face no issue in saving it in the format of his choice.
-
 36755037 style division pie 8 piece powerpoint template diagram graphic slide
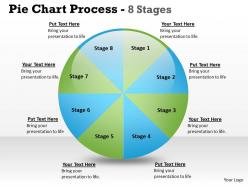
This template is skillfully designed and is completely editable to suit all the needs and requirements of the user. The color of the font, its size, style, and all other elements can be customized according to the user's desire The text in the PPT placeholder can be replaced with the desired information making this template highly flexible and adaptable as well. This template is also compatible with various Microsoft versions and formats like Google Slides, JPG, PDF, etc so the user will face no issue in saving it in the format of his choice.
-
 80561016 style division pie 5 piece powerpoint presentation diagram infographic slide
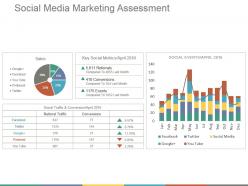
Presenting the social media marketing PowerPoint PPT. This slide is fully customizable PowerPoint template to communicate your ideas clearly. You can easily edit the charts and graphs in excel sheet. This presentation slide is designed with elegant shapes and visuals. You can convert this slide into numerous format options like JPEG, JPG or PDF. This template gives a professional outlook to your PowerPoint presentation. It is easy to customize each graphics and text as per your need. You can download it easily at a click of button.
-
 99455660 style division pie 3 piece powerpoint presentation diagram infographic slide
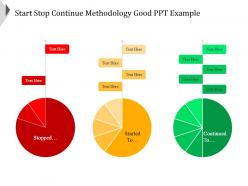
Presenting start stop continue methodology good ppt example. This is a start stop continue methodology good ppt example. This is a three stage process. The stages in this process are start stop continue.
-
 86257309 style circular semi 6 piece powerpoint presentation diagram infographic slide
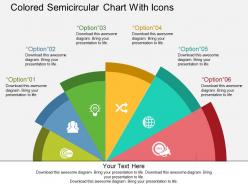
We are proud to present our colored semicircular chart with icons flat powerpoint design. This power point template diagram has been crafted with graphic of colored semicircular chart with icons .This PPT diagram contains the concept of result analysis. Use this PPT diagram for business and marketing related presentations.
-
 67177680 style concepts 1 leadership 8 piece powerpoint presentation diagram infographic slide
Presenting eq eight staged pie chart with 3d men and target selection powerpoint template. Eight staged pie chart and 3d men diagram has been used to craft this PowerPoint template diagram. This PPT diagram contains the concept of target selection and result analysis. Use this PPT diagram for business and sales related presentations.
-
 17375231 style division pie 5 piece powerpoint presentation diagram infographic slide
Presenting employee performance management best practices ppt sample. This is a employee performance management best practices ppt sample. This is a five stage process. The stages in this process are performance, management, circular, process, analysis.
-
 86685282 style division pie 4 piece powerpoint presentation diagram infographic slide
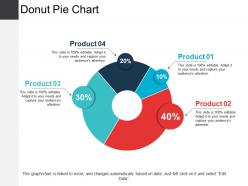
Presenting Donut Pie Chart PPT Presentation Examples. You can alter the font size, font type, font color, and shape used according to your needs as this PPT layout is 100% customizable. This PowerPoint template is Google Slides compatible and is easily accessible. This easy to download PPT theme can be easily opened and saved in various formats like JPG, PDF, and PNG.
-
 34528142 style division pie 6 piece powerpoint presentation diagram template slide
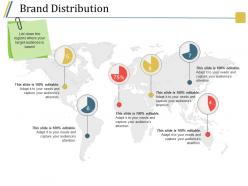
Presenting brand distribution powerpoint show. This is a brand distribution powerpoint show. This is a six stage process. The stages in this process are pie, location, percentage, map, geographical.


