85254745 style division pie 2 piece powerpoint presentation diagram infographic slide
Make an articulate analysis with our Male Vs Female Employment Statistics Ppt Design. The audience will accept your conclusions.
Make an articulate analysis with our Male Vs Female Employment Statistics Ppt Design. The audience will accept your conclus..
- Google Slides is a new FREE Presentation software from Google.
- All our content is 100% compatible with Google Slides.
- Just download our designs, and upload them to Google Slides and they will work automatically.
- Amaze your audience with SlideTeam and Google Slides.
-
Want Changes to This PPT Slide? Check out our Presentation Design Services
- WideScreen Aspect ratio is becoming a very popular format. When you download this product, the downloaded ZIP will contain this product in both standard and widescreen format.
-

- Some older products that we have may only be in standard format, but they can easily be converted to widescreen.
- To do this, please open the SlideTeam product in Powerpoint, and go to
- Design ( On the top bar) -> Page Setup -> and select "On-screen Show (16:9)” in the drop down for "Slides Sized for".
- The slide or theme will change to widescreen, and all graphics will adjust automatically. You can similarly convert our content to any other desired screen aspect ratio.
Compatible With Google Slides

Get This In WideScreen
You must be logged in to download this presentation.
PowerPoint presentation slides
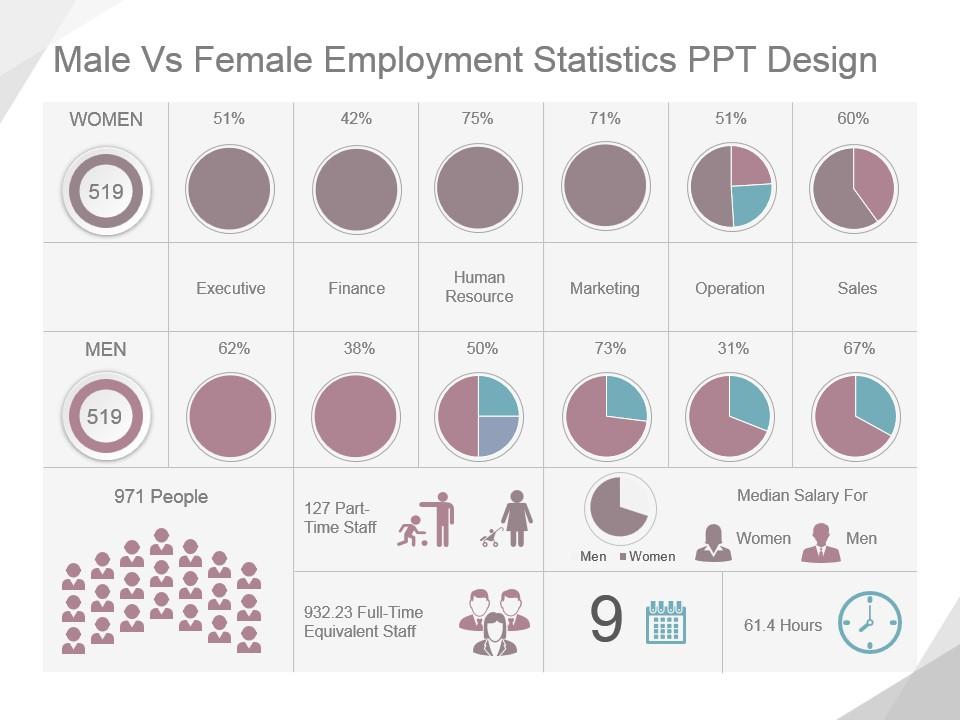
Presenting male vs female employment statistics ppt design. This is a male vs female employment statistics ppt design. This is a two stage process. The stages in this process are women, men, executive, finance, human resource, marketing, operation, sales, people, part time staff, full time equivalent staff, median salary for, hours.
85254745 style division pie 2 piece powerpoint presentation diagram infographic slide with all 5 slides:
Our Male Vs Female Employment Statistics Ppt Design ensure ample availability. There are always enough to go around.
-
Innovative and attractive designs.
-
Understandable and informative presentation.


