3655872 style essentials 1 roadmap 2 piece powerpoint presentation diagram infographic slide
Inspire your audience and create a definitive impact on them through our, business intelligence roadmap of six-month timeline include change management and process improvement PowerPoint layout. This business intelligence chart sheet will assist you to elaborate the tactics and technologies used by enterprises for the data interpretation of business information. Add relevant text in the text areas provided, and mention various phases involved in the process. Show your half-yearly analysis with current and predictive views of business operations. Include this process for examining data and granting actionable learning to help executives, managers and other corporate end users make learned business decisions Download business intelligence roadmap of six-month timeline include change management and process improvement PowerPoint layout and display your ideas in a more confident way. Our Business Intelligence Roadmap Of Six Month Timeline Include Change Management And Process Improvement help increase the degree of acceptance. It has a definite impact.
Inspire your audience and create a definitive impact on them through our, business intelligence roadmap of six-month timel..
- Google Slides is a new FREE Presentation software from Google.
- All our content is 100% compatible with Google Slides.
- Just download our designs, and upload them to Google Slides and they will work automatically.
- Amaze your audience with SlideTeam and Google Slides.
-
Want Changes to This PPT Slide? Check out our Presentation Design Services
- WideScreen Aspect ratio is becoming a very popular format. When you download this product, the downloaded ZIP will contain this product in both standard and widescreen format.
-

- Some older products that we have may only be in standard format, but they can easily be converted to widescreen.
- To do this, please open the SlideTeam product in Powerpoint, and go to
- Design ( On the top bar) -> Page Setup -> and select "On-screen Show (16:9)” in the drop down for "Slides Sized for".
- The slide or theme will change to widescreen, and all graphics will adjust automatically. You can similarly convert our content to any other desired screen aspect ratio.
Compatible With Google Slides

Get This In WideScreen
You must be logged in to download this presentation.
PowerPoint presentation slides
Presenting business intelligence roadmap of six-month timeline include change management and process improvement PowerPoint layout. Edit this business intelligence chart sheet to include your data by following a few simple steps. This PPT deck is fully editable. You can include your company logo or trademark and edit color patterns and text included here. Use this design with Google Slide and project on widescreens for your best experience. Accessible in both standard 4:3 and widescreen format 16:9 after downloading.
Content of this Powerpoint Presentation
Description:
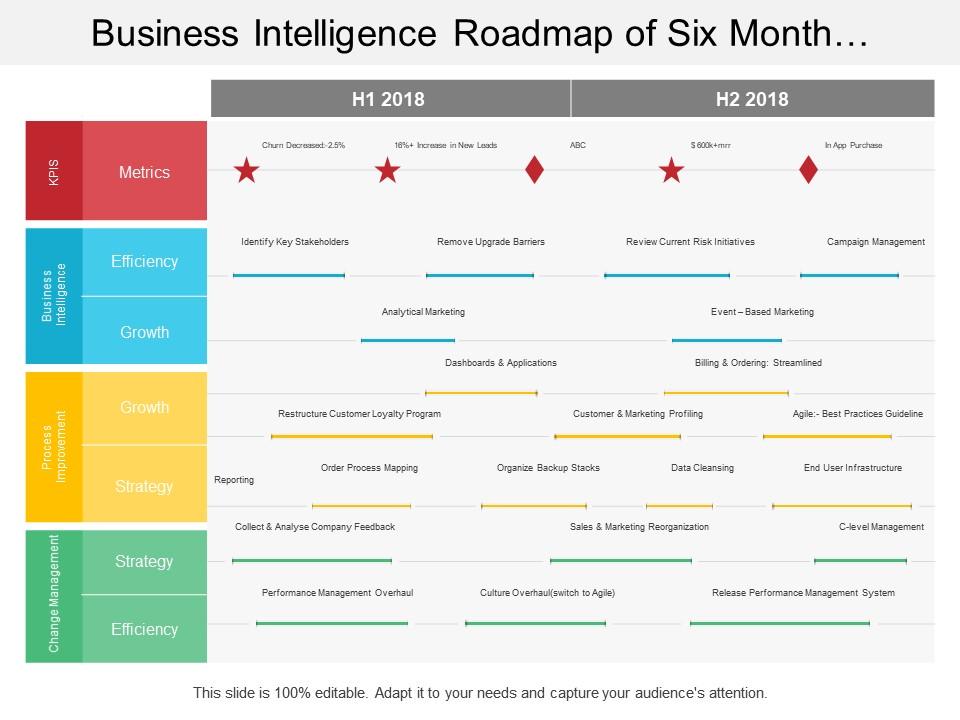
The image portrays a "Business Intelligence Roadmap of Six Months," divided into two halves of the year, H1 2018 and H2 2018. This roadmap is structured around four categories of business functions: Metrics, Efficiency, Growth, and Strategy. Each category is associated with specific goals or milestones for the respective term.
In H1 2018, under 'Metrics,' there are key performance indicators (KPIs) aiming for a 2.5% decrease in churn rate and a 16% increase in new leads. 'Efficiency' focuses on identifying key stakeholders and removing upgrade barriers. 'Growth' emphasizes analytical marketing. 'Strategy' involves analyzing company feedback and overhauling performance management.
H2 2018 is also categorized into 'Growth' and 'Strategy.' In 'Growth,' the goals include developing billing and ordering systems, refining customer profiling, and implementing Agile Best Practices. In 'Strategy,' there is an organizational restructuring plan in sales and marketing, a cultural shift towards Agile methodologies, and the release of a new performance management system.
Use Cases:
This roadmap structure can be applied in various industries' presentations where strategic business intelligence is crucial.
1. Technology:
Use: Outlining IT infrastructure improvements and software deployment timelines.
Presenter: Chief Technology Officer.
Audience: IT Department Staff.
2. Banking:
Use: Presentation for improving customer service and risk management.
Presenter: Head of Customer Relations.
Audience: Bank Stakeholders.
3. Healthcare:
Use: Strategy for patient data analysis improvements and operational efficiency.
Presenter: Hospital Administrator.
Audience: Health System Board Members.
4. Retail:
Use: Implementing a loyalty program and streamlining supply chain processes.
Presenter: Retail Operations Director.
Audience: Retail Management Team.
5. Education:
Use: Developing initiatives for student engagement and feedback collection.
Presenter: College Dean.
Audience: Educational Staff.
6. Manufacturing:
Use: Enhancing production efficiency and refining quality control metrics.
Presenter: Plant Manager.
Audience: Production Supervisors and Workers.
7. Marketing:
Use: Strategic plan for campaign management and market analytics.
Presenter: Marketing Manager.
Audience: Marketing and Sales Team.
3655872 style essentials 1 roadmap 2 piece powerpoint presentation diagram infographic slide with all 5 slides:
Get them to bury the hatchet with our Business Intelligence Roadmap Of Six Month Timeline Include Change Management And Process Improvement. Bring all fights to an end.
-
Commendable slides with attractive designs. Extremely pleased with the fact that they are easy to modify. Great work!
-
Designs have enough space to add content.


