Spot market pitch deck powerpoint presentation slides
Our Spot Market Pitch Deck Powerpoint Presentation Slides are topically designed to provide an attractive backdrop to any subject. Use them to look like a presentation pro.
- Google Slides is a new FREE Presentation software from Google.
- All our content is 100% compatible with Google Slides.
- Just download our designs, and upload them to Google Slides and they will work automatically.
- Amaze your audience with SlideTeam and Google Slides.
-
Want Changes to This PPT Slide? Check out our Presentation Design Services
- WideScreen Aspect ratio is becoming a very popular format. When you download this product, the downloaded ZIP will contain this product in both standard and widescreen format.
-

- Some older products that we have may only be in standard format, but they can easily be converted to widescreen.
- To do this, please open the SlideTeam product in Powerpoint, and go to
- Design ( On the top bar) -> Page Setup -> and select "On-screen Show (16:9)” in the drop down for "Slides Sized for".
- The slide or theme will change to widescreen, and all graphics will adjust automatically. You can similarly convert our content to any other desired screen aspect ratio.
Compatible With Google Slides

Get This In WideScreen
You must be logged in to download this presentation.
PowerPoint presentation slides
Presenting Spot Market Pitch Deck Powerpoint Presentation Slides. This slideshow is easy to download and can be presented in standard screen(14:6) and widescreen (16:9) ratios. Edit the font style, font color, and other components. This PPT compatible with Google slides. This PPT can be transformed into numerous documents or image formats like PDF or JPEG. High-quality graphics ensure that the picture quality is maintained.
Content of this Powerpoint Presentation
Slide 1: This slide displays title i.e. 'Spot Market (Pitch Deck)' and your Company Name.
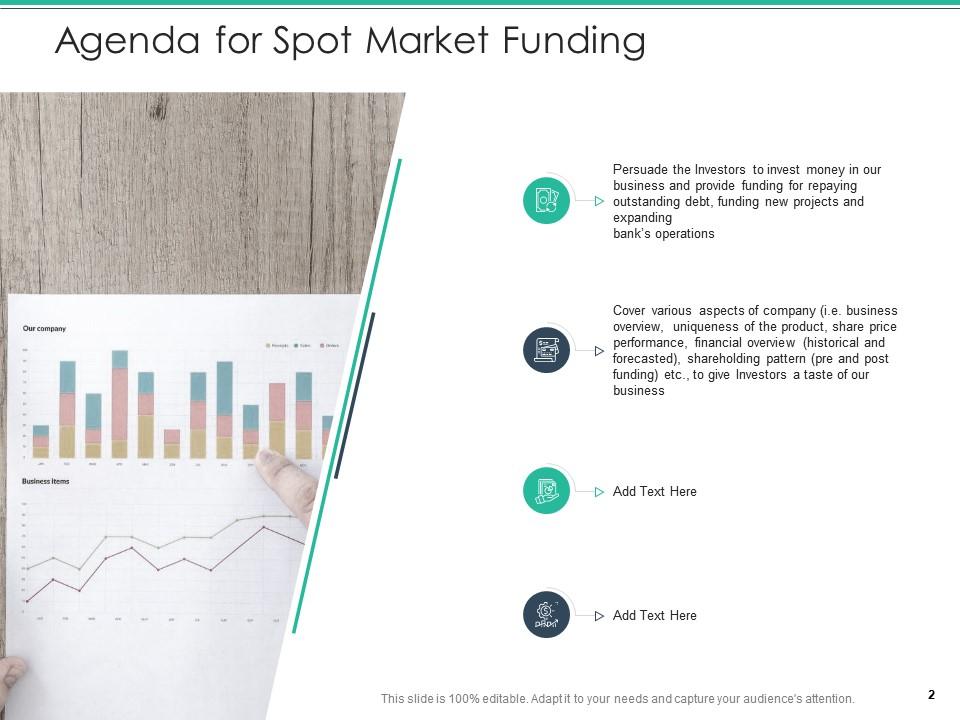
Slide 2: This slide presents agenda.
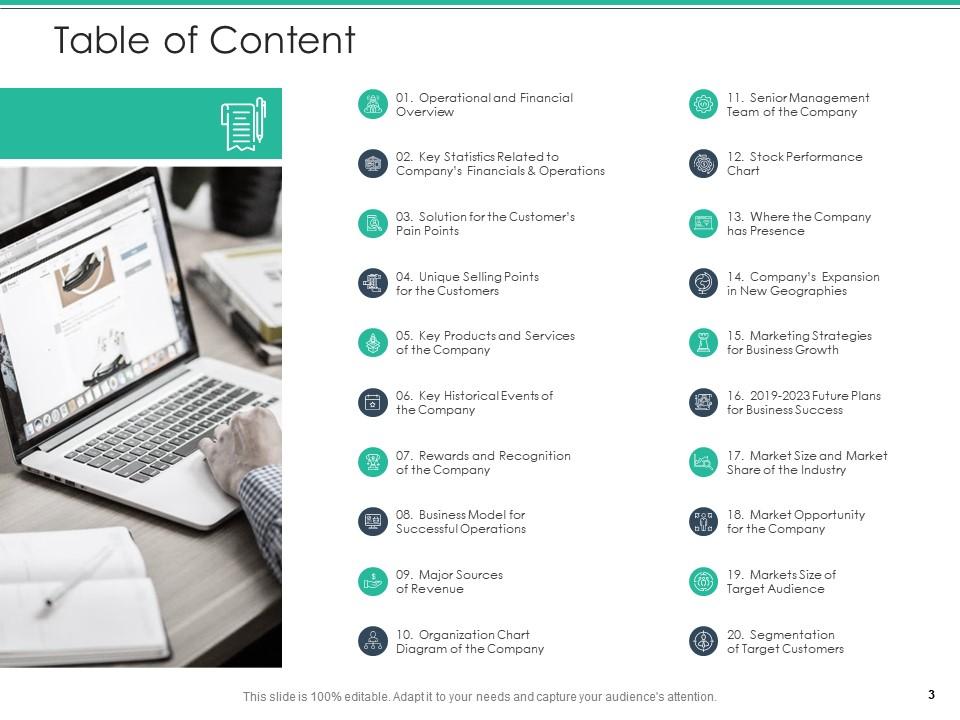
Slide 3: This slide exhibits table of contents.
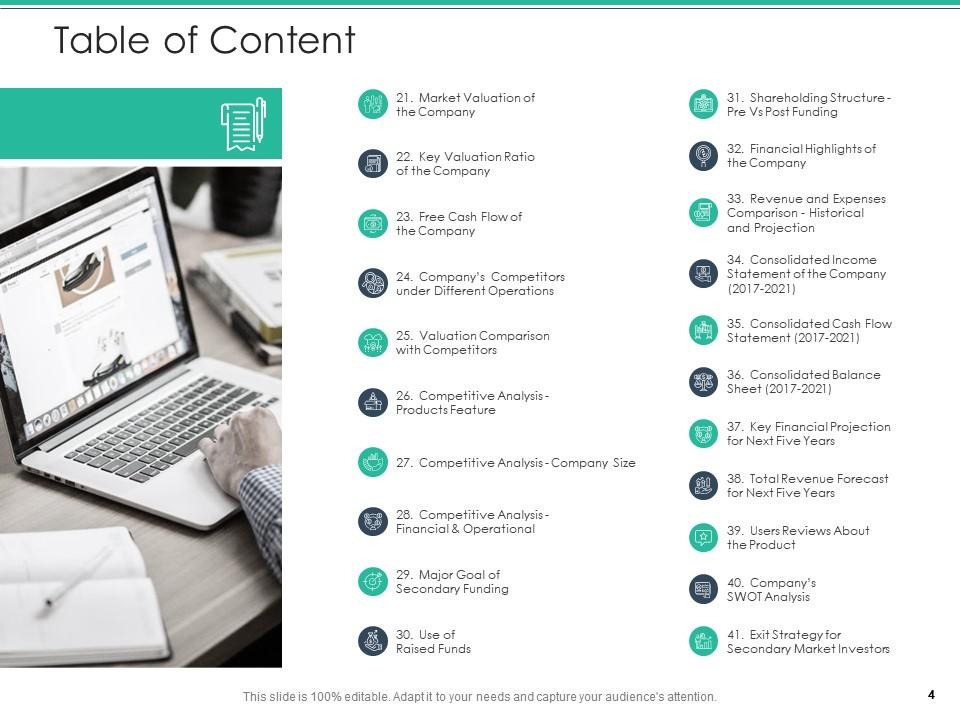
Slide 4: This slide also shows table of contents.
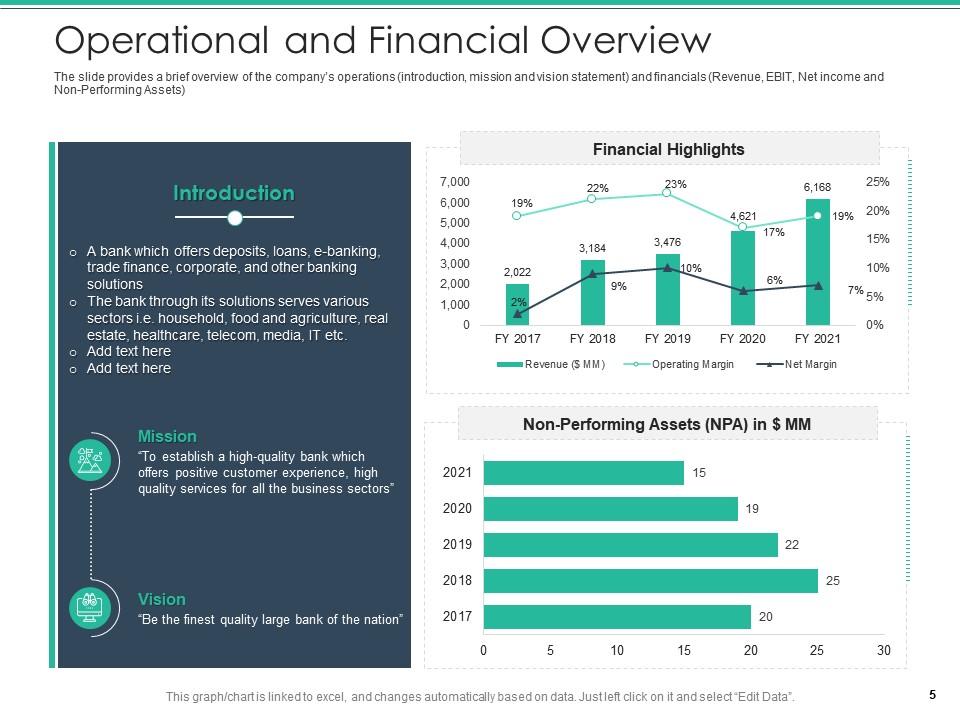
Slide 5: The slide provides a brief overview of the company’s operations (introduction, mission and vision statement) and financials.
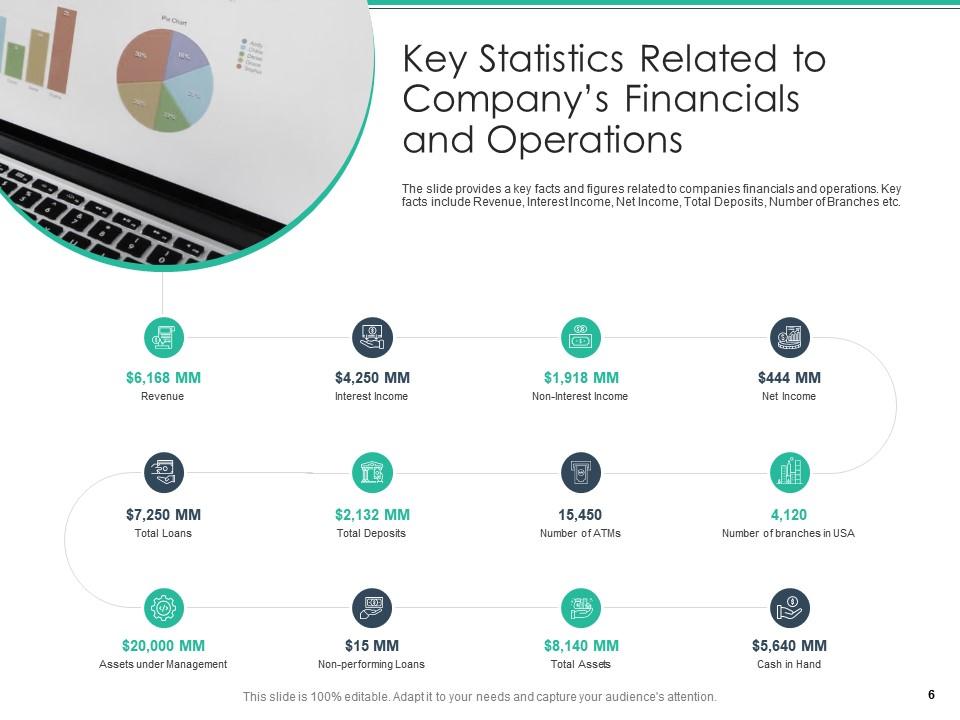
Slide 6: The slide provides a key facts and figures related to companies financials and operations.
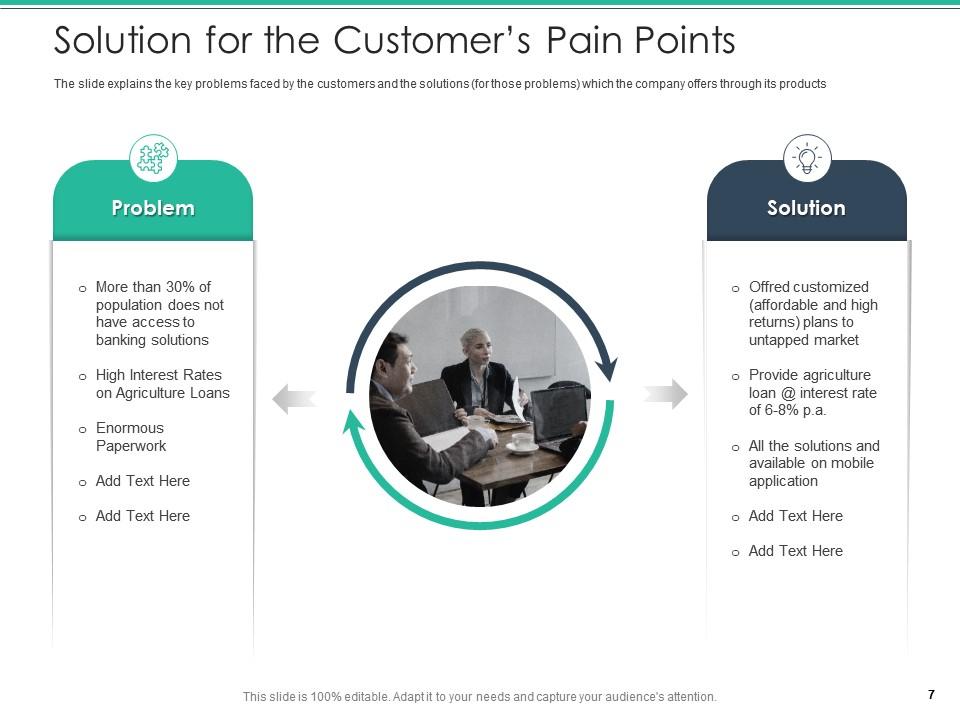
Slide 7: The slide explains the key problems faced by the customers and the solutions which the company offers through its products.
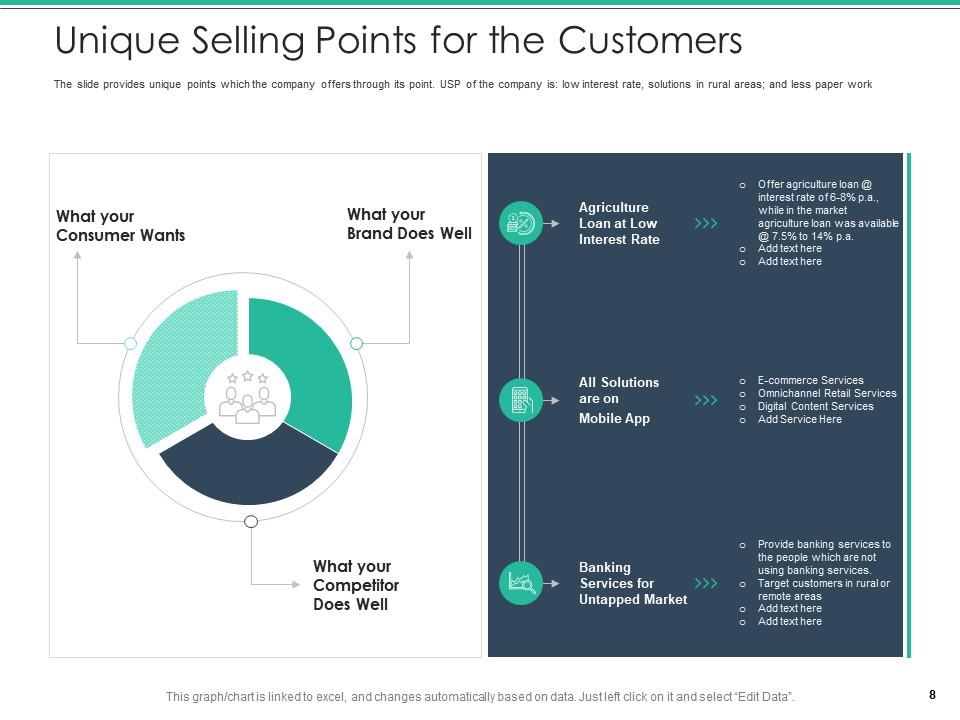
Slide 8: The slide provides unique points which the company offers through its point.
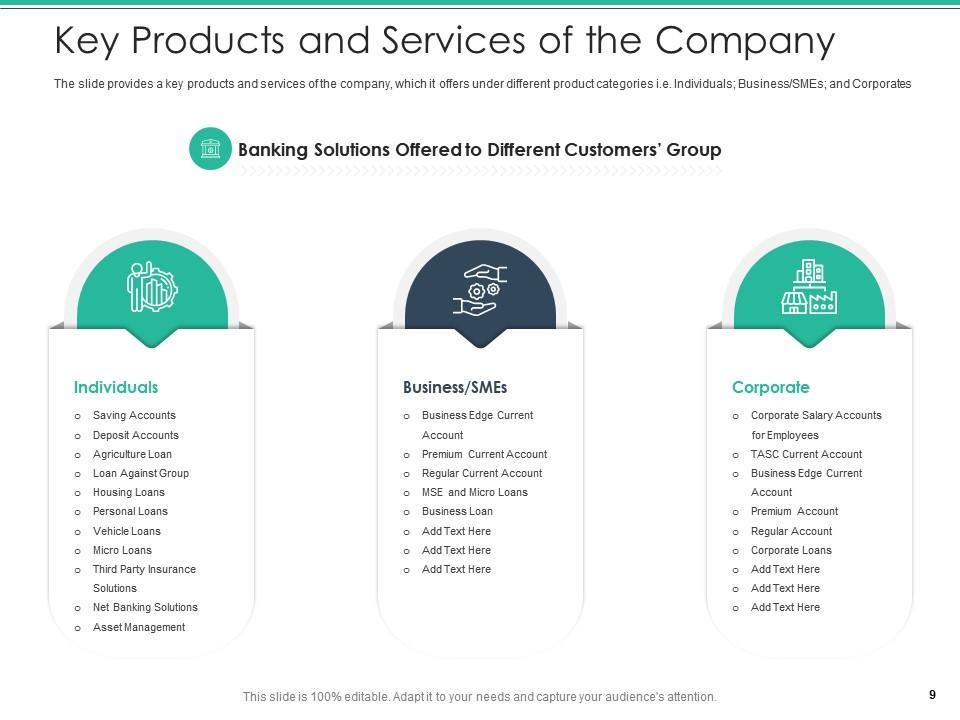
Slide 9: The slide provides a key products and services of the company, which it offers under different product categories.
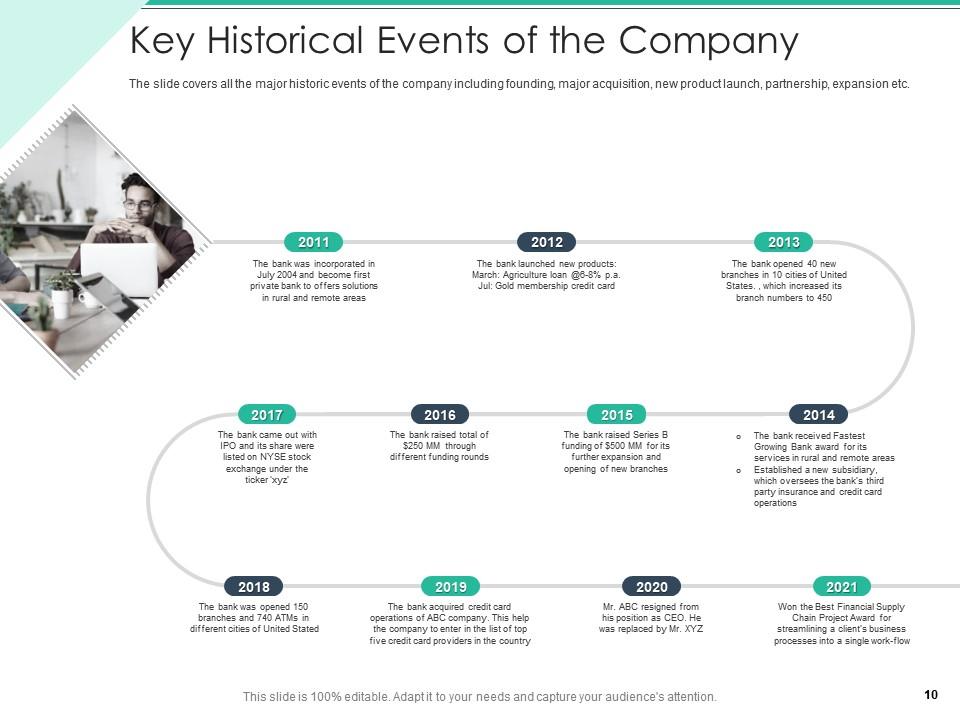
Slide 10: The slide covers all the major historic events of the company including founding, major acquisition, new product launch, etc.
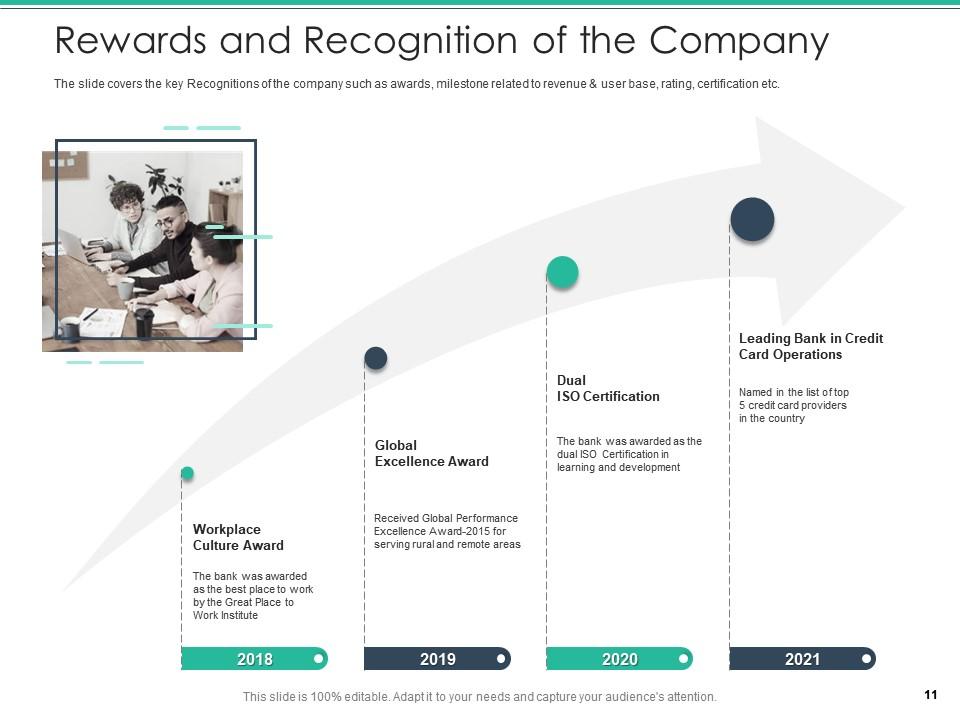
Slide 11: The slide covers the key Recognitions of the company such as awards, milestone related to revenue & user base, rating, certification etc.
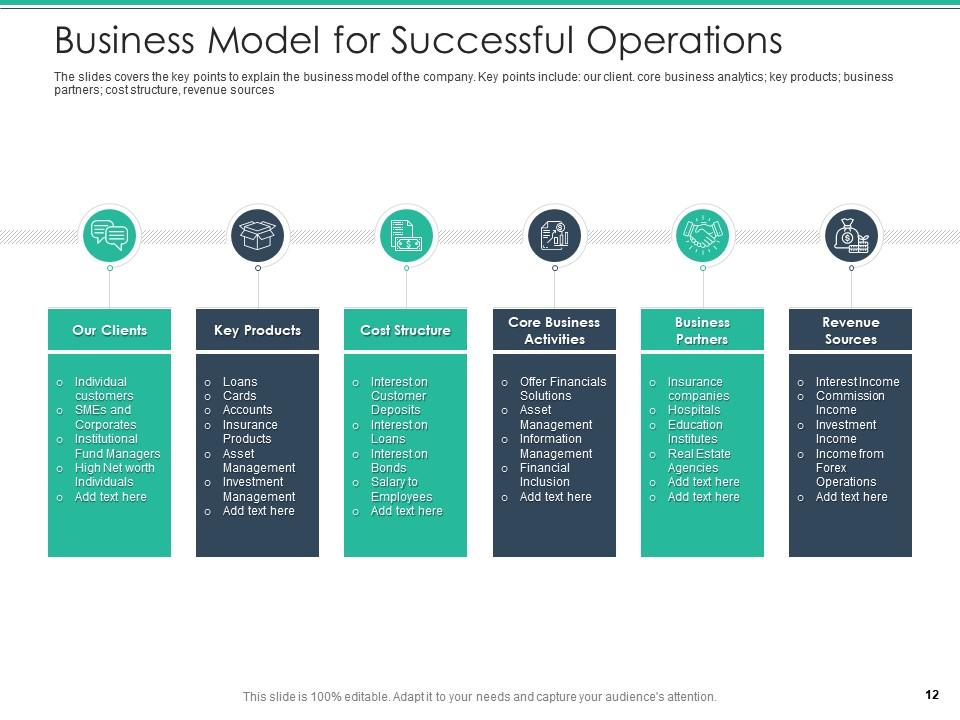
Slide 12: The slides covers the key points to explain the business model of the company.
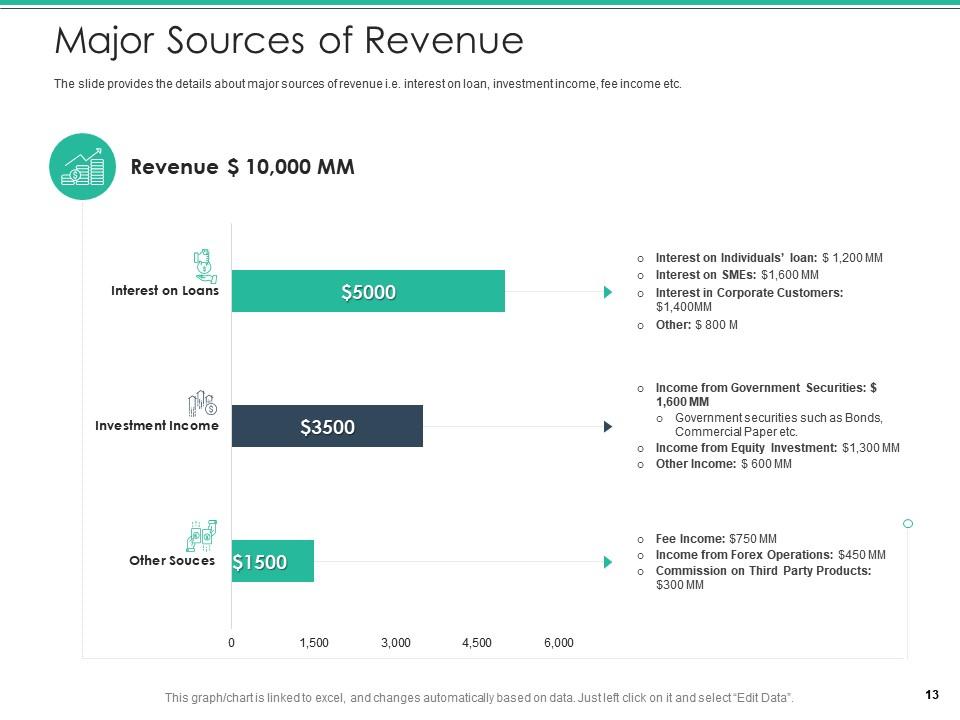
Slide 13: The slide provides the details about major sources of revenue i.e. interest on loan, investment income, fee income etc.
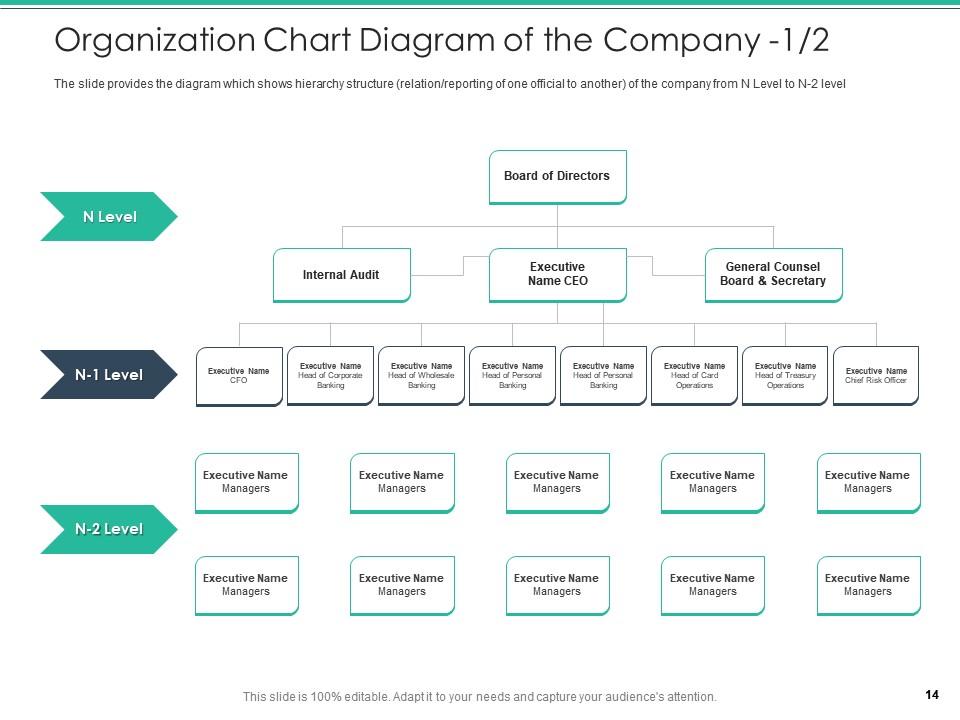
Slide 14: The slide provides the diagram which shows hierarchy structure of the company from N Level to N-2 level.
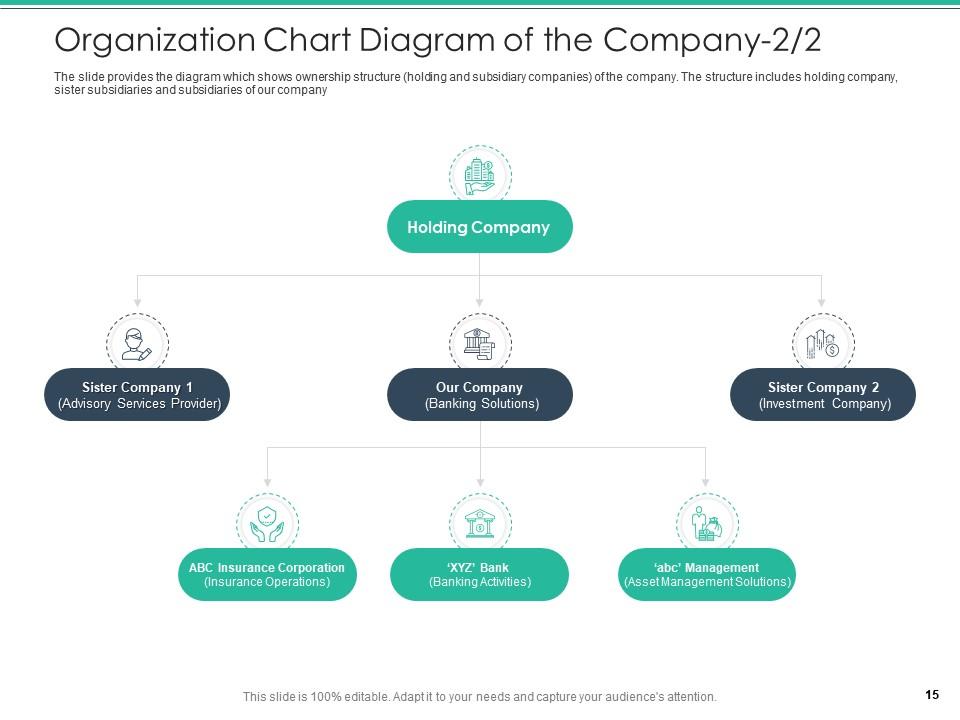
Slide 15: The slide provides the diagram which shows ownership structure (holding and subsidiary companies) of the company.
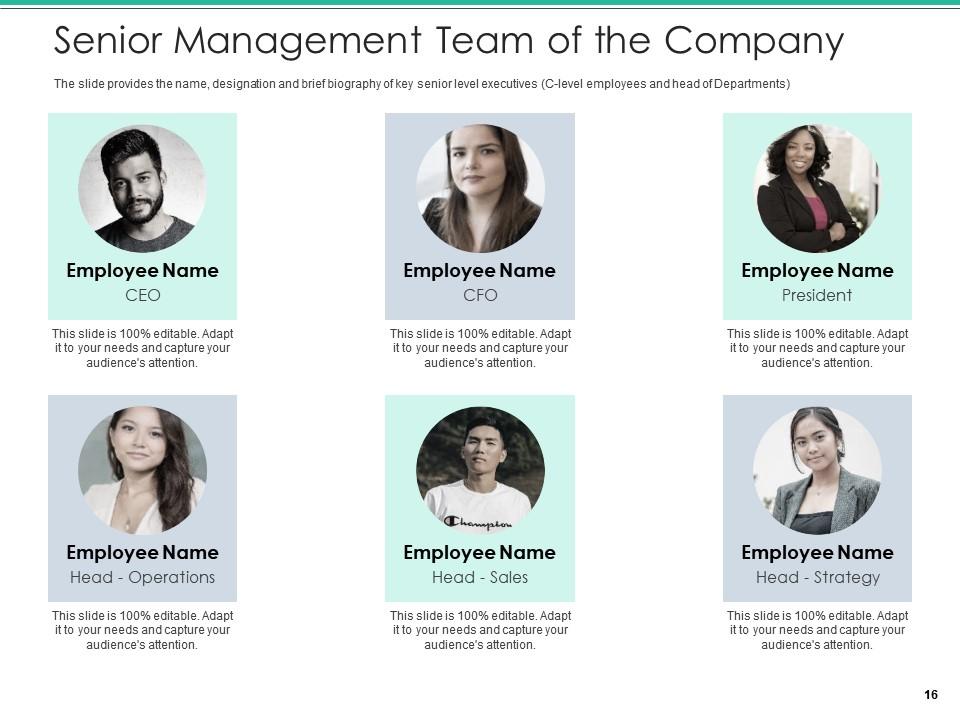
Slide 16: The slide provides the name, designation and brief biography of key senior level executives (C-level employees and head of Departments).
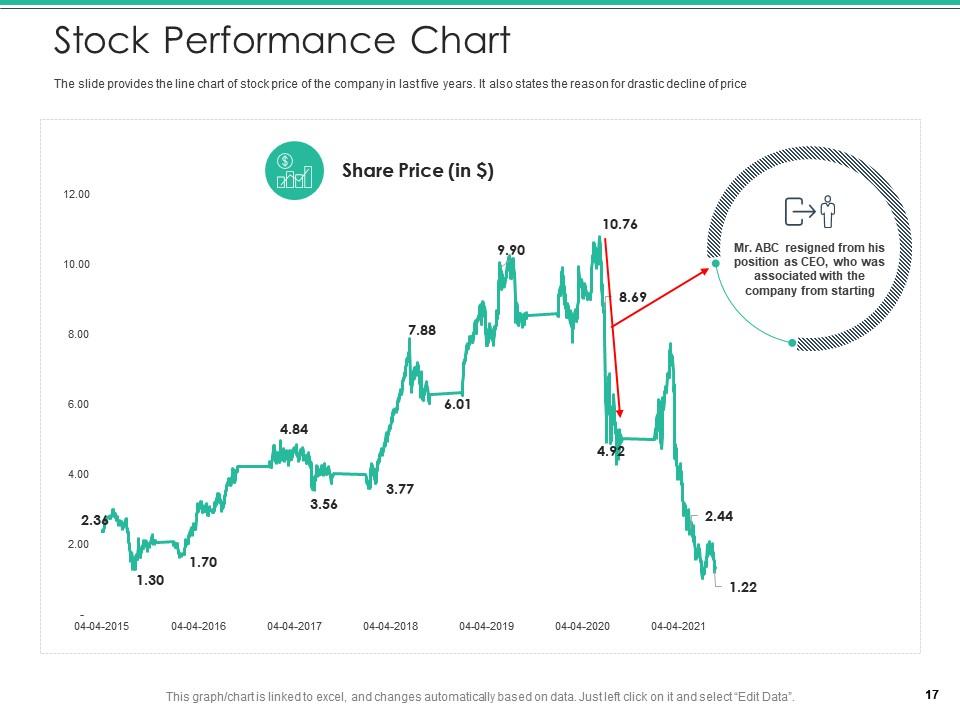
Slide 17: The slide provides the line chart of stock price of the company in last five years.
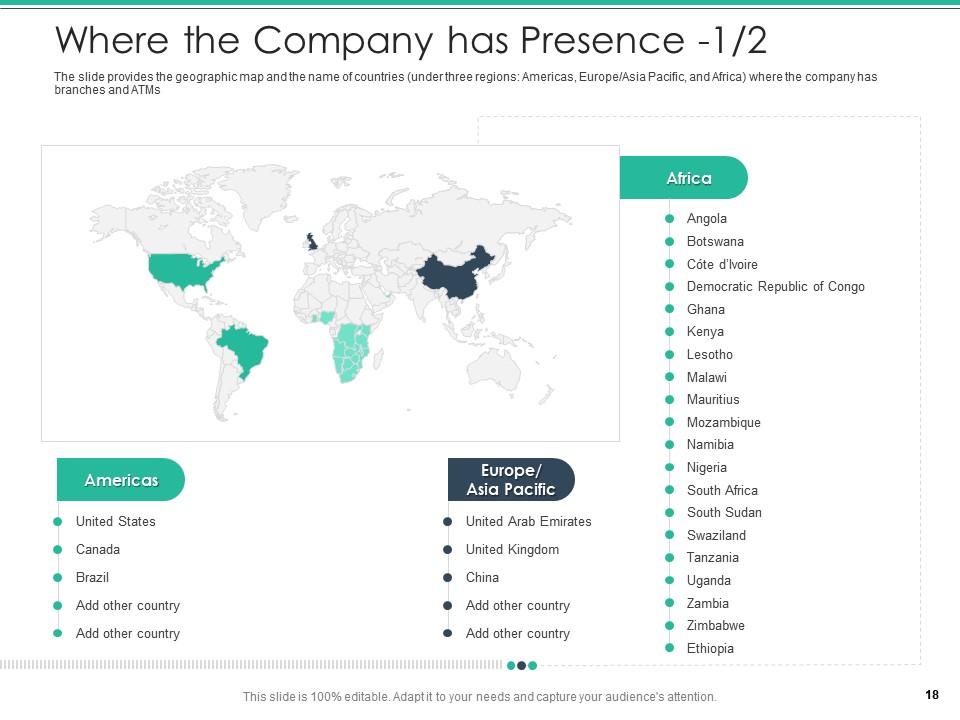
Slide 18: The slide provides the geographic map and the name of countries (under three regions: Americas, Europe/Asia Pacific, and Africa).
Slide 19: The slide provides the key facts related to geographic presence of the company.
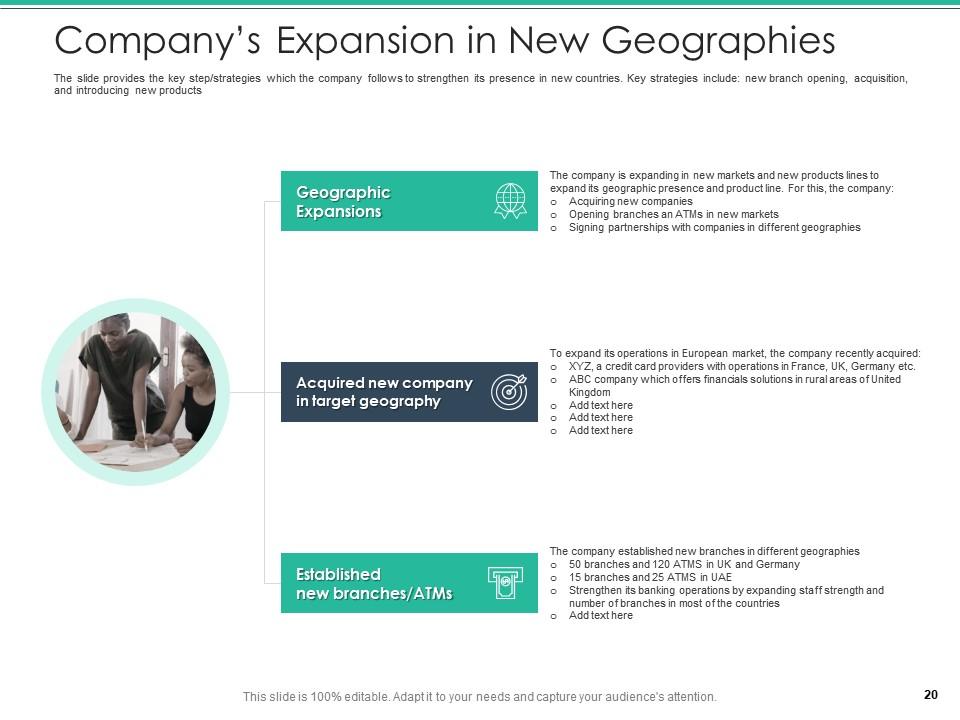
Slide 20: The slide provides the key step/strategies which the company follows to strengthen its presence in new countries.
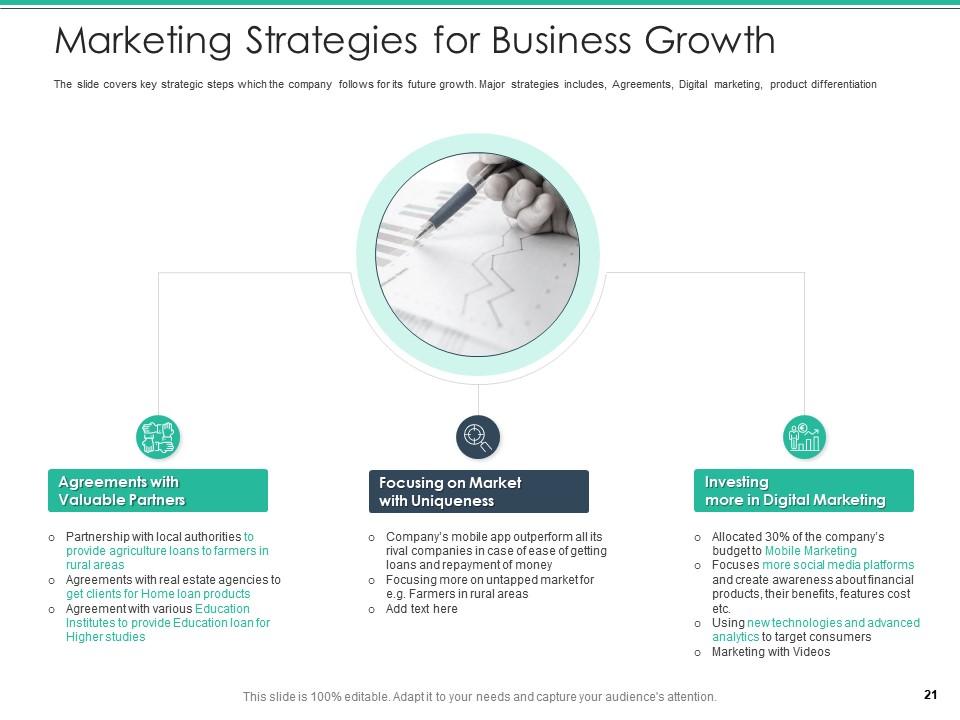
Slide 21: The slide covers key strategic steps which the company follows for its future growth.
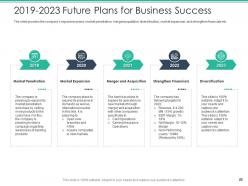
Slide 22: The slide provides the company’s expansion plans: market penetration, merger/acquisition, diversification, etc.
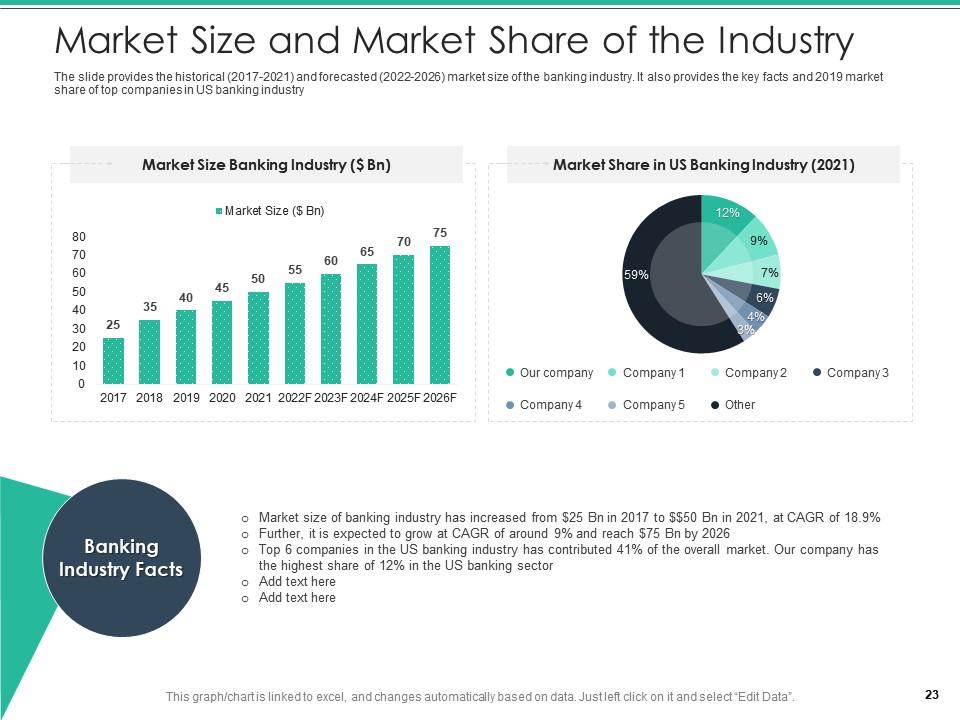
Slide 23: The slide provides the historical (2017-2021) and forecasted (2022-2026) market size of the banking industry.
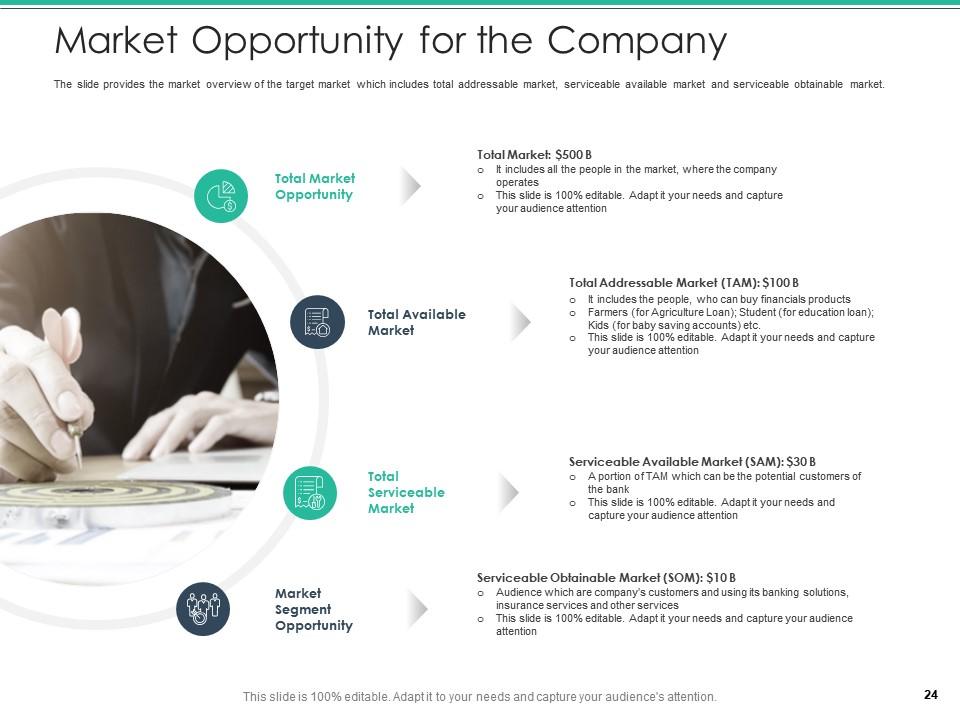
Slide 24: The slide provides the market overview of the target market which includes TAM, SAM & SOM.
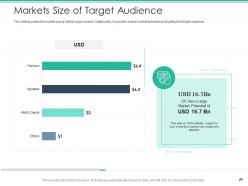
Slide 25: The slide provides the market size of all the target sectors.
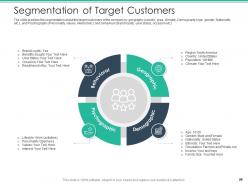
Slide 26: The slide provides the segmentation about the target customers of the company by geography (country, area, climate), Demography, etc.
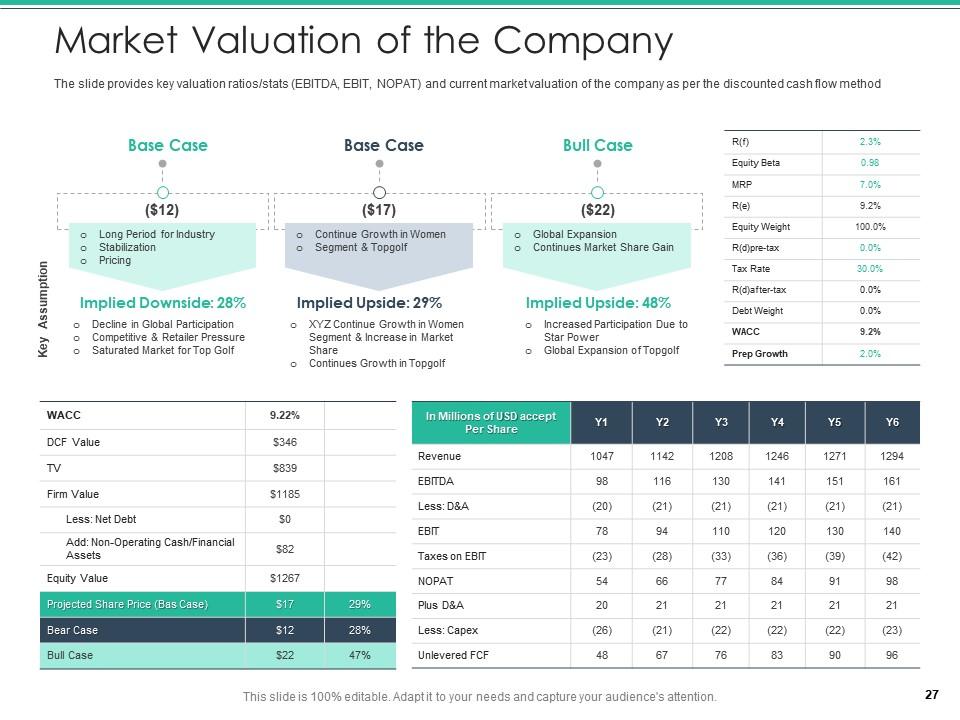
Slide 27: The slide provides key valuation ratios/stats (EBITDA, EBIT, NOPAT) and current market valuation of the company.
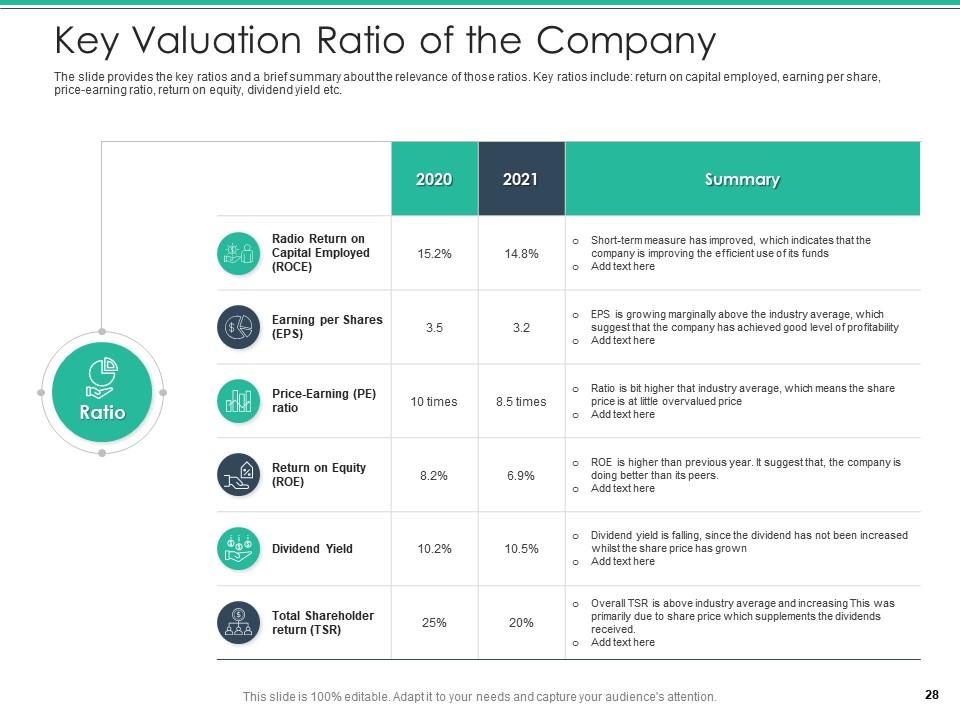
Slide 28: The slide provides the key ratios and a brief summary about the relevance of those ratios.
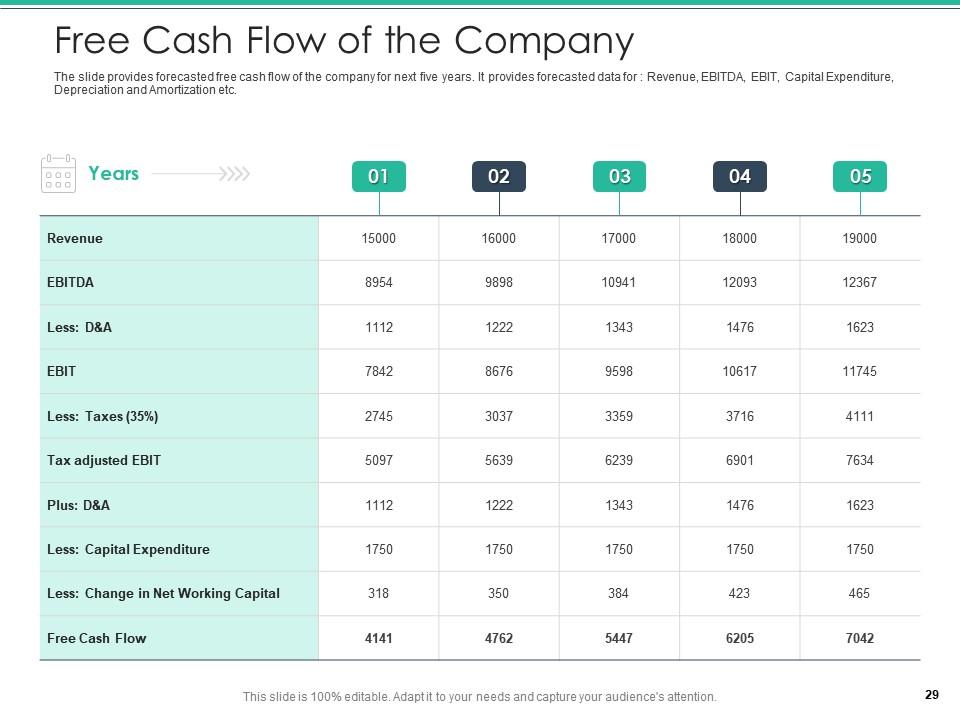
Slide 29: The slide provides forecasted free cash flow of the company for next five years.
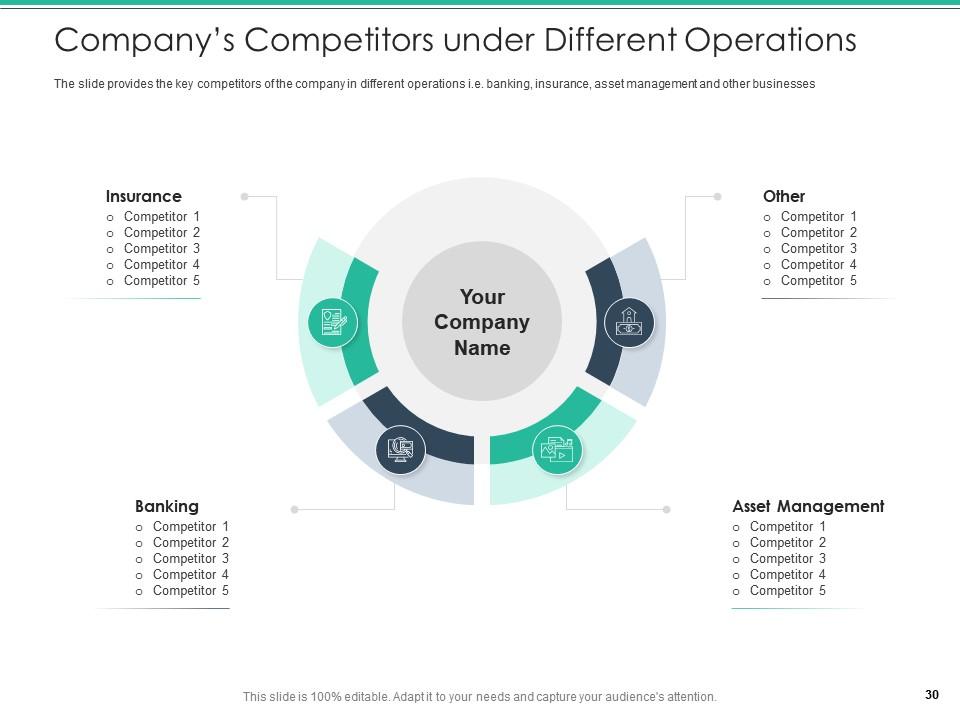
Slide 30: The slide provides the key competitors of the company in different operations i.e. banking, insurance, asset management, etc.
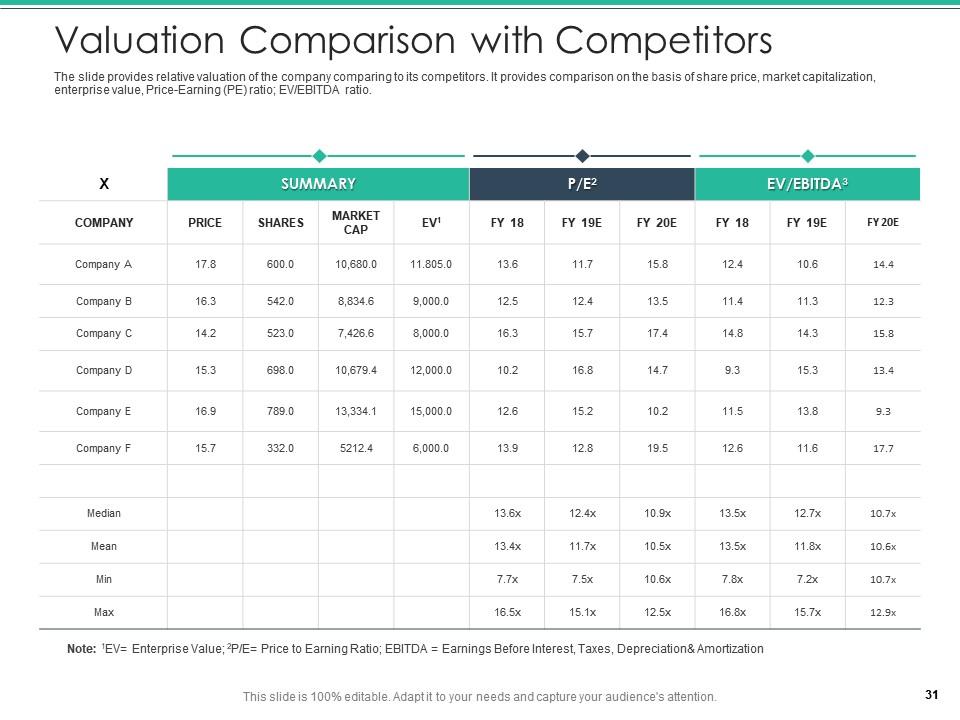
Slide 31: The slide provides relative valuation of the company comparing to its competitors.
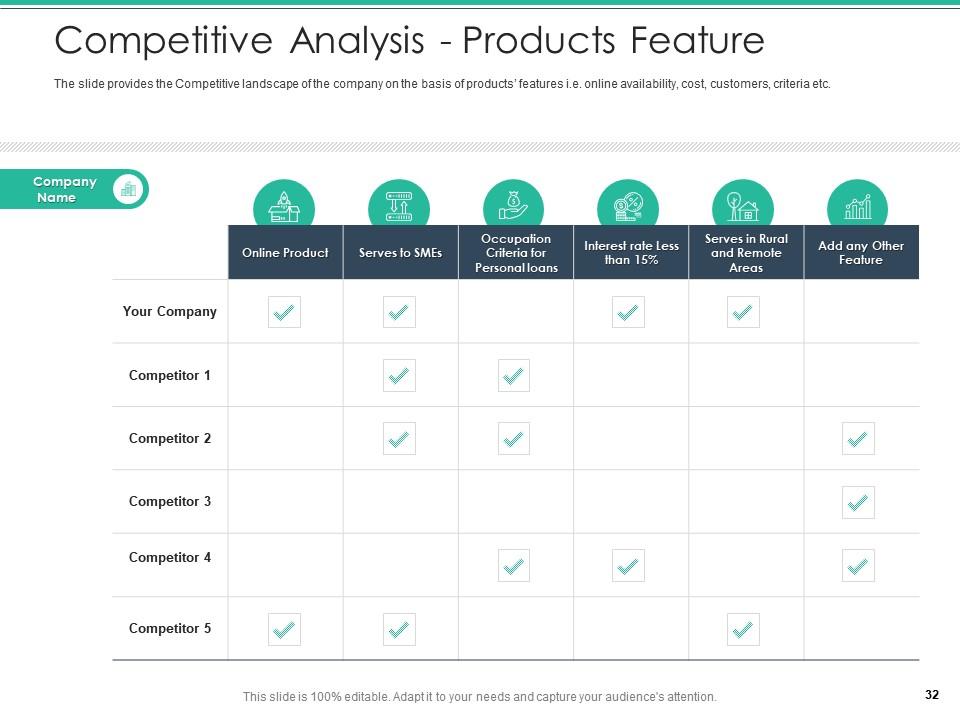
Slide 32: The slide provides the Competitive landscape of the company on the basis of products’ features i.e. online availability, cost, etc.
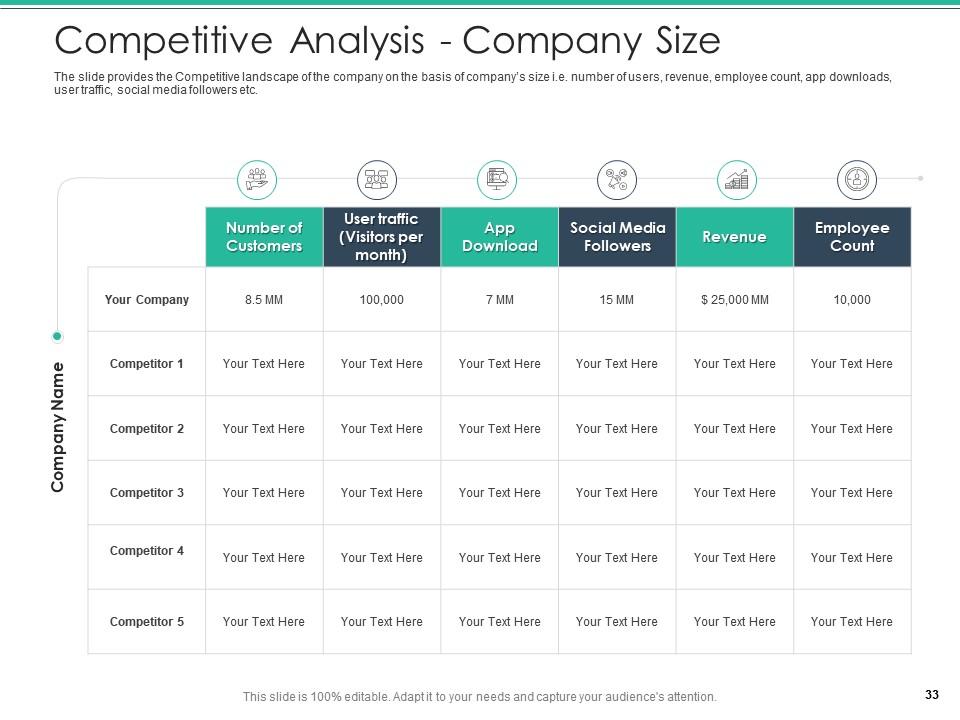
Slide 33: The slide provides the Competitive landscape of the company on the basis of company’s size i.e. number of users, revenue, etc.
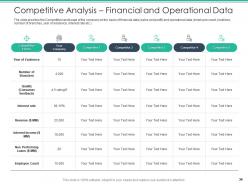
Slide 34: The slide provides the Competitive landscape of the company on the basis of financial data (sales and profit) and operational data.
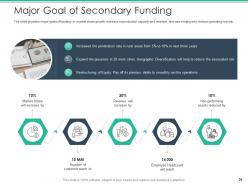
Slide 35: The slide provides major goals of funding i.e. market share growth, increase in production capacity and revenue, etc.
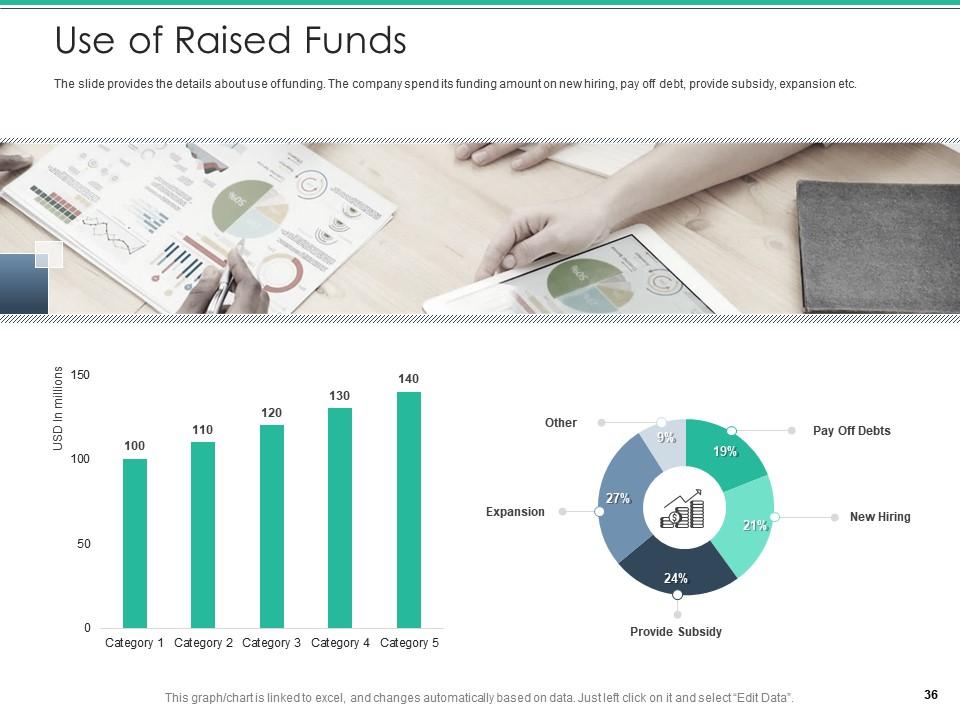
Slide 36: The slide provides the details about use of funding. The company spend its funding amount on new hiring, pay off debt, etc.
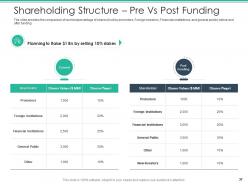
Slide 37: The slide provides the comparison of number/percentage of shares (hold by promotors, Foreign investors, Financials institutions, etc.
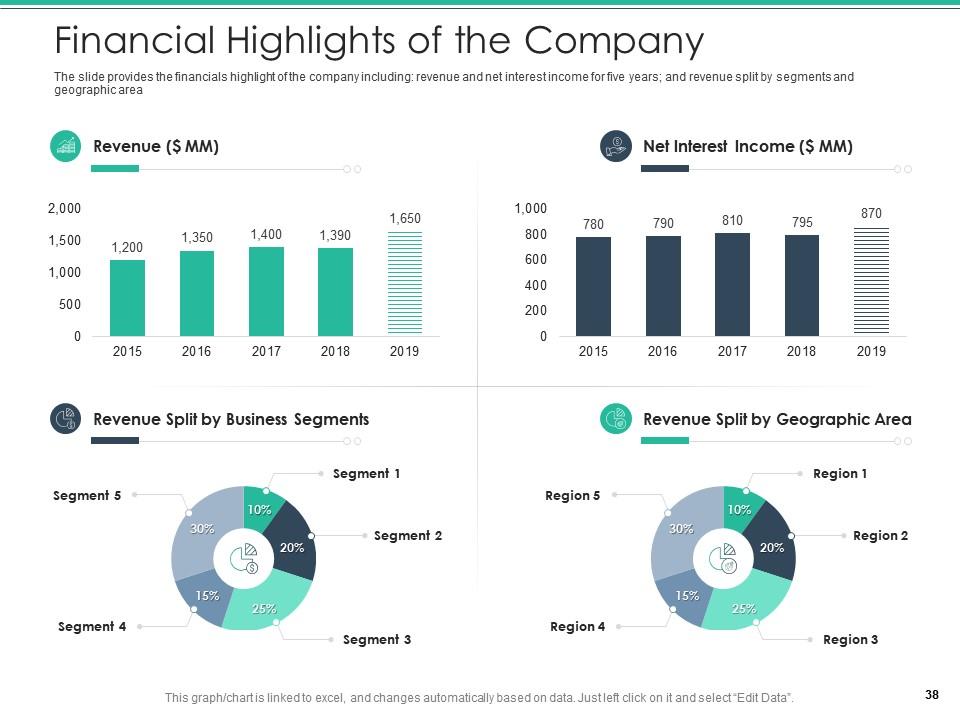
Slide 38: The slide provides the financials highlight of the company including: revenue and net interest income for five years.
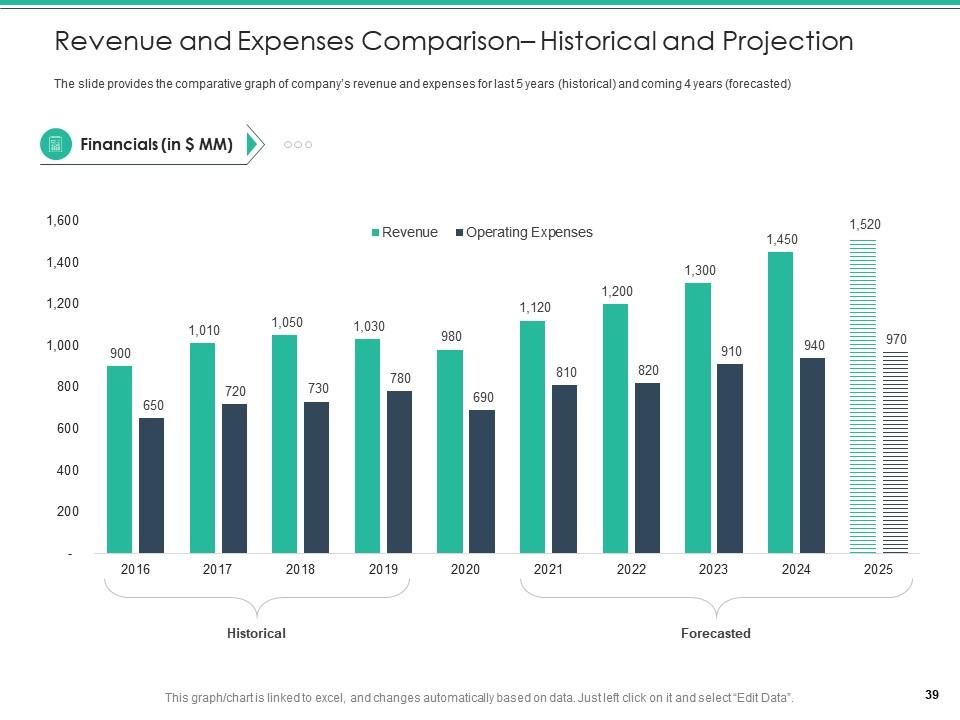
Slide 39: The slide provides the comparative graph of company’s revenue and expenses for last 5 years (historical) and coming 4 years (forecasted).
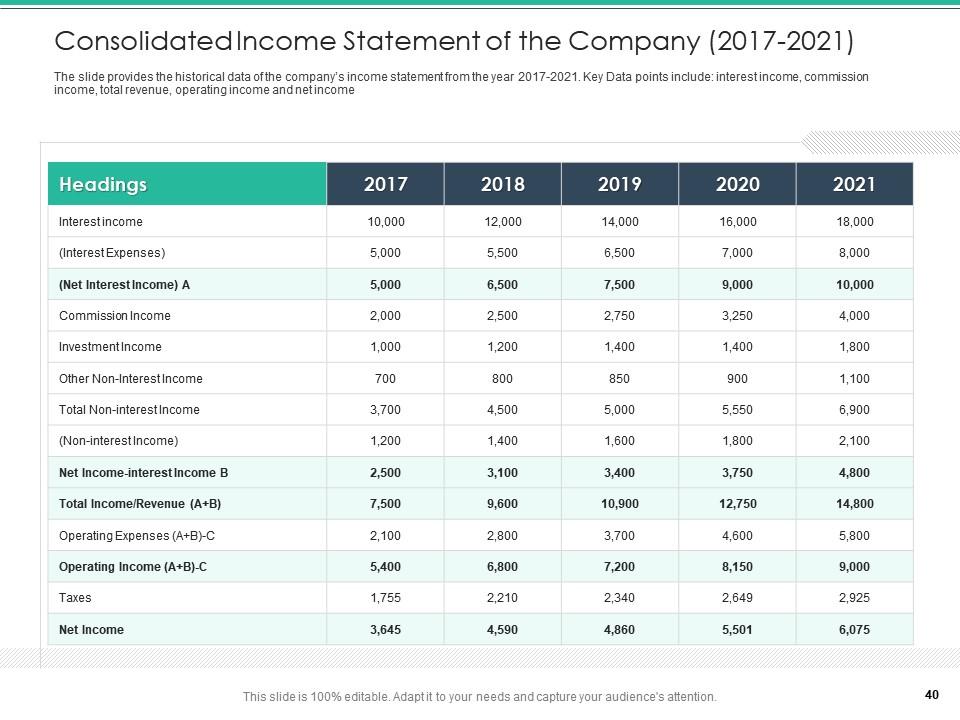
Slide 40: The slide provides the historical data of the company’s income statement from the year 2017-2021.
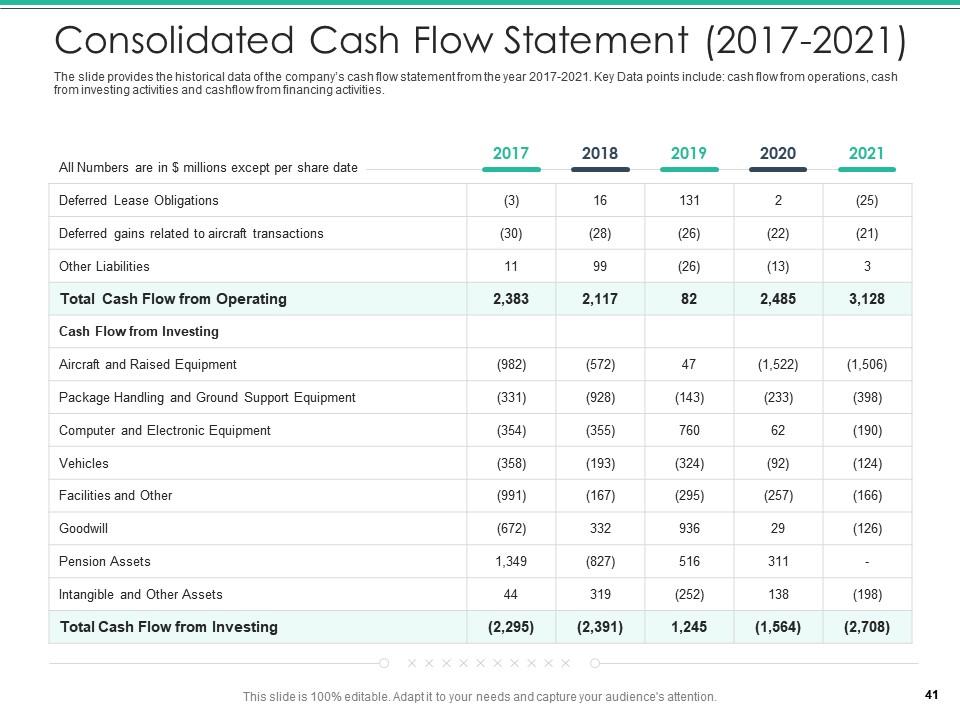
Slide 41: The slide provides the historical data of the company’s cash flow statement from the year 2017-2021.
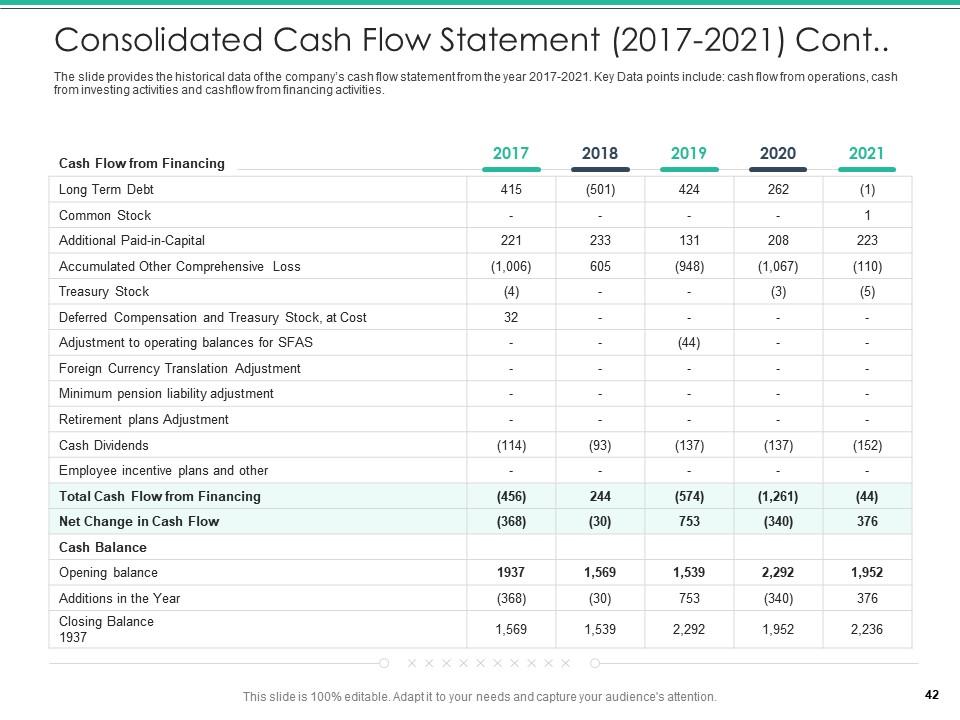
Slide 42: The slide provides the historical data of the company’s cash flow statement from the year 2017-2021.
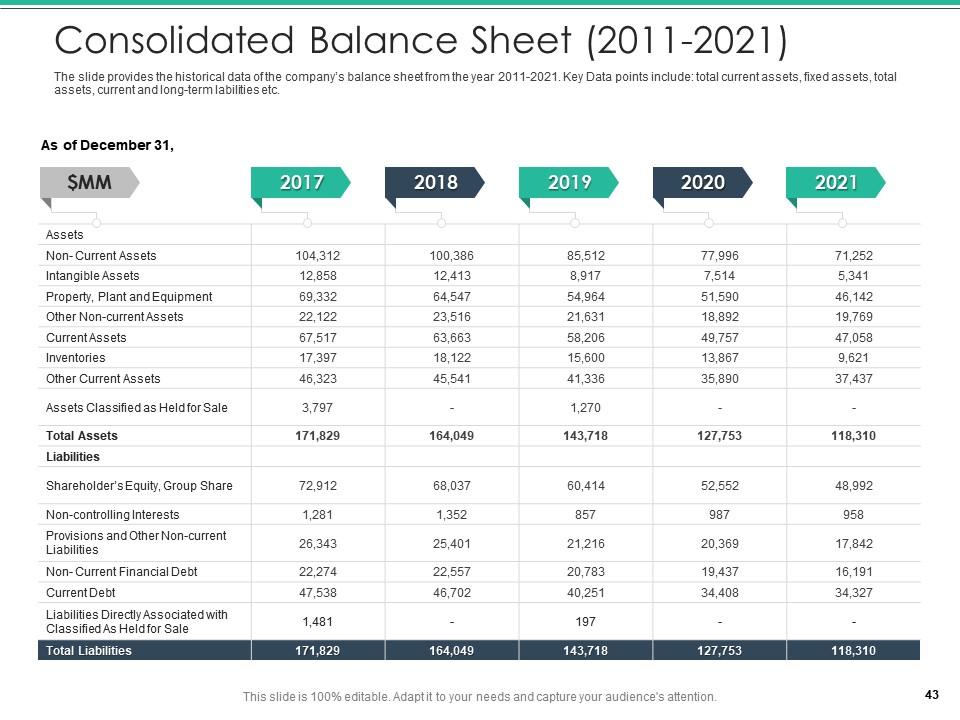
Slide 43: The slide provides the historical data of the company’s balance sheet from the year 2011-2021.
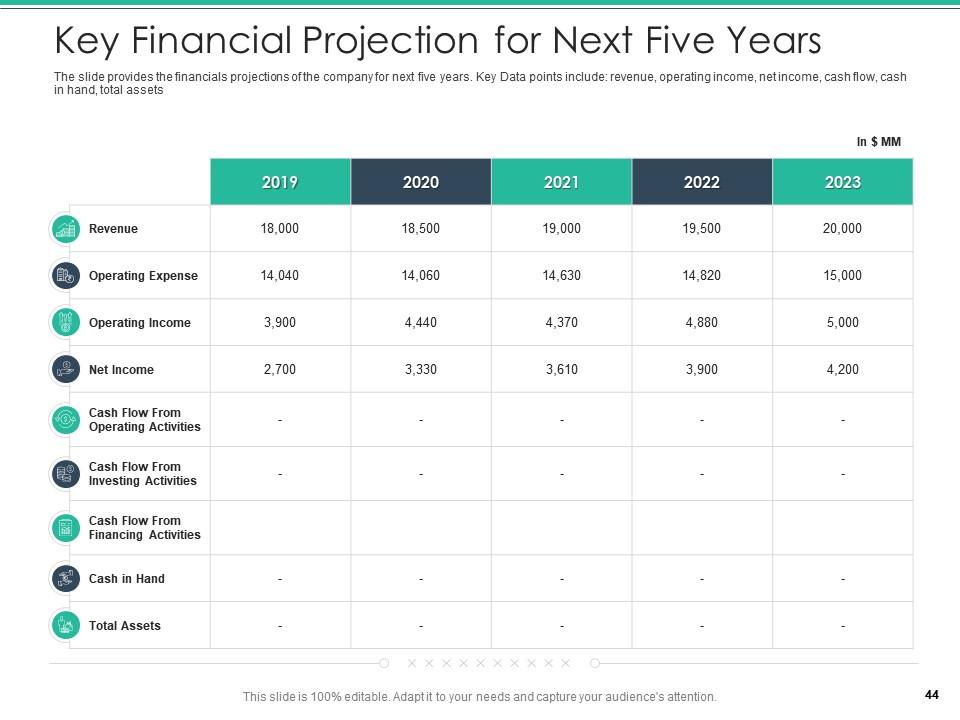
Slide 44: The slide provides the financials projections of the company for next five years.
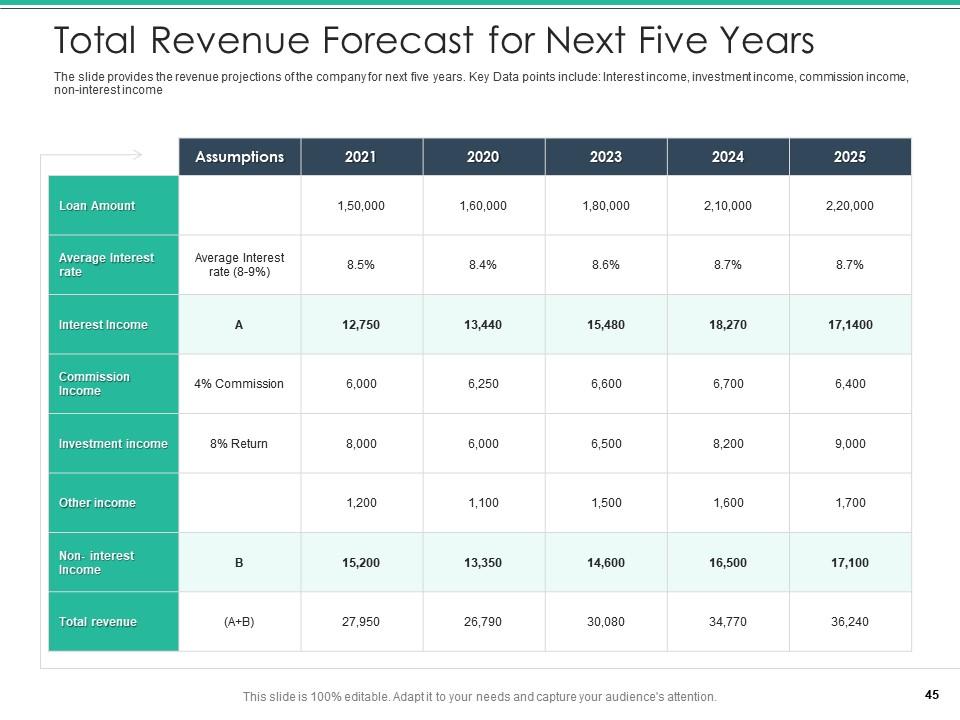
Slide 45: The slide provides the revenue projections of the company for next five years.
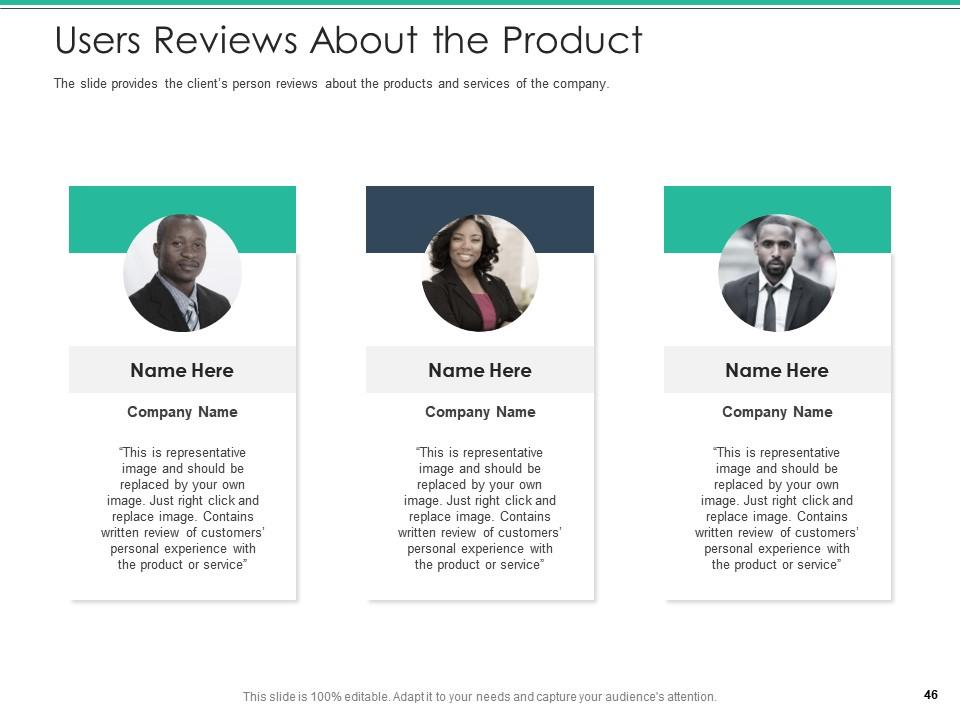
Slide 46: The slide provides the client’s person reviews about the products and services of the company.
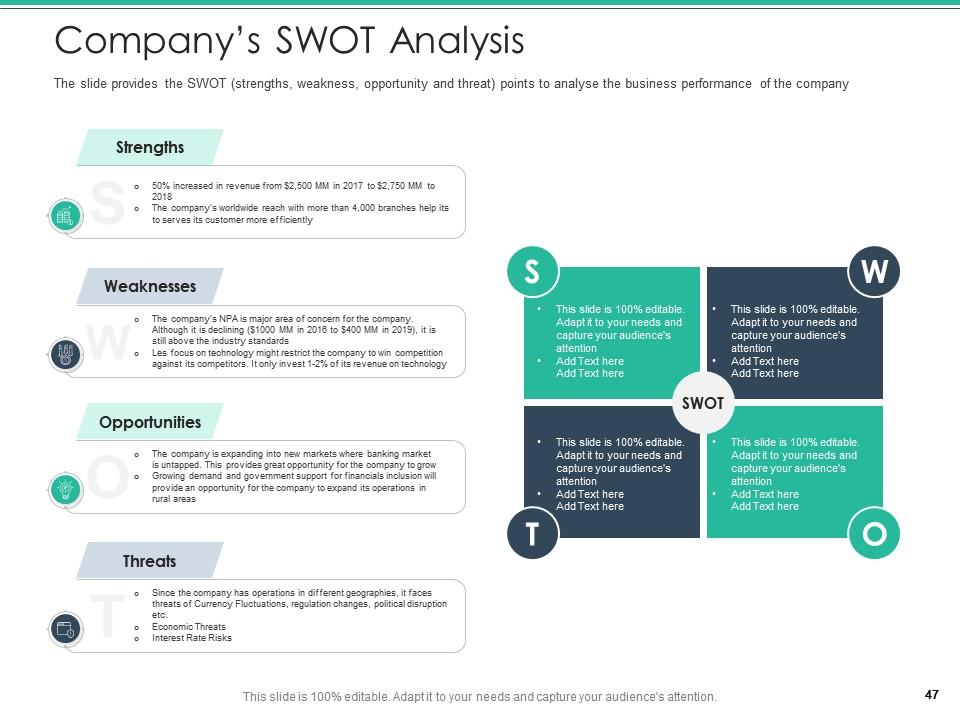
Slide 47: The slide provides the SWOT (strengths, weakness, opportunity and threat) points to analyse the business performance of the company.
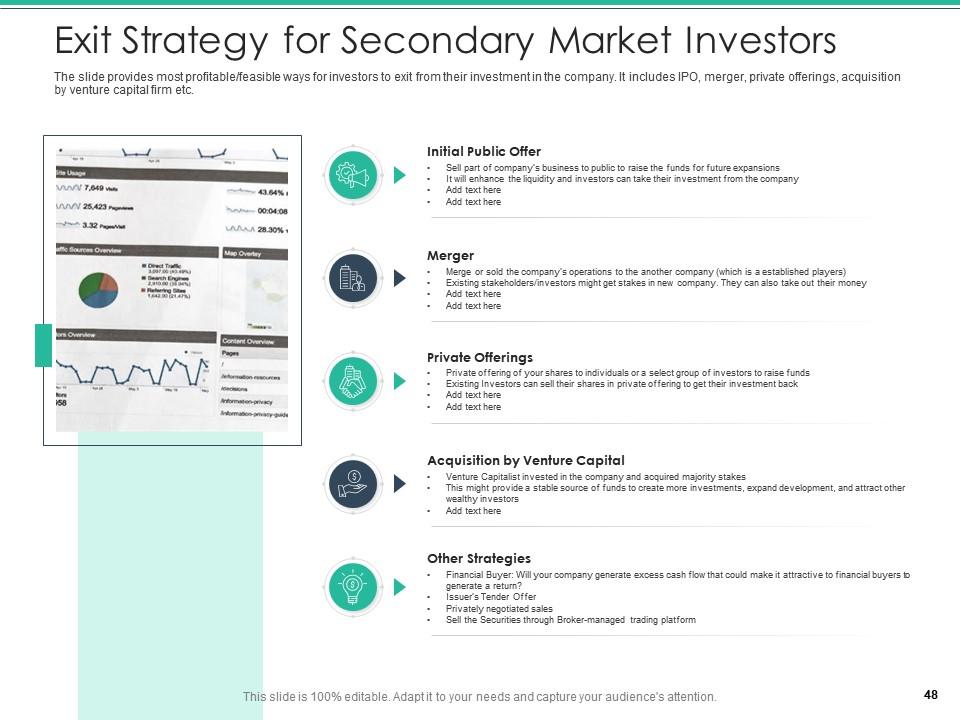
Slide 48: The slide provides most profitable/feasible ways for investors to exit from their investment in the company.
Slide 49: This is the icons slide.
Slide 50: This slide presents title for additional slides.
Slide 51: This slide shows about your company, target audience and its client's values.
Slide 52: This slide depicts 30-60-90 days plan for projects.
Slide 53: This slide depicts posts for past experiences of clients.
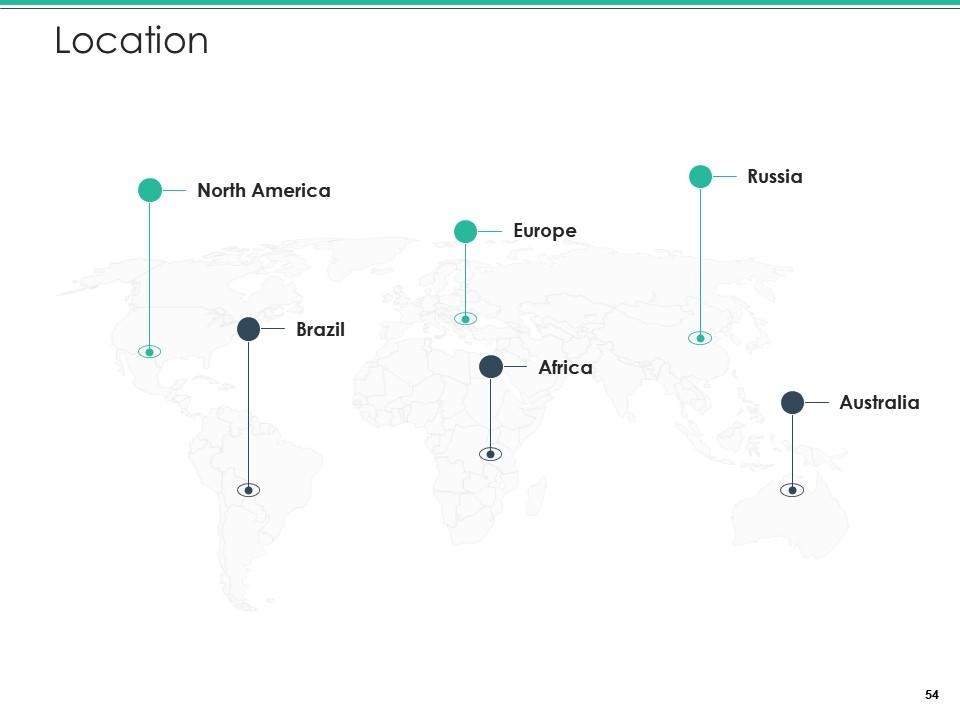
Slide 54: This slide displays location of the company in the world map.
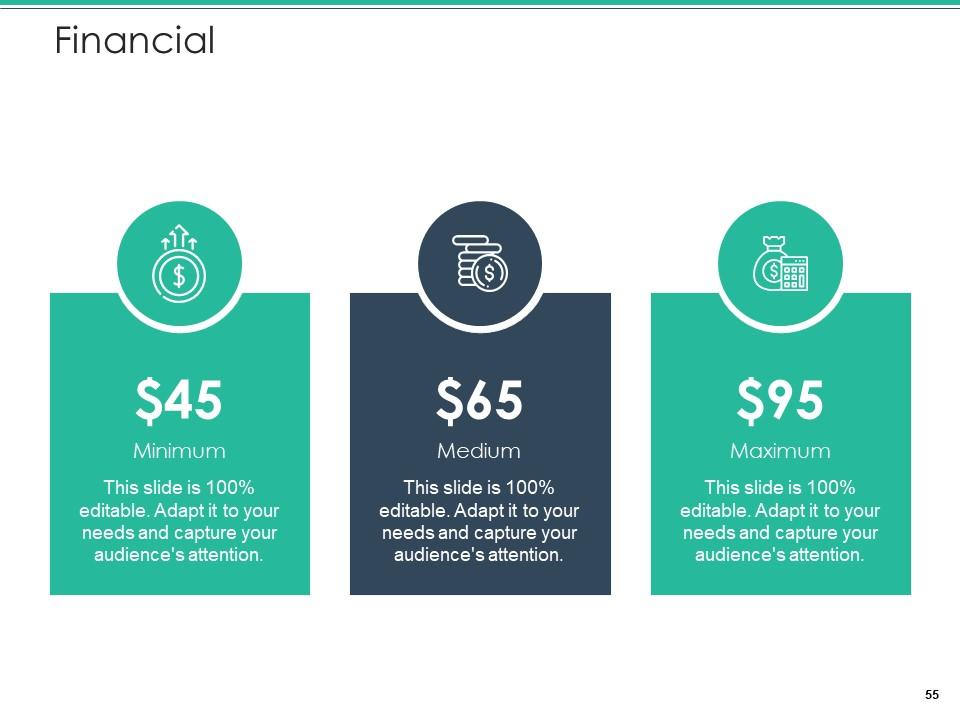
Slide 55: This slide showcases financials.
Slide 56: This slide shows roadmap.
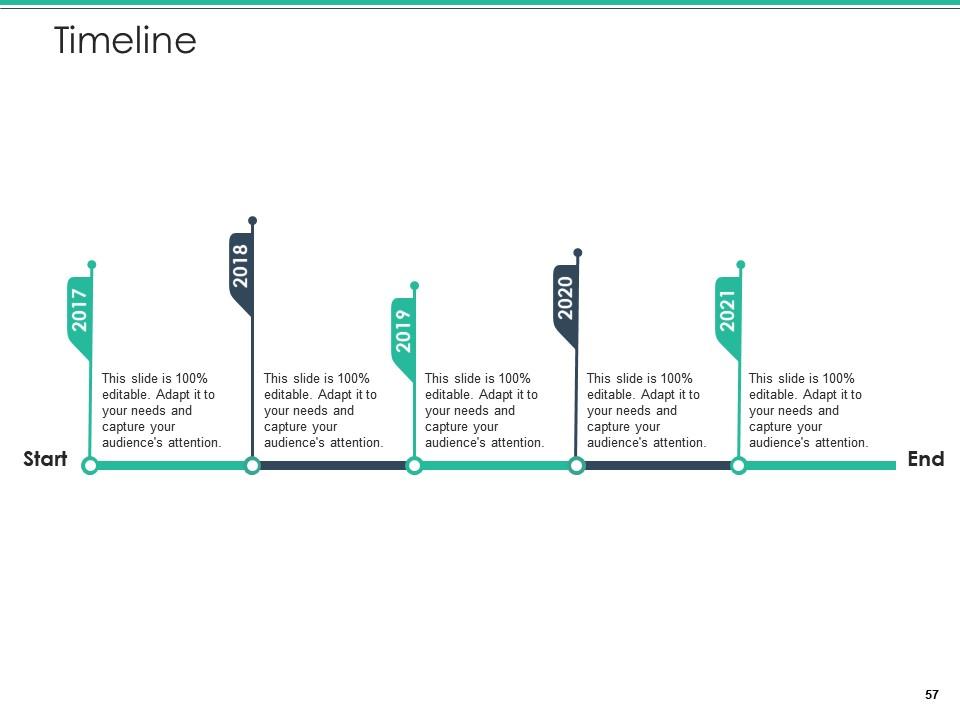
Slide 57: This slide exhibits yearly timeline.
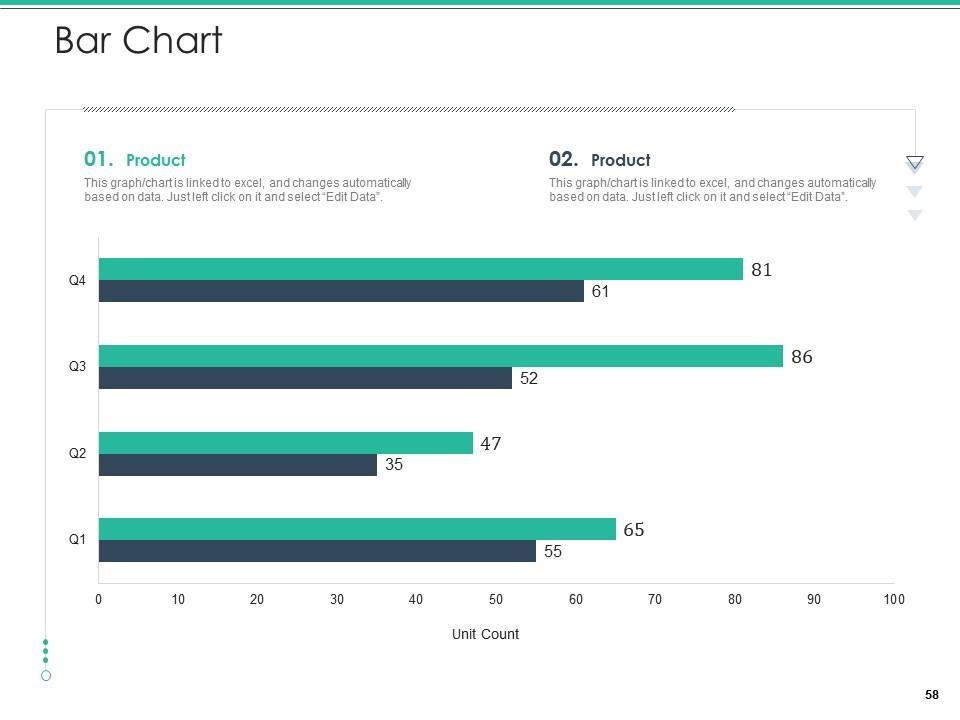
Slide 58: This slide exhibits quarterly bar charts for different products. The charts are linked to Excel.
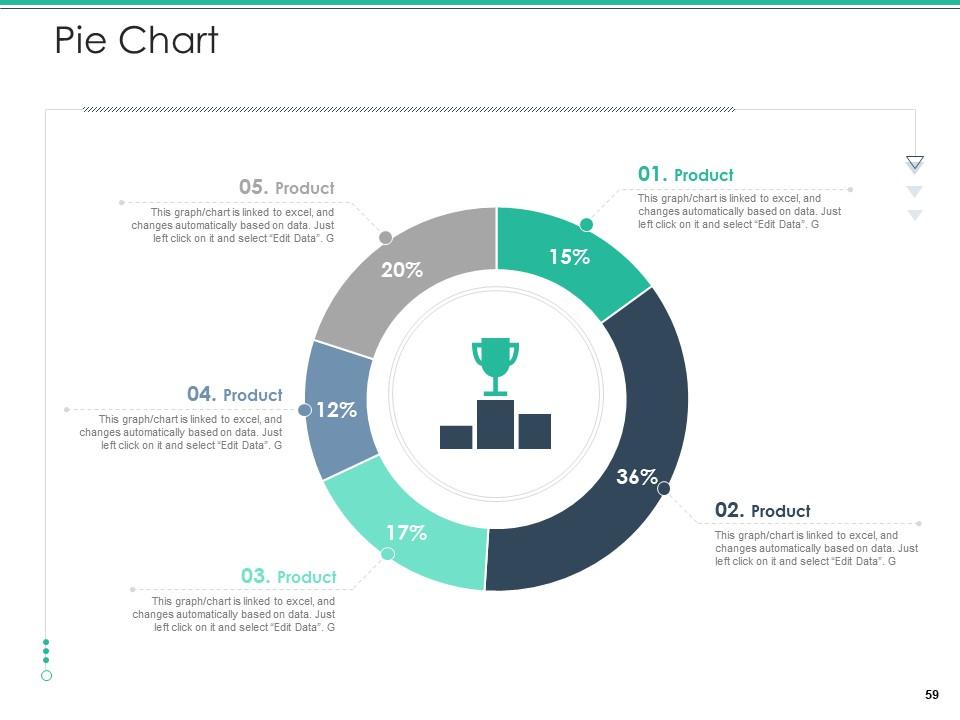
Slide 59: This slide displays pie charts for different products. The charts are linked to Excel.
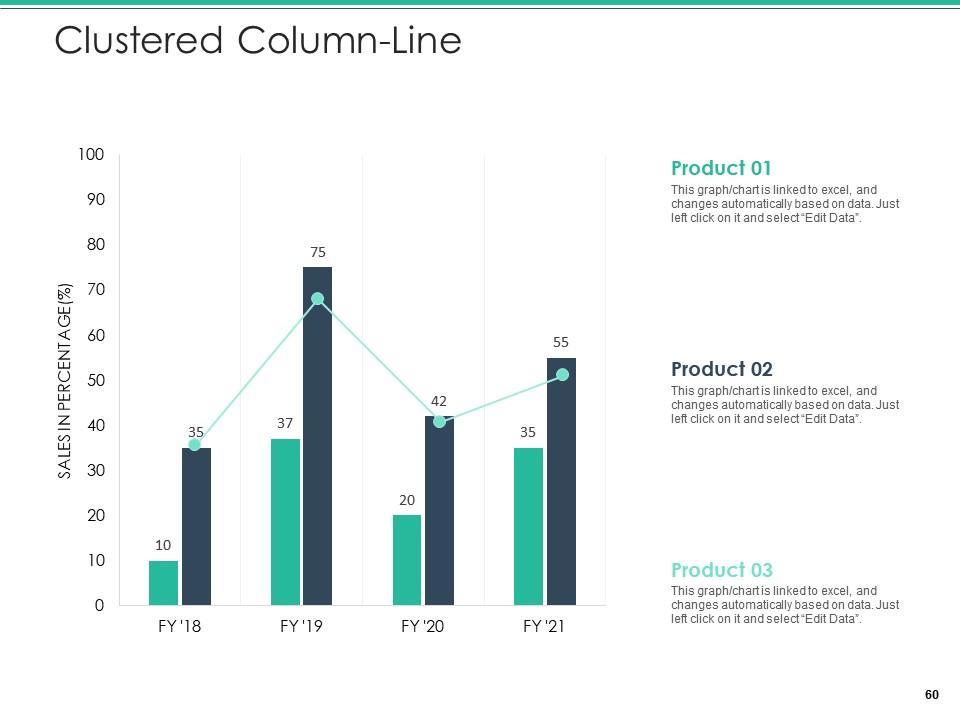
Slide 60: This slide exhibits yearly sales clustered column & line charts for different products. The charts are linked to Excel.
Slide 61: This is thank you slide & contains contact details of company like office address, phone no., etc.
Spot market pitch deck powerpoint presentation slides with all 61 slides:
Use our Spot Market Pitch Deck Powerpoint Presentation Slides to effectively help you save your valuable time. They are readymade to fit into any presentation structure.
No Reviews


