Collection of Cockpit Chart Dashboard Powerpoint Templates
-
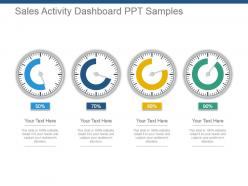 66989338 style essentials 2 dashboard 4 piece powerpoint presentation diagram infographic slide
Presenting sales activity dashboard snapshot ppt samples. This is a sales activity dashboard ppt samples. This is a four stage process. The stages in this process are sales, activity, dashboard, financial, strategy.
-
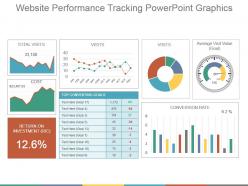 35189787 style essentials 2 dashboard 3 piece powerpoint presentation diagram infographic slide
Presenting website performance tracking powerpoint graphics. This is a website performance tracking powerpoint graphics. This is a three stage process. The stages in this process are total visits, conversion rate, return on investment, average visit value.
-
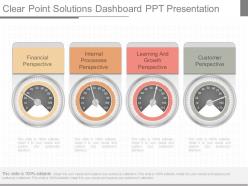 95999695 style essentials 2 dashboard 3 piece powerpoint presentation diagram infographic slide
Adjust the substance at your own solace and need. Customize it with your organization name and logo. Download and spare the introduction in wanted organization. Perfect with wide assortment of on the web and disconnected programming choices. Plenty of professionally made slides. Completely editable PowerPoint introduction. Material by human asset branch of a few associations alongside business people and administrative understudies.The stages in this process are financial perspective, internal processes perspective, learning and growth perspective, customer perspective.
-
 74918633 style essentials 2 dashboard 3 piece powerpoint presentation diagram infographic slide
Easy proofing and editing is added on feature of presentation visual. Presentation slide is useful in business marketing, management and recourse disbursement. Basic theme yet it can modified with respect to font, color and layout. Attractive color scheme gives a professional look to PPT layout.
-
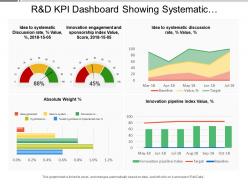 33223190 style essentials 2 financials 4 piece powerpoint presentation diagram infographic slide
Presenting this set of slides with name - R And D Kpi Dashboard Showing Systematic Discussion Rate Innovation Engagement And Sponsorship Index. This is a four stage process. The stages in this process are R And D, Research And Development, Research And Technological Development.
-
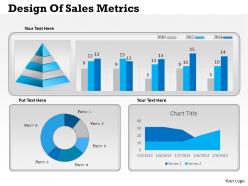 13389289 style essentials 2 dashboard 1 piece powerpoint presentation diagram infographic slide
We are proud to present our 0414 business consulting diagram design of sales metrics powerpoint slide template. Our 0414 Business consulting diagram Design Of Sales Metrics PowerPoint slide template Powerpoint Templates are the chords of your song. String them along and provide the lilt to your views. Our Finance Powerpoint Templates help you pinpoint your timelines. Highlight the reasons for your deadlines with their use.
-
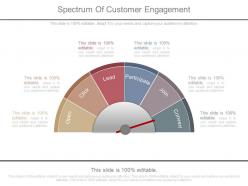 32563845 style circular semi 6 piece powerpoint presentation diagram infographic slide
Presenting spectrum of customer engagement ppt presentation. This is a spectrum of customer engagement ppt presentation. This is a six stage process. The stages in this process are open, click, lead, participate, join, convert.
-
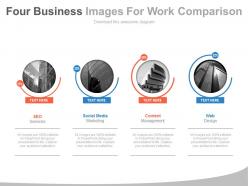 58164589 style essentials 2 dashboard 4 piece powerpoint presentation diagram infographic slide
Completely editable PowerPoint slides including fonts, text, colors. Presentation design can be displayed in standard and widescreen view. PPT template is fully editable to allow customization. Simple to download and convert into PDF format. Suitable for small and large scale organizations. Compatible with number of software options. Personalize the presentation with individual company name and logo. Excellence in picture quality. Suitable for research and development team, business planners, corporate team leaders and managers.
-
 63584971 style layered vertical 4 piece powerpoint presentation diagram infographic slide
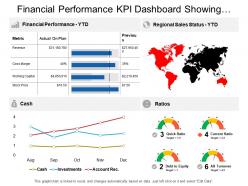
Presenting this set of slides with name - Financial Performance Kpi Dashboard Showing Regional Sales Status Cash And Ratios. This is a four stage process. The stages in this process are Financial Performance, Financial Report, Financial Review.
-
 Rating scale of credit score
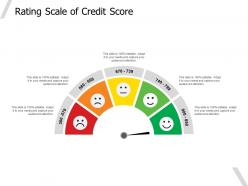
Presenting this set of slides with name Rating Scale Of Credit Score. This is a five stage process. The stages in this process are Product Improvement, Rating Scale, Product Quality. This is a completely editable PowerPoint presentation and is available for immediate download. Download now and impress your audience.
-
 2577864 style essentials 2 dashboard 3 piece powerpoint presentation diagram infographic slide
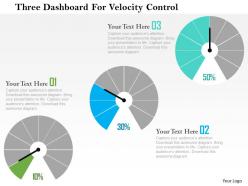
Comfortably operate this slide in all software. Smoothly download and use slide. Company logo, trademark or name can be put in for specificity. Project on widescreen without worrying about PPT graphics pixelation. Compatible with google slides. Indicate titles and sub titles without feeling constrained in terms of space. High resolution PPT slides. Useful in automotive businesses, startups and research purposes.
-
 6581102 style circular hub-spoke 6 piece powerpoint presentation diagram infographic slide
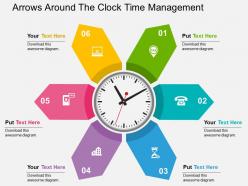
Visually appealing PowerPoint presentation patterns. High quality images and visuals used in the PPT design. Adaptable PPT slides as fully compatible with Google slides. Beneficial for industry professionals, managers, executives, researchers, sales people, etc. The presentation template can be downloaded and saved in any desired format. Privilege of insertion of logo and trademarks for more personalization.
-
 36273554 style essentials 2 dashboard 2 piece powerpoint presentation diagram infographic slide
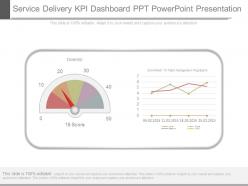
Presenting service delivery kpi dashboard snapshot ppt powerpoint presentation. This is a service delivery kpi dashboard ppt powerpoint presentation. This is a two stage process. The stages in this process are diversity, commitment to talent management progress.
-
 24179247 style essentials 2 dashboard 5 piece powerpoint presentation diagram infographic slide
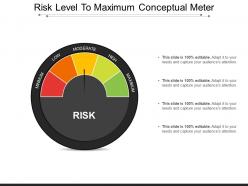
Presenting this set of slides with name - Risk Level To Maximum Conceptual Meter. This is a five stage process. The stages in this process are Risk Meter, Risk Speedometer, Hazard Meter.
-
 80477865 style essentials 2 dashboard 1 piece powerpoint presentation diagram infographic slide
Thoroughly editable PowerPoint slide design. Impressive depiction of speedometer visual. Ease of addition and exclusion of content as per individual preference. Freedom to personalize the slide content with company specific name, logo or trademark. Harmonious set of slides with multiple format options. Harmonious with multiple software options. High resolution visual do not get blurred when projected on wide screen.
-
 55921601 style variety 3 measure 1 piece powerpoint presentation diagram infographic slide
This PowerPoint slide can be used by businesses professionals for time management related presentations .The topics and the corresponding terms shown in the diagram can be easily edited by following the instructions in the corresponding slide , the color and orientation of the elements can also be altered easily. These PPT slides are compatible with Google slides.
-
 94425376 style essentials 2 dashboard 5 piece powerpoint presentation diagram infographic slide
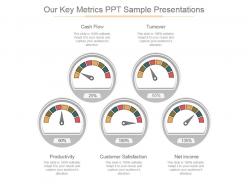
Presenting our key metrics ppt sample presentations. This is a our key metrics ppt sample presentations. This is a five stage process. The stages in this process are cash flow, turnover, net income, customer satisfaction, productivity.
-
 73268501 style essentials 2 dashboard 5 piece powerpoint presentation diagram infographic slide
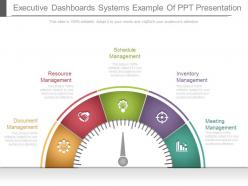
Presenting executive dashboards systems example of ppt presentation. This is a executive dashboards systems example of ppt presentation. This is a five stage process. The stages in this process are document management, resource management, schedule management, inventory management, meeting management.
-
 27518176 style essentials 2 dashboard 1 piece powerpoint presentation diagram infographic slide
Presenting, the performance meter speedometer PowerPoint Presentation Slide. This Presentation has been designed professionally and is fully editable. You can personalize font size, font type, colors, and even the background. This Template is obedient with Google Slide and can be saved in JPG or PDF format without any hassle. Fast download at the click of the button.
-
 Score meter infographic with number rating
Presenting Score Meter Infographic With Number Rating slide. This PPT supports both the standard(4:3) and widescreen(16:9) sizes. This presentation is very easy to download and can be converted into numerous images or document formats including JPEG, PNG, or PDF. It is also compatible with Google Slides and editable in PowerPoint. Alter the style, size, color, background, and other attributes according to your requirements. Moreover, high-quality images prevent the lowering of quality.
-
 55942853 style essentials 2 dashboard 4 piece powerpoint presentation diagram infographic slide
Well-crafted and professionally equipped PowerPoint visual. Ease of editing every component of the PPT template. Guidance for executing the changes has been provided for assistance. Modify and personalize the presentation by including the company name and logo. Compatible with varied number of format options. Compatible with multiple software options available both online and offline. Perfect for business strategists, sales and marketing team, customer service team and entrepreneurs.
-
 7189323 style essentials 2 dashboard 3 piece powerpoint presentation diagram infographic slide
Presenting this set of slides with name - Financial Ratio Kpi Dashboard Showing Liquidity Ratio Analysis Current Ratio And Quick Ratio. This is a three stage process. The stages in this process are Accounting Ratio, Financial Statement, Financial Ratio.
-
 62019203 style essentials 2 dashboard 1 piece powerpoint presentation diagram infographic slide
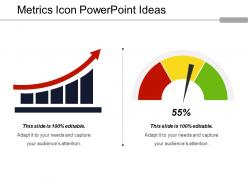
Presenting Metrics Icon PowerPoint Ideas which is completely editable. Can be changed into formats like PDF, JPG, and PNG. The slide is readily available in both 4:3 and 16:9 aspect ratio. The template is compatible with Google Slides, which makes it accessible at once. Modify the colors, fonts, font size, and font types of the template as per the requirements.
-
 6166447 style essentials 2 dashboard 3 piece powerpoint presentation diagram infographic slide
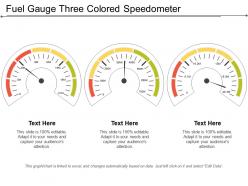
Presenting this set of slides with name - Fuel Gauge Three Colored Speedometer. This is a three stage process. The stages in this process are Fuel Gauge, Gas Gauge, Fuel Containers.
-
 65250728 style essentials 2 dashboard 4 piece powerpoint presentation diagram infographic slide
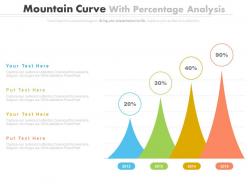
Great tool for various purposes especially businesses having strategic goals. Handy in Schools, Universities and other professional organisation. Hassle free PPT design templates. View in widescreen for maximum benefit. Compatible with google slides. Convert slide to JPG and PDF formats. Make use of icons library to change icons according to your needs. Change aspects like colors, Icon shape and size etc.
-
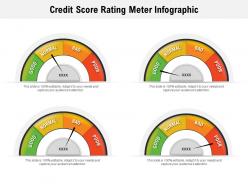 Credit score rating meter infographic
Presenting Credit Score Rating Meter Infographic slide. This PPT supports both the standard(4:3) and widescreen(16:9) sizes. This presentation is very easy to download and can be converted into numerous images or document formats including JPEG, PNG, or PDF. It is also compatible with Google Slides and editable in PowerPoint. Alter the style, size, color, background, and other attributes according to your requirements. Moreover, high-quality images prevent the lowering of quality.
-
 40266992 style concepts 1 growth 4 piece powerpoint presentation diagram infographic slide
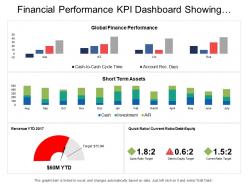
Presenting this set of slides with name - Financial Performance Kpi Dashboard Showing Revenue Quick Ratio Short Term Assets. This is a four stage process. The stages in this process are Financial Performance, Financial Report, Financial Review.
-
 91057285 style essentials 2 dashboard 4 piece powerpoint presentation diagram infographic slide
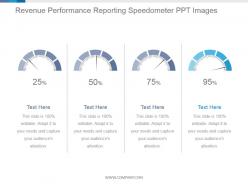
Presenting revenue performance reporting speedometer ppt images. This is a revenue performance reporting speedometer ppt images. This is a four stage process. The stages in this process are dashboard, measure, percentage, business, marketing.
-
 35860831 style essentials 2 financials 3 piece powerpoint presentation diagram infographic slide
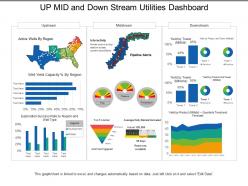
Presenting this set of slides with name - Up Mid And Down Stream Utilities Dashboard. This is a three stage process. The stages in this process are Utilities, Use, Advantage.
-
 48306940 style essentials 2 financials 3 piece powerpoint presentation diagram template slide
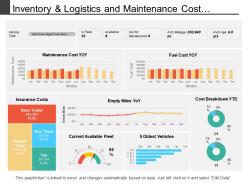
Presenting this set of slides with name - Inventory And Logistics And Maintenance Cost Dashboard. This is a three stage process. The stages in this process are Inventory And Logistics, Inventory Management, Warehousing And Inventory Management.
-
 41185557 style essentials 2 dashboard 4 piece powerpoint presentation diagram infographic slide
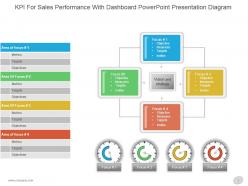
Presenting kpi for sales performance with dashboard powerpoint presentation diagram. This is a kpi for sales performance with dashboard powerpoint presentation diagram. This is a four stage process. The stages in this process are area of focus, metrics, objectives, focus, objective, measures, targets, invites, vision and strategy.
-
 95617219 style essentials 2 dashboard 1 piece powerpoint presentation diagram infographic slide
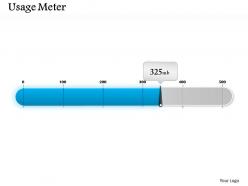
Access to edit the content, style, size and orientation of the PPT slides. Use of high resolution images and the graphics. Convertible into numerous format options like JPEG, JPG or PDF. User friendly structure of the slides. Replace the watermark with your company’s name or logo. Ease to share the presentation slide in standard and widescreen view. PPT slide for representing flowcharts. Has attractive and error free inclusion of visuals.
-
 43722849 style essentials 2 dashboard 4 piece powerpoint presentation diagram infographic slide
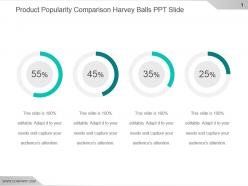
Presenting product popularity comparison harvey balls ppt slide. This is a product popularity comparison harvey balls ppt slide. This is a four stage process. The stages in this process are business, percentage, finance, marketing, strategy, success.
-
 22751670 style essentials 2 dashboard 4 piece powerpoint presentation diagram template slide
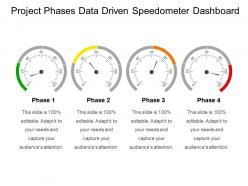
Presenting project phases data driven speedometer dashboard. This is a project phases data driven speedometer dashboard snapshot. This is a four stage process. The stages in this process are project phases templates, project steps, project methods.
-
 29971457 style essentials 2 dashboard 1 piece powerpoint presentation diagram infographic slide
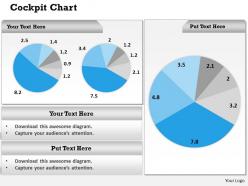
One of a kind PPT presentation diagrams. Possess high quality and unique patterns and icons to impress the viewers. Allows the information flow smoothly without any errors or interference. Beneficial to the enterprises, investors, customers and clients. Entirely amendable layouts to alter the appearance as per the business needs. Makes the entire concept clear in the mind of the viewers.
-
 3076916 style essentials 2 dashboard 1 piece powerpoint presentation diagram infographic slide
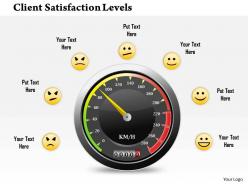
Extremely influencing PPT presentation diagrams. User-friendly layouts. Creates a bond between the presentation and the viewers. Runs smoothly with all the software’s. Capacious backgrounds enable inserting heading and subheadings. Can be converted into different formats such as JPG and PFF.
-
 73879690 style essentials 2 dashboard 4 piece powerpoint presentation diagram infographic slide
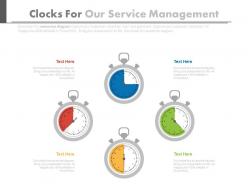
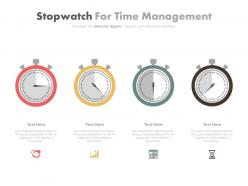
Presenting four stopwatch for time management powerpoint slides. This Power Point template diagram slide has been crafted with graphic of four stopwatches. This PPT diagram contains the concept of time management representation. Use this PPT diagram for business and management related presentations.
-
 5396121 style essentials 2 dashboard 5 piece powerpoint presentation diagram infographic slide
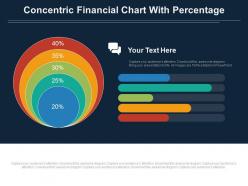
The graphics present a flamboyant projection delivering utmost clarity. The slides are compatible with the Google Slides and the multiple file formats are available to save the template post downloading. Explore the wide range of customization of its colors, orientation, and size scheme. Remove the watermark of Slide Team and insert the desired text, watermark and logo at few clicks.
-
 74193217 style essentials 2 dashboard 6 piece powerpoint presentation diagram infographic slide
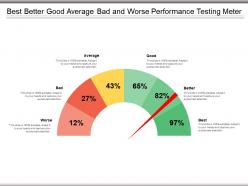
Presenting this set of slides with name - Best Better Good Average Bad And Worse Performance Testing Meter. This is a six stage process. The stages in this process are Performance Testing, Performance Analysis, Performance Monitoring.
-
 45944478 style essentials 2 dashboard 4 piece powerpoint presentation diagram infographic slide
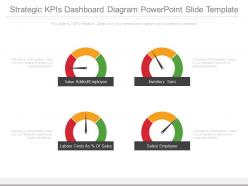
Presenting strategic kpis dashboard snapshot diagram powerpoint slide template. This is a strategic kpis dashboard diagram powerpoint slide template. This is a four stage process. The stages in this process are value added employee, inventory turn, sales employee, labour costs as of sales.
-
 35648260 style essentials 2 dashboard 2 piece powerpoint presentation diagram infographic slide
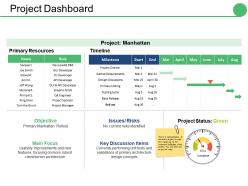
Presenting this set of slides with name - Project Dashboard Ppt Gallery Slides. This is a two stage process. The stages in this process are Milestone, Project, Objective, Main Focus, Key Discussion Items.
-
 13152241 style essentials 2 dashboard 1 piece powerpoint presentation diagram infographic slide
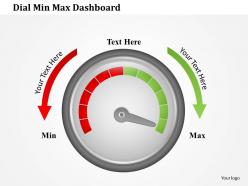
We are proud to present our 1114 dial min max dashboard powerpoint presentation. This Power Point template slide has been crafted with graphic of meter. This meter contains the max and min value. Use this PPt for your technical presentations and display your technical specifications in a graphical way.
-
 33997026 style essentials 2 dashboard 5 piece powerpoint presentation diagram infographic slide
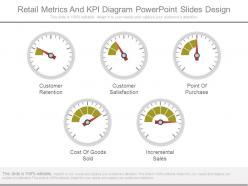
Presenting retail metrics and kpi diagram powerpoint slides design. This is a retail metrics and kpi diagram powerpoint slides design. This is a five stage process. The stages in this process are customer retention, customer satisfaction, point of purchase, cost of goods sold, incremental sales.
-
 19483160 style essentials 2 compare 4 piece powerpoint presentation diagram infographic slide
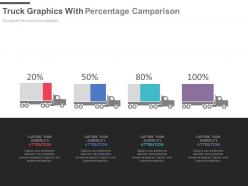
The slides transmit a powerful display quality impacting an everlasting impression. Download the slide info graphics in various file formats (JPEG, JPG, PDF.) Play the slides in Google slides as a convenient measure. Transform the slide as per your own suitability in terms of colour and size adjustment. Position the graphics accordingly to recast its outlook. The watermark of Slide Team is easily removable.
-
 14820610 style essentials 2 dashboard 1 piece powerpoint presentation diagram infographic slide
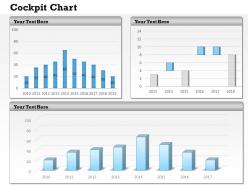
Can be used to display complex information in a simple manner. Integrated with a dashboard chart to analyse the business performance and create awareness among the viewers. Possess time-saving capabilities. Helps in the process of decision making and forming effective strategies. Enables widescreen view without distorting the image quality. Runs smoothly with all software’s.
-
 22997244 style essentials 1 agenda 3 piece powerpoint presentation diagram infographic slide
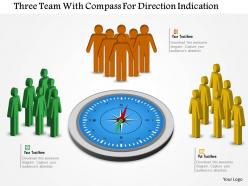
We are proud to present our three teams with compass for direction indication flat powerpoint design. This power point template diagram has been designed with graphic of three teams and compass. These teams are used to show teamwork and direction indication. Use this PPT diagram for business and management related presentations.
-
 85698852 style essentials 2 dashboard 5 piece powerpoint presentation diagram infographic slide
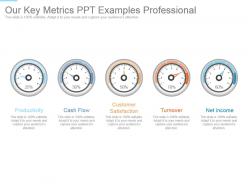
Presenting our key metrics ppt examples professional. This is a our key metrics ppt examples professional. This is a five stage process. The stages in this process are productivity, cash flow, customer satisfaction, turnover, net income.
-
 Odometer icon with full speed and speedometer
Presenting this set of slides with name Odometer Icon With Full Speed And Speedometer. This is a three stage process. The stages in this process are Odometer Icon, Full Speed, Speedometer. This is a completely editable PowerPoint presentation and is available for immediate download. Download now and impress your audience.
-
 98430836 style division pie 6 piece powerpoint presentation diagram infographic slide
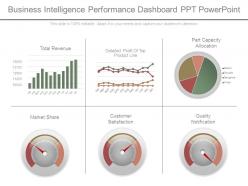
Presenting business intelligence performance dashboard snapshot ppt powerpoint. This is a business intelligence performance dashboard ppt powerpoint. This is a six stage process. The stages in this process are total revenue, detailed profit of top product line, part capacity allocation, market share, customer satisfaction, quality notification.
-
 58624038 style essentials 2 dashboard 4 piece powerpoint presentation diagram template slide
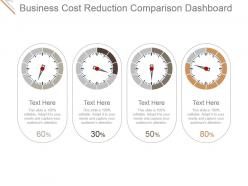
Presenting business cost reduction comparison dashboard ppt ideas. This is a business cost reduction comparison dashboard snapshot ppt ideas. This is a four stage process. The stages in this process are business, meter, measure, reduction, cost.
-
 23659841 style essentials 2 financials 6 piece powerpoint presentation diagram template slide
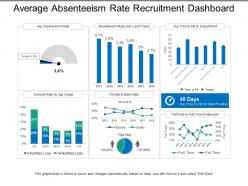
Presenting this set of slides with name - Average Absenteeism Rate Recruitment Dashboard. This is a six stage process. The stages in this process are Staffing Plan, Recruitment, Staff Management.
-
 Economic impact of covid 19 on different sectors of india ppt powerpoint presentation icon
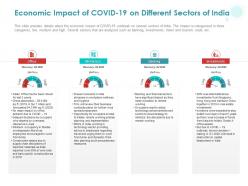
This slide provides details about the economic impact of COVID 19 outbreak on several sectors of India. The impact is categorized in three categories, low, medium and high. Several sectors that are analyzed such as banking, investments, travel and tourism, retail, etc. Presenting this set of slides with name Economic Impact Of COVID 19 On Different Sectors Of India Ppt Powerpoint Presentation Icon. This is a four stage process. The stages in this process are Office, Workplace, Banking, Investments. This is a completely editable PowerPoint presentation and is available for immediate download. Download now and impress your audience.
-
 4445233 style essentials 2 dashboard 4 piece powerpoint presentation diagram template slide
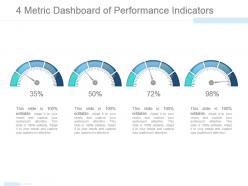
Presenting 4 metric dashboard of performance indicators example of ppt. This is a 4 metric dashboard of performance indicators example of ppt. This is a four stage process. The stages in this process are dashboard, finance, percentage, business, marketing.
-
 55726391 style essentials 2 dashboard 3 piece powerpoint presentation diagram infographic slide
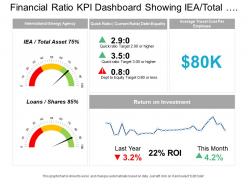
Presenting this set of slides with name - Financial Ratio Kpi Dashboard Showing Iea Total Assets And Return On Investment. This is a three stage process. The stages in this process are Accounting Ratio, Financial Statement, Financial Ratio.
-
 58198047 style essentials 2 dashboard 1 piece powerpoint presentation diagram infographic slide
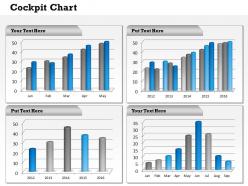
Quality graphics and images are used in the slide template. It is easy to download, save and then edit while using the online or offline Microsoft office software. Customizable style, background and orientation of the template. Follow how to change the icons or graphics information provided in the slide template. A must have for the human resource and management staff in a company.
-
 24723489 style essentials 2 dashboard 1 piece powerpoint presentation diagram infographic slide
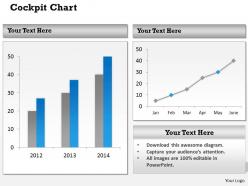
The graphics, background, style and the entire layout can be modified as per user’s requirement. The PPT template fits well with the Microsoft office software or even online presentation templates Provided instruction to customize make it easier for the user to make its proper use. Easy to download. Fit to be used by the marketers, professional business owners and the students.
-
 94044946 style essentials 2 dashboard 4 piece powerpoint presentation diagram infographic slide
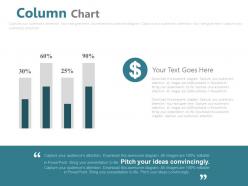
This PPT Template can be used by any employees for representing business and finance related presentations. All these icons and elements used here are 100% editable in terms of color, size, and orientation of the elements mentioned in the slides. These PPT slides are compatible with Google slides and can be edited in any PowerPoint software.
-
 19716884 style essentials 2 dashboard 2 piece powerpoint presentation diagram infographic slide
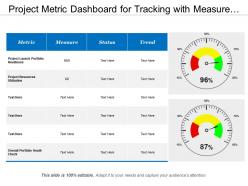
Presenting this set of slides with name - Project Metric Dashboard For Tracking With Measure Status Trend. This is a two stage process. The stages in this process are Project Kpis, Project Dashboard, Project Metrics.
-
 2868018 style essentials 2 dashboard 1 piece powerpoint presentation diagram infographic slide
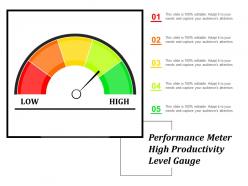
Presenting, the performance meter PowerPoint Presentation Slide. This Presentation has been designed professionally and is fully editable. You can customize the font size, font type, colors, and even the background. This Template is obedient with Google Slide and can be saved in JPG or PDF format without any hassle. Fast download at the click of the button.
-
 1503841 style essentials 2 dashboard 1 piece powerpoint presentation diagram infographic slide
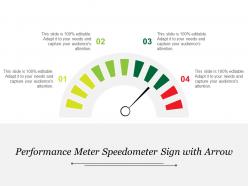
This highly versatile, innovative design is completely editable; you can modify the design the way you want. Slides are fully compatible with Google Slides and MS PowerPoint software. Instant and quick downloading available; you can save the design into your system into various formats such as JPEG or PDF. Both standard and wide screen view are available; no effect on design quality when opened on wide screen view.


