Unique 3 Dashboard Essentials PowerPoint PPT Templates
-
 48306940 style essentials 2 financials 3 piece powerpoint presentation diagram template slide
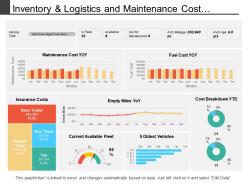
Presenting this set of slides with name - Inventory And Logistics And Maintenance Cost Dashboard. This is a three stage process. The stages in this process are Inventory And Logistics, Inventory Management, Warehousing And Inventory Management.
-
 35860831 style essentials 2 financials 3 piece powerpoint presentation diagram infographic slide
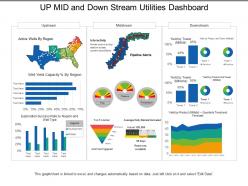
Presenting this set of slides with name - Up Mid And Down Stream Utilities Dashboard. This is a three stage process. The stages in this process are Utilities, Use, Advantage.
-
 22997244 style essentials 1 agenda 3 piece powerpoint presentation diagram infographic slide
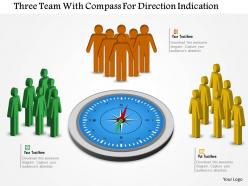
We are proud to present our three teams with compass for direction indication flat powerpoint design. This power point template diagram has been designed with graphic of three teams and compass. These teams are used to show teamwork and direction indication. Use this PPT diagram for business and management related presentations.
-
 Odometer icon with full speed and speedometer
Presenting this set of slides with name Odometer Icon With Full Speed And Speedometer. This is a three stage process. The stages in this process are Odometer Icon, Full Speed, Speedometer. This is a completely editable PowerPoint presentation and is available for immediate download. Download now and impress your audience.
-
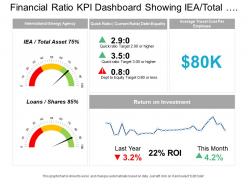 55726391 style essentials 2 dashboard 3 piece powerpoint presentation diagram infographic slide
Presenting this set of slides with name - Financial Ratio Kpi Dashboard Showing Iea Total Assets And Return On Investment. This is a three stage process. The stages in this process are Accounting Ratio, Financial Statement, Financial Ratio.
-
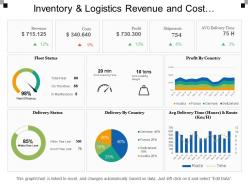 81215616 style division donut 3 piece powerpoint presentation diagram infographic slide
Presenting this set of slides with name - Inventory And Logistics Revenue And Cost Dashboards. This is a three stage process. The stages in this process are Inventory And Logistics, Inventory Management, Warehousing And Inventory Management.
-
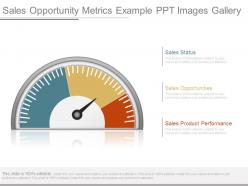 65542530 style essentials 2 dashboard 3 piece powerpoint presentation diagram infographic slide
Presenting sales opportunity metrics example ppt images gallery. This is a sales opportunity metrics example ppt images gallery. This is a three stage process. The stages in this process are sales status, sales opportunities, sales product performance.
-
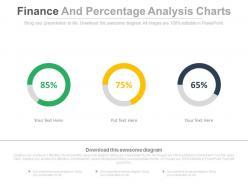 86418162 style essentials 2 dashboard 3 piece powerpoint presentation diagram infographic slide
Quick and simple download. Add text to suit the context of your presentation. Absolutely editable contrast and color scheme to suit your need. No change in resolution of PPT images after editing. Fully editable icons and PPT infographics- change size and orientation as required. Insert your own company logo, tagline, trademark, watermark etc.
-
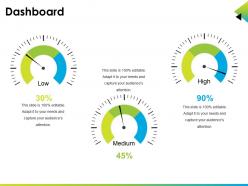 50149646 style essentials 2 dashboard 3 piece powerpoint presentation diagram infographic slide
Presenting dashboard ppt infographic template. This is a dashboard snapshot ppt infographic template. This is a three stage process. The stages in this process are dashboard, low, high, medium.
-
 37020560 style essentials 2 dashboard 3 piece powerpoint presentation diagram infographic slide
Presenting barometer three colour indicator icon. This is a barometer three colour indicator icon. This is a three stage process. The stages in this process are barometer, weather instrument, ?pressure gauge.
-
 Shipping KPI Icon For Tracking Order Delivery Delays
Introducing our premium set of slides with Shipping KPI Icon For Tracking Order Delivery Delays. Elucidate the three stages and present information using this PPT slide. This is a completely adaptable PowerPoint template design that can be used to interpret topics like Shipping KPI, Icon, Tracking, Order Delivery Delays. So download instantly and tailor it with your information.
-
 29594711 style essentials 2 dashboard 3 piece powerpoint presentation diagram infographic slide
High resolution PPT visuals do not pixel ate even after customization. All the PPT icons, text, background and diagrams can be edited to match your need. It can further be saved in any format of your choice (JPG/JPEG/PDF). Harmonious with varied set of software options available online and offline. Guidance for editing of the PPT diagram is provided for assistance. It’s a useful PowerPoint slide design for business owners, operations mangers, marketing executive, professors and students.
-
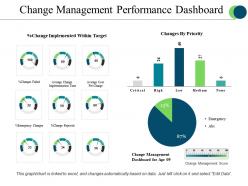 17683719 style division pie 3 piece powerpoint presentation diagram infographic slide
Presenting change management performance dashboard powerpoint slide designs. This is a change management performance dashboard powerpoint slide designs. This is a three stage process. The stages in this process are critical, high, low, medium, none.
-
 92477113 style essentials 2 dashboard 3 piece powerpoint presentation diagram infographic slide
Presenting financial metrics and kpi diagram presentation visual aids. This is a financial metrics and kpi diagram presentation visual aids. This is a three stage process. The stages in this process are operating profit last 12 months, total income act vs forecast between 2009 and 2010, income by qtr by tr between 2007 and 2010.
-
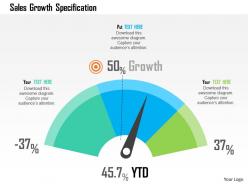 57350132 style concepts 1 growth 1 piece powerpoint presentation diagram infographic slide
No effect on picture quality when operated on a wide screen. Complete access to edit the content, size, style and orientation of the slide icons. Provided information to make the changes or edit the slide design. Replace the watermark in the background with you company’s name. Beneficial for the marketing Individuals and the sale observers.
-
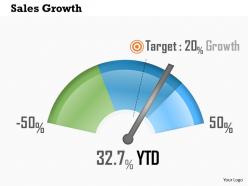 35325225 style essentials 2 dashboard 5 piece powerpoint presentation diagram infographic slide
100 percent editable thank you slide example. Modify the content as per individual need and preference. Add or exclude the elements as per choice. Include the company name, logo or trademark for that extra personalization. Compatible with numerous format options. Harmonious with varied software available online and offline. Visually impressive and information rich. Applied by several marketers, corporate professionals and scholars at the end of their presentation.
-
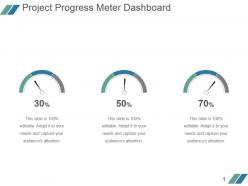 47103565 style essentials 2 dashboard 3 piece powerpoint presentation diagram infographic slide
Presenting project progress meter dashboard powerpoint slide designs download. This is a project progress meter dashboard powerpoint slide designs download. This is a three stage process. The stages in this process are business, marketing, dashboard, percentage.
-
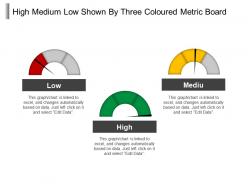 23824483 style essentials 2 dashboard 3 piece powerpoint presentation diagram infographic slide
Presenting this set of slides with name - High Medium Low Shown By Three Coloured Metric Board. This is a three stage process. The stages in this process are High Medium Low, High Moderate Low, Top Medium Low.
-
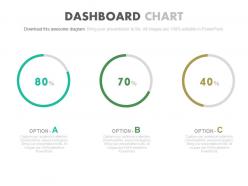 84800712 style essentials 2 dashboard 3 piece powerpoint presentation diagram infographic slide
The PowerPoint presentation supports easy proofing and editing. Presentation slide is useful in business marketing, management and recourse disbursement. Basic theme yet it can modified with respect to font, color and layout. Attractive and professional color scheme. PPT graphic offers font size which can be read from a distance. Shapes are in vector format and can be edited.
-
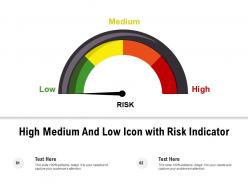 High medium and low icon with risk indicator
Presenting this set of slides with name High Medium And Low Icon With Risk Indicator. This is a three stage process. The stages in this process are High Medium, Low Icon, Risk Indicator. This is a completely editable PowerPoint presentation and is available for immediate download. Download now and impress your audience.
-
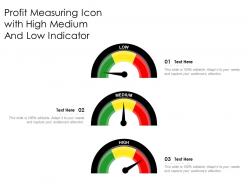 Profit measuring icon with high medium and low indicator
Presenting this set of slides with name Profit Measuring Icon With High Medium And Low Indicator. This is a three stage process. The stages in this process are Profit Measuring, Icon, High Medium, Low Indicator. This is a completely editable PowerPoint presentation and is available for immediate download. Download now and impress your audience.
-
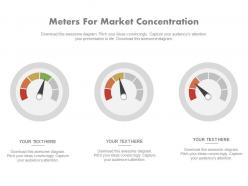 77448691 style essentials 2 dashboard 3 piece powerpoint presentation diagram infographic slide
Presenting three meters graphics for market concentration powerpoint slides. This Power Point template slide has been crafted with graphic of three meters diagram. This PPT diagram contains the concept of market concentration analysis. Use this PPT diagram slide for business and marketing related presentations.
-
 89964702 style essentials 2 dashboard 3 piece powerpoint presentation diagram infographic slide
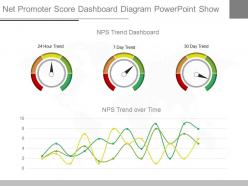
Presenting app net promoter score dashboard diagram powerpoint show. This is a net promoter score dashboard diagram powerpoint show. This is a three stage process. The stages in this process are 24 hour trend, nps trend dashboard, 7 day trend, 30 day trend, nps trend over time.
-
 98684152 style essentials 2 dashboard 3 piece powerpoint presentation diagram infographic slide
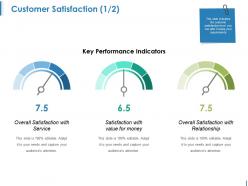
Presenting this set of slides with name - Customer Satisfaction Ppt Background. This is a three stage process. The stages in this process are Overall Satisfaction With Service, Satisfaction With Value For Money, Overall Satisfaction With Relationship.
-
 67582794 style essentials 2 dashboard 3 piece powerpoint presentation diagram infographic slide
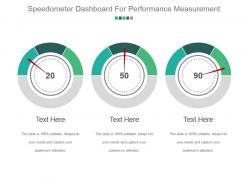
Presenting speedometer dashboard for performance measurement powerpoint slide backgrounds. This is a speedometer dashboard for performance measurement powerpoint slide backgrounds. This is a three stage process. The stages in this process are measure, meter, dashboard, speedometer, needle.
-
 45135755 style essentials 2 dashboard 3 piece powerpoint presentation diagram infographic slide
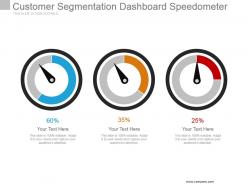
Presenting customer segmentation dashboard speedometer powerpoint slide. This is a customer segmentation dashboard speedometer powerpoint slide. This is a three stage process. The stages in this process are dashboard, measurement, business, strategy, success.
-
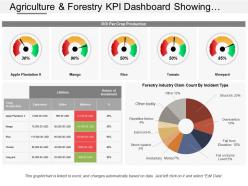 28408799 style essentials 2 dashboard 3 piece powerpoint presentation diagram infographic slide
Presenting agriculture and forestry KPI dashboard showing ROI per crop production and industry claim count PowerPoint slide. Unaffected high-resolution PowerPoint slide. Include or exclude slide content as per your individual need. Personalize the presentation with individual company name and logo. Beneficial for industry professionals, managers, executives, researchers, sales people, etc. This template is available in both Standard and Widescreen slide size. Easy and quick downloading process. Flexible option for conversion in PDF or JPG formats. Compatible with Google slides.
-
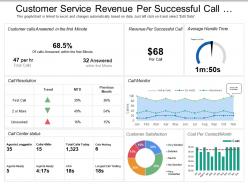 42034575 style essentials 2 financials 3 piece powerpoint presentation diagram infographic slide
Presenting this set of slides with name - Customer Service Revenue Per Successful Call Dashboard. This is a three stage process. The stages in this process are Customer Base, Recurring Customers, Customer Services.
-
 27059106 style division pie 3 piece powerpoint presentation diagram infographic slide
Presenting transportation KPI dashboard snapshot showing fleet delivery status loading time and weight PPT slide. Simple data input with linked Excel chart, just right click to input values. This PowerPoint theme is fully supported by Google slides. Picture quality of these slides does not change even when project on large screen. Fast downloading speed and formats can be easily changed to JPEG and PDF applications. This template is suitable for marketing, sales persons, business managers and entrepreneurs.
-
 15924664 style essentials 2 dashboard 3 piece powerpoint presentation diagram infographic slide
Presenting customer support analysis infographics powerpoint slides. This Power Point template slide has been crafted with graphic of customer support info graphics. This PPT slide contains the concept of customer support analysis representation. Use this PPT slide for business and finance related presentations.
-
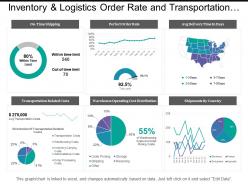 88683392 style essentials 2 dashboard 3 piece powerpoint presentation diagram infographic slide
Presenting this set of slides with name - Inventory And Logistics Order Rate And Transportation Costs Dashboards. This is a three stage process. The stages in this process are Inventory And Logistics, Inventory Management, Warehousing And Inventory Management.
-
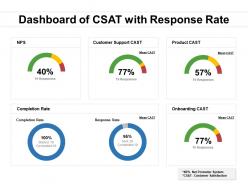 Dashboard of csat with response rate
Presenting this set of slides with name Dashboard Of CSAT With Response Rate. This is a three stage process. The stages in this process are Unsatisfied, Neutral, Satisfaction . This is a completely editable PowerPoint presentation and is available for immediate download. Download now and impress your audience.
-
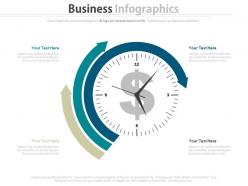 77584458 style essentials 2 dashboard 3 piece powerpoint presentation diagram infographic slide
Presenting time management for digital marketing and planning financial growth powerpoint slides. This Power Point template diagram slide has been crafted with graphic of growth. This PPT diagram contains the concept of time management and planning representation. Use this PPT diagram for business and finance related presentations.
-
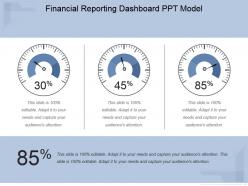 87611220 style essentials 2 dashboard 3 piece powerpoint presentation diagram infographic slide
Presenting financial reporting dashboard ppt model. This is a financial reporting dashboard snapshot ppt model. This is a three stage process. The stages in this process are business, dashboard, financial, measuring, meter.
-
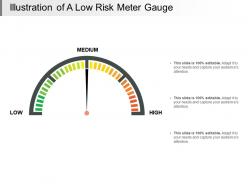 60311678 style essentials 2 dashboard 3 piece powerpoint presentation diagram infographic slide
Presenting this set of slides with name - Illustration Of A Low Risk Meter Gauge. This is a three stage process. The stages in this process are Risk Meter, Risk Speedometer, Hazard Meter.
-
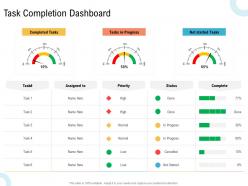 Task completion dashboard creating an effective content planning strategy for website ppt sample
Increase audience engagement and knowledge by dispensing information using Task Completion Dashboard Creating An Effective Content Planning Strategy For Website Ppt Sample. This template helps you present information on three stages. You can also present information on completed tasks, tasks in progress, net started tasksusing this PPT design. This layout is completely editable so personaize it now to meet your audiences expectations.
-
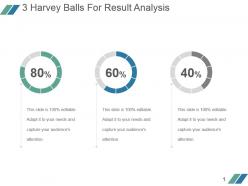 3838762 style essentials 2 dashboard 3 piece powerpoint presentation diagram template slide
Presenting 3 harvey balls for result analysis example of ppt. This is a 3 harvey balls for result analysis example of ppt. This is a three stage process. The stages in this process are finance, process, business, marketing, percentage.
-
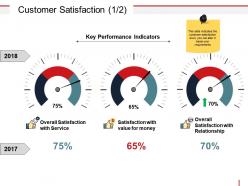 78064815 style essentials 2 dashboard 3 piece powerpoint presentation diagram infographic slide
Presenting customer satisfaction powerpoint images. This is a customer satisfaction powerpoint images. This is a three stage process. The stages in this process are key performance indicators, percentage, year, measurement, dashboard.
-
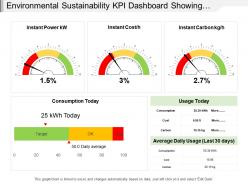 38933166 style essentials 2 dashboard 3 piece powerpoint presentation diagram infographic slide
Presenting this set of slides with name - Environmental Sustainability Kpi Dashboard Showing Instant Power Cost Carbon And Consumption. This is a three stage process. The stages in this process are Environment Sustainability, Environment Continual, Environment Feasibility.
-
 Customers rating scale meter icon
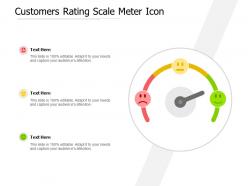
Presenting this set of slides with name Customers Rating Scale Meter Icon. This is a three stage process. The stages in this process are Product Improvement, Rating Scale, Product Quality. This is a completely editable PowerPoint presentation and is available for immediate download. Download now and impress your audience.
-
 99985412 style essentials 2 dashboard 3 piece powerpoint presentation diagram infographic slide
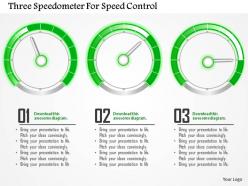
We are proud to present our three speedometer for speed control powerpoint template. Graphic of three speedometers has been used to craft this power point template. This PPT diagram contains the concept of speed control. Use this PPT diagram for business and technology related presentations and explain the control related topics.
-
 47780892 style essentials 2 dashboard 3 piece powerpoint presentation diagram infographic slide
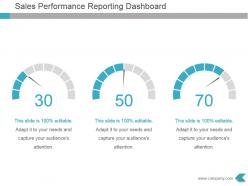
Presenting sales performance reporting dashboard powerpoint template. This is a sales performance reporting dashboard powerpoint template. This is a three stage process. The stages in this process are dashboard, management, process, strategy, analysis.
-
 41102574 style essentials 2 dashboard 3 piece powerpoint presentation diagram infographic slide
Presenting three meters for market segmentation analysis powerpoint slides. This Power Point template slide has been crafted with graphic of three meters diagram. This PPT diagram contains the concept of market segmentation analysis. Use this PPT diagram slide for business and marketing related presentations.
-
 56578914 style essentials 2 dashboard 3 piece powerpoint presentation diagram infographic slide
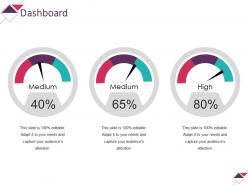
Presenting this set of slides with name - Dashboard Powerpoint Slide. This is a three stage process. The stages in this process are Medium, Medium, High, Dashboard, Business, Percentage.
-
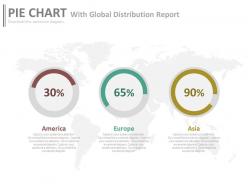 5546126 style essentials 2 dashboard 3 piece powerpoint presentation diagram infographic slide
Presenting three pie chart with global distribution report powerpoint slides. This Power Point template slide has been crafted with graphic of three pie charts and report. This PPT slide contains the concept of business result analysis and global report distribution. Use this PPT slide for business and finance related presentations.
-
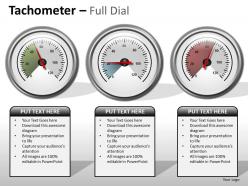 31823397 style variety 3 measure 1 piece powerpoint presentation diagram infographic slide
This template is skillfully designed and is completely editable to suit all the needs and requirements of the user. The color of the font, its size, style, and all other elements can be customized according to the user's desire The text in the PPT placeholder can be replaced with the desired information making this template highly flexible and adaptable as well. This template is also compatible with various Microsoft versions and formats like Google Slides, JPG, PDF, etc so the user will face no issue in saving it in the format of his choice.
-
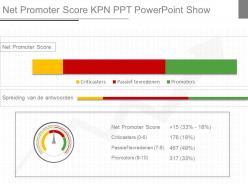 70172668 style essentials 2 dashboard 3 piece powerpoint presentation diagram infographic slide
Presenting new net promoter score kpn ppt powerpoint show. This is a net promoter score kpn ppt powerpoint show. This is a three stage process. The stages in this process are net promoter score, spreiding van de antwoorden, criticasters, passief tevredenen, promoters, criticasters.
-
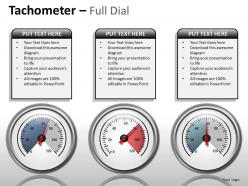 54570754 style variety 3 measure 1 piece powerpoint presentation diagram infographic slide
This template is skillfully designed and is completely editable to suit all the needs and requirements of the user. The color of the font, its size, style, and all other elements can be customized according to the user's desire The text in the PPT placeholder can be replaced with the desired information making this template highly flexible and adaptable as well. This template is also compatible with various Microsoft versions and formats like Google Slides, JPG, PDF, etc so the user will face no issue in saving it in the format of his choice.
-
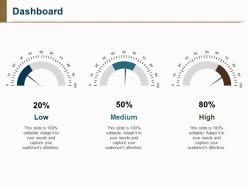 8161543 style essentials 2 dashboard 3 piece powerpoint presentation diagram infographic slide
Presenting dashboard snapshot PPT slide templates PPT slide. The speedometer dashboard excel presentation template designed by the designers of SlideTeam to give presentation on various subjects. The speedometer icon dashboard PPT slide is 100% editable in PowerPoint. The speedometer dashboard excel template is compatible with Google Slide and the template gets linked with Excel data sheet. You can make changes in the font size, font type, color as well as dimensions of the circular icons in the dashboard speedometer slide as per the requirement.
-
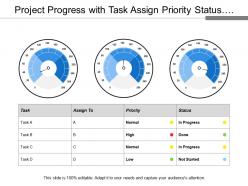 50510003 style essentials 2 dashboard 3 piece powerpoint presentation diagram infographic slide
Presenting this set of slides with name - Project Progress With Task Assign Priority Status And Meter With Different Rating. This is a three stage process. The stages in this process are Project Progress, Project Growth, Project Management.
-
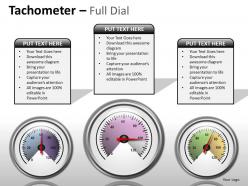 17713910 style variety 3 measure 1 piece powerpoint presentation diagram infographic slide
This template is skillfully designed and is completely editable to suit all the needs and requirements of the user. The color of the font, its size, style, and all other elements can be customized according to the user's desire The text in the PPT placeholder can be replaced with the desired information making this template highly flexible and adaptable as well. This template is also compatible with various Microsoft versions and formats like Google Slides, JPG, PDF, etc so the user will face no issue in saving it in the format of his choice.
-
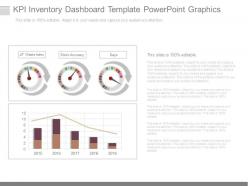 51913885 style essentials 2 dashboard 3 piece powerpoint presentation diagram infographic slide
Presenting kpi inventory dashboard template powerpoint graphics. This is a kpi inventory dashboard template powerpoint graphics. This is a three stage process. The stages in this process are jit waste index, stock accuracy, days.
-
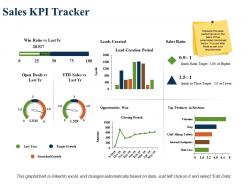 58962854 style essentials 2 dashboard 3 piece powerpoint presentation diagram infographic slide
Presenting this set of slides with name - Sales Kpi Tracker Lead Creation Period Sales Ratio. This is a three stage process. The stages in this process are Leads Created, Sales Ratio, Top Products In Revenue, Opportunities Won, Stretched Growth.
-
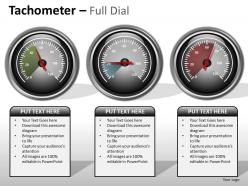 78394440 style variety 3 measure 1 piece powerpoint presentation diagram infographic slide
This template is skillfully designed and is completely editable to suit all the needs and requirements of the user. The color of the font, its size, style, and all other elements can be customized according to the user's desire The text in the PPT placeholder can be replaced with the desired information making this template highly flexible and adaptable as well. This template is also compatible with various Microsoft versions and formats like Google Slides, JPG, PDF, etc so the user will face no issue in saving it in the format of his choice.
-
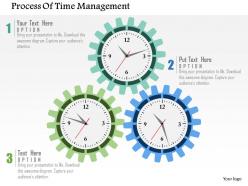 55871582 style essentials 1 agenda 3 piece powerpoint presentation diagram infographic slide
We are proud to present our process of time management flat powerpoint design. Three gear design clocks has been used to craft this power point template diagram. This PPT diagram contains the concept of time management. Use this PPT diagram for time related presentations.
-
 Strategic Performance Measurement Scale Icon
Introducing our premium set of slides with name Strategic Performance Measurement Scale Icon. Ellicudate the three stages and present information using this PPT slide. This is a completely adaptable PowerPoint template design that can be used to interpret topics like Strategic, Performance, Measurement, Scale Icon. So download instantly and tailor it with your information.
-
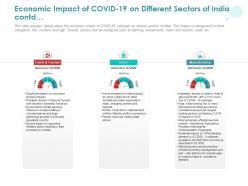 Economic impact of covid 19 on different sectors of india contd
This slide provides details about the economic impact of COVID 19 outbreak on several sectors of India. The impact is categorized in three categories, low, medium and high. Several sectors that are analyzed such as banking, investments, travel and tourism, retail, etc. Presenting this set of slides with name Economic Impact Of COVID 19 On Different Sectors Of India Contd. This is a three stage process. The stages in this process are Travel And Tourism, Retail, Manufacturing. This is a completely editable PowerPoint presentation and is available for immediate download. Download now and impress your audience.
-
 604785 style essentials 2 dashboard 3 piece powerpoint presentation diagram infographic slide
Presenting this set of slides with name - Dashboard Snapshot Ppt Summary Samples. This is a three stage process. The stages in this process are Low, Medium, High, Dashboard, Business, Percentage.
-
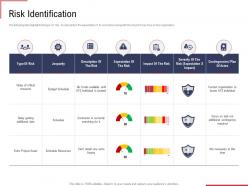 Risk identification ppt powerpoint presentation styles designs download
The following slide highlights the type of risk its description the expectation of its occurrence along with the impact it may have on the organization. Presenting this set of slides with name Risk Identification Ppt Powerpoint Presentation Styles Designs Download. This is a three stage process. The stages in this process are Risk Identification. This is a completely editable PowerPoint presentation and is available for immediate download. Download now and impress your audience.
-
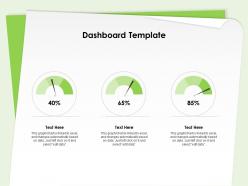 Dashboard template edit data ppt powerpoint presentation infographic template
Presenting this set of slides with name Dashboard Snapshot Template Edit Data Ppt Powerpoint Presentation Infographic Template. This is a three stage process. The stages in this process are Dashboard, Template, Edit Data. This is a completely editable PowerPoint presentation and is available for immediate download. Download now and impress your audience.


