92477113 style essentials 2 dashboard 3 piece powerpoint presentation diagram infographic slide
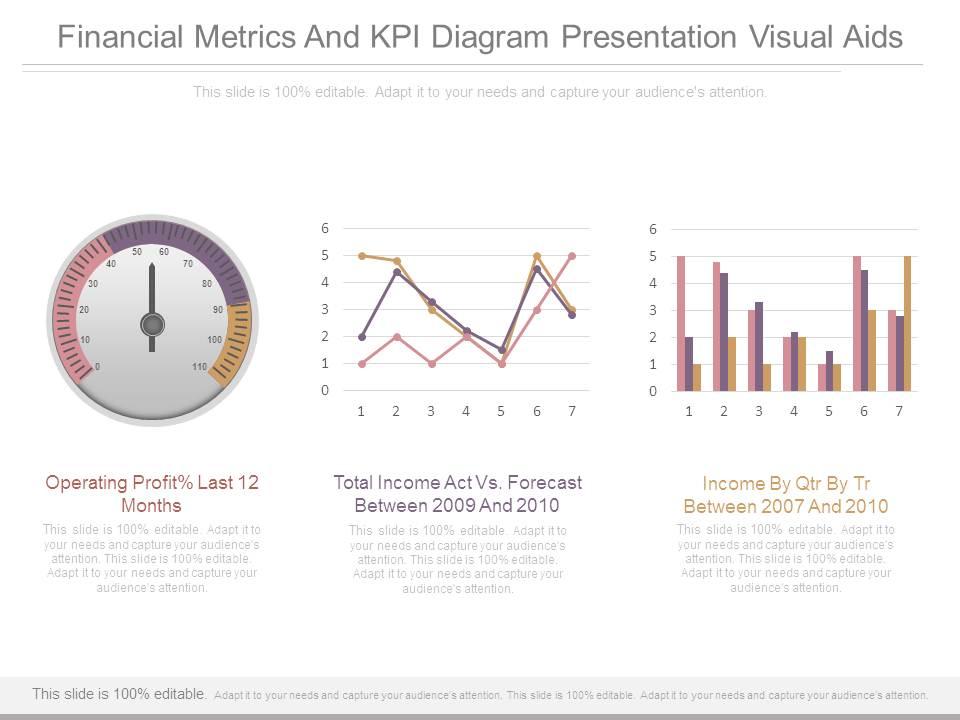
Our Financial Metrics And Kpi Diagram Presentation Visual Aids are great confidence builders. Convince everyone they are capable of achieving.
- Google Slides is a new FREE Presentation software from Google.
- All our content is 100% compatible with Google Slides.
- Just download our designs, and upload them to Google Slides and they will work automatically.
- Amaze your audience with SlideTeam and Google Slides.
-
Want Changes to This PPT Slide? Check out our Presentation Design Services
- WideScreen Aspect ratio is becoming a very popular format. When you download this product, the downloaded ZIP will contain this product in both standard and widescreen format.
-

- Some older products that we have may only be in standard format, but they can easily be converted to widescreen.
- To do this, please open the SlideTeam product in Powerpoint, and go to
- Design ( On the top bar) -> Page Setup -> and select "On-screen Show (16:9)” in the drop down for "Slides Sized for".
- The slide or theme will change to widescreen, and all graphics will adjust automatically. You can similarly convert our content to any other desired screen aspect ratio.
Compatible With Google Slides

Get This In WideScreen
You must be logged in to download this presentation.
PowerPoint presentation slides
Presenting financial metrics and kpi diagram presentation visual aids. This is a financial metrics and kpi diagram presentation visual aids. This is a three stage process. The stages in this process are operating profit last 12 months, total income act vs forecast between 2009 and 2010, income by qtr by tr between 2007 and 2010.
92477113 style essentials 2 dashboard 3 piece powerpoint presentation diagram infographic slide with all 4 slides:
Our Financial Metrics And Kpi Diagram Presentation Visual Aids can be employed for an array of functions. They are good for diverse applications.
-
Design layout is very impressive.
-
Excellent Designs.


