Top Range of 4 Dashboard Essentials PPT Powerpoint Templates
-
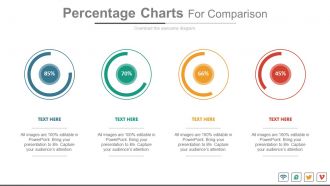 36490308 style essentials 2 compare 4 piece powerpoint presentation diagram infographic slide
The slides are equipped with superior resolution. Modify the slide outlook by changing the colors, size, and placement of graphics. The option of easy downloading is accompanied with the convenient saving of the template in multiple formats. Play the Ppt template in Google slides anytime anywhere. Remove the Slide-Team's watermark after completing the downloading process. Utilize the ample space for the content addition.
-
 4682803 style essentials 2 dashboard 4 piece powerpoint presentation diagram infographic slide
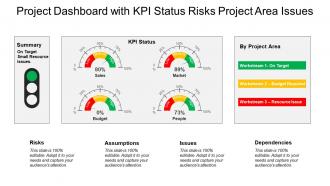
Presenting this set of slides with name - Project Dashboard Snapshot With Kpi Status Risks Project Area Issues. This is a four stage process. The stages in this process are Project Review, Project Analysis, Project Performance management.
-
 65130013 style essentials 2 dashboard 4 piece powerpoint presentation diagram infographic slide
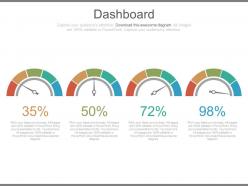
It consists of high resolution ppt slides to address all business and finance related concepts. Appealing background, color, layout and font. Can be easily converted into PDF or JPG. Alluring graphs for comparison and fascinating figures to illustrate the concepts. Useful for corporate people, researchers and business professionals..
-
 68043903 style essentials 2 dashboard 4 piece powerpoint presentation diagram infographic slide
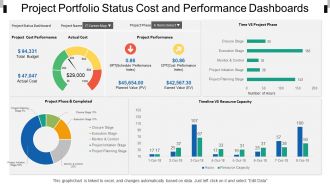
Presenting, project portfolio status cost and performance dashboards snapshot. This is an appealing design for project portfolio status cost and performance focused PowerPoint presentation. This PPT template can be used by experts from various backgrounds to present their ideas in a contemporary way. This slide is cooperative with google slides and after downloading you can use it in full version and insert your company's logo for your best practice. Unique thinking to mesmerize your audience. Fully editable PowerPoint colors, orientation, text, and graphics.
-
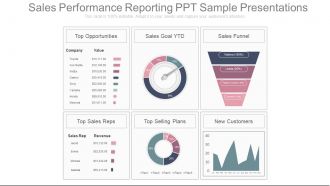 14720730 style essentials 2 dashboard 4 piece powerpoint presentation diagram infographic slide
These slides are fully editable to suit your needs. Instantly download any design within a few seconds. Standard and widescreen compatible graphics. Can be opened using Google Slides also. Suitable for use by marketers, sales team, businessmen. Premium customer support service.This is a four stage process. The stages in this process are top opportunities, sales goal ytd, sales funnel, top sales reps, top selling plans, new customers, company, value, sales rep, revenue.
-
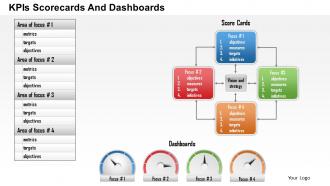 59992447 style essentials 2 dashboard 4 piece powerpoint presentation diagram infographic slide
We are proud to present our 1114 kpis scorecards and dashboards powerpoint presentation. Interconnected text box diagram has been used to decorate this power point template slide. This PPT diagram slide contains the concept of displaying KPIS score card. We have also used dashboard graphic to decorate this PPT slide.
-
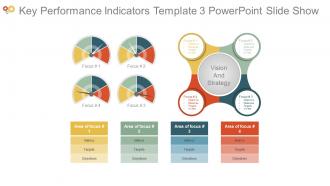 34061117 style essentials 2 dashboard 4 piece powerpoint presentation diagram infographic slide
Presenting key performance indicators template 3 powerpoint slide show. Presenting key performance indicators template 3 powerpoint slide show. Presenting key performance indicators template 3 powerpoint slide show. This is a key performance indicators template 3 powerpoint slide show. This is four stage process. The stages in this process are area of focus, metrics, targets, objectives, vision and strategy, objective, measures, targets, invites.
-
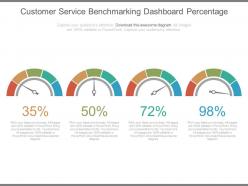 79058532 style essentials 2 dashboard 4 piece powerpoint presentation diagram infographic slide
This PPT slide can be used by anyone looking to project their Customer Service Bench marking related ideas. This PowerPoint template is 100% editable, which means text, color, and shapes of the given elements can be altered according to your liking. These slides are also compatible with Google slides. You can edit the text section to write a short brief about the process.The stages in this process are finance, marketing, strategy, business.
-
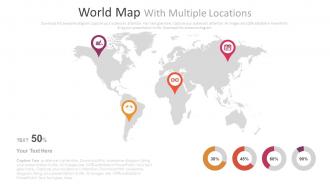 59907663 style essentials 2 dashboard 4 piece powerpoint presentation diagram infographic slide
Use of pixel friendly images and icons. Replace the images and icons with a variety of icons available on site. Add your company name or logo in the background. Edit the business text information while replacing the dummy content. Use perfectly with the Google Slides. Ready to use template icon. Used by the business leaders and the management people.
-
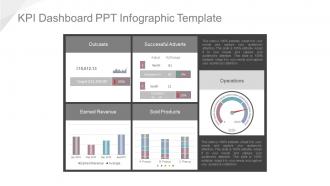 54039612 style essentials 2 dashboard 4 piece powerpoint presentation diagram template slide
Presenting kpi dashboard ppt infographic template. This is a Kpi Dashboard Ppt Infographic Template. This is a four stage. The Stages in this process are outcasts, successful adverts, earned revenue, sold products, operations.
-
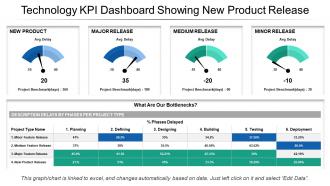 26578383 style essentials 2 dashboard 4 piece powerpoint presentation diagram infographic slide
Delivering technology KPI dashboard new product release PowerPoint design. Presentation template goes well with Google slides. PPT slide is adaptable with maximum number of software i.e. JPG and PDF. Great picture quality PowerPoint graphic comes with high resolution picture as pixels never break even on wide screen. Choice includes business information such as name, logo and tagline. Fully amendable Presentation diagram comes with editable options. PPT design is easy to download and save for later use.
-
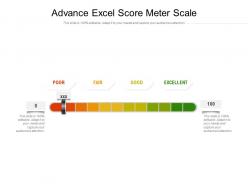 Advance excel score meter scale
Presenting our Advance Excel Score Meter Scale PowerPoint Presentation Slide. This is a completely adaptable PPT slide that allows you to add images, charts, icons, tables, and animation effects according to your requirements. Create and edit your text in this 100% customizable slide. You can change the orientation of any element in your presentation according to your liking. The slide is available in both 4:3 and 16:9 aspect ratios. This PPT presentation is also compatible with Google Slides.
-
 32280063 style essentials 2 dashboard 4 piece powerpoint presentation diagram infographic slide
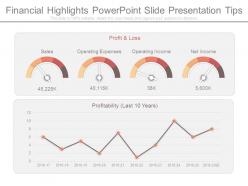
Presenting financial highlights powerpoint slide presentation tips. This is a financial highlights powerpoint slide presentation tips. This is a four stage process. The stages in this process are sales, operating expenses, operating income, net income, profitability.
-
 50373517 style essentials 2 dashboard 4 piece powerpoint presentation diagram infographic slide
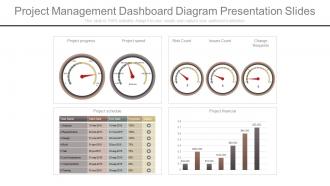
Completely editable project management dashboard diagram presentation slide for business professionals, students, professors, researchers, etc. Professional use of colors and editable charts. PPT template is fully editable to allow customization for font, text, colors, etc. Simple to download and convert into PDF format. Compatible with number of software options. Personalize the presentation with individual company name and logo. Excellence in picture quality. Presentation design can be displayed in standard and widescreen view.The stages in this process are project progress, project spend and much more.
-
 22301927 style essentials 2 dashboard 4 piece powerpoint presentation diagram infographic slide
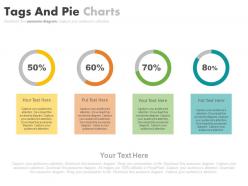
Presenting four staged tags and pie charts percentage analysis powerpoint slides. This Power Point template slide has been crafted with graphic of four staged tags and pie charts. This PPT slide contains the concept of percentage analysis. Use this PPT slide for business and marketing related presentations.
-
 55198601 style essentials 2 dashboard 4 piece powerpoint presentation diagram infographic slide
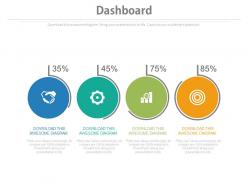
Recognized quality pictures utilized. Can shape a vital piece of various business points’ presentation. Utilization of splendid hues ensures dynamic quality in introduction. Gives an expert standpoint to your PowerPoint introduction. High determination of PPT symbols guarantees bother free projection on wide screen. Perfect with different programming alternatives accessible both on the web and disconnected. Benefitted for business analyst, finance executives, sales professionals, educational institutes etc.
-
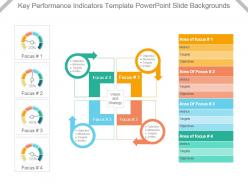 19902345 style essentials 2 dashboard 4 piece powerpoint presentation diagram infographic slide
Excellent use colors in the presentation template. Imaginatively created PowerPoint shape with modification options. Easily adjustable PPT slide as can be converted into JPG and PDF format. Conforming designs accessible to different nodes and stages. Great pixel quality as image quality remains relentless on every screen size. Choice to reveal slide in standard 4:3 widescreen 16:9 view. Presentation graphic suitable with Google slides. Fast download saves valuable time. Makes it easier to share the information with ease with large set of viewers. Easy to portray the KRAs related to the work.
-
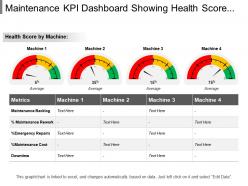 83427113 style essentials 2 dashboard 4 piece powerpoint presentation diagram infographic slide
Presenting maintenance KPI dashboard showing health score by machine PowerPoint slide. This PPT slide offers you plenty of space to put in titles and sub titles. High resolution based presentation layout, does not change the image even after resizing. This presentation icon is fully compatible with Google slides. Quickly downloads and simple editing options in color text and fonts. Can easily be changed into JPEG and PDF applications. This diagram has been designed for entrepreneurs, corporate and business managers.
-
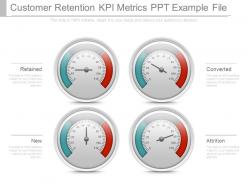 3509056 style essentials 2 dashboard 4 piece powerpoint presentation diagram infographic slide
Presenting customer retention kpi metrics ppt example file. This is a customer retention kpi metrics ppt example file. This is a four stage process. The stages in this process are retained, converted, new, attrition.
-
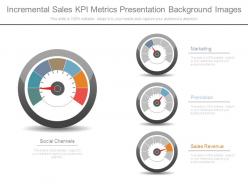 45304085 style essentials 2 dashboard 4 piece powerpoint presentation diagram infographic slide
Presenting incremental sales kpi metrics presentation background images. This is a incremental sales kpi metrics presentation background images. This is a four stage process. The stages in this process are social channels, marketing, promotion, sales revenue.
-
 90019954 style essentials 2 dashboard 4 piece powerpoint presentation diagram infographic slide
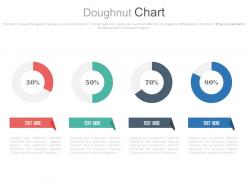
Presenting four doughnut chart with percentage analysis powerpoint slides. This Power Point template slide has been crafted with graphic of four doughnut chart and percentage diagram. This PPT slide contains the concept of financial data analysis. Use this PPT slide for business and finance related presentations.
-
 88978325 style essentials 2 dashboard 4 piece powerpoint presentation diagram infographic slide
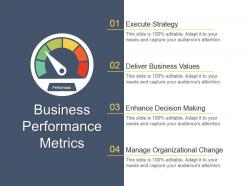
Presenting business performance metrics powerpoint ideas. This is a business performance metrics powerpoint ideas. This is a four stage process. The stages in this process are execute strategy, deliver business values, enhance decision making, manage organizational change.
-
 56884969 style essentials 2 dashboard 4 piece powerpoint presentation diagram template slide
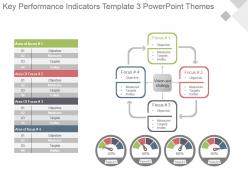
Presenting key performance indicators template 3 powerpoint themes. This is a key performance indicators template 3 powerpoint themes. This is a four stage process. The stages in this process are objective, measures, targets, invites.
-
 3060697 style essentials 2 dashboard 4 piece powerpoint presentation diagram infographic slide
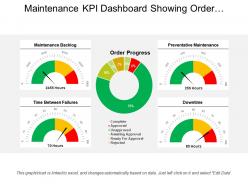
Presenting our maintenance KPI dashboard showing order progress and backlog. This PPT slide offers you plenty of space to put in titles and sub titles. High resolution-based presentation layout, does not change the image even after resizing. This presentation icon is data driven and template can be downloaded via excel file to incorporate data. Quick downloading speed and simple editing options in color text and fonts.PPT icons can easily be changed into JPEG and PDF applications.
-
 75757132 style essentials 2 dashboard 4 piece powerpoint presentation diagram infographic slide
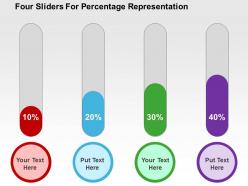
We are proud to present our four sliders for percentage representation flat powerpoint design. This power point template diagram has been crafted with graphic of four sliders and percentage. This PPT diagram contains the concept of financial analysis. Use this PPT diagram for business and finance related presentations.
-
 8324015 style essentials 2 dashboard 4 piece powerpoint presentation diagram infographic slide
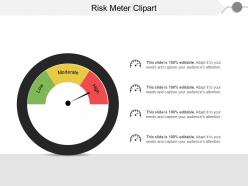
Presenting this set of slides with name - Risk Meter Clipart. This is a four stage process. The stages in this process are Risk Meter, Risk Speedometer, Hazard Meter.
-
 62671770 style linear single 4 piece powerpoint presentation diagram infographic slide
Presenting human resource kpi dashboard presentation visuals. This is a human resource kpi dashboard presentation visuals. This is a four stage process. The stages in this process are employee turnover,recruiting,retention,development.
-
 29029212 style essentials 2 dashboard 4 piece powerpoint presentation diagram infographic slide
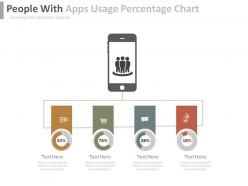
Useful for start-ups in the app business. Potential for use as a marketing device. PPT icons highly alterable. Change icon colors and size at your will and according to target audience. Aesthetic Infographics with proportionate placement of elements. Ability to view Presentation slides in widescreen. Straightforward conversion to JPG and PDF formats. Slides compatible with google slides.
-
 75837940 style essentials 2 dashboard 4 piece powerpoint presentation diagram infographic slide
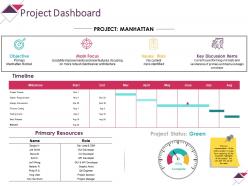
Presenting this set of slides with name - Project Dashboard Powerpoint Slide Influencers. This is a four stage process. The stages in this process are Main Focus, Objective, Issues Risks, Key Discussion Items, Dashboard.
-
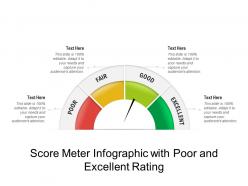 Score meter infographic with poor and excellent rating
Presenting our Score Meter Infographic With Poor And Excellent Rating PowerPoint Presentation Slide. It is completely editable and adaptable according to requirements. Take advantage of this professionally created PPT design that allows you to add or edit any text, image, and graph to your presentation making it more attractive and educational. It can also be presented with a different color, font, font size, and font types. The entire shape and appearance of the objects can be changed in this PPT layout. This template also supports standard (4:3) and widescreen (16:9) format. It presents you with thousands of icons for your topic to choose from. This template is also compatible with Google Slides.
-
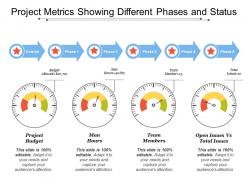 55816198 style essentials 2 dashboard 4 piece powerpoint presentation diagram infographic slide
Presenting this set of slides with name - Project Metrics Showing Different Phases And Status. This is a four stage process. The stages in this process are Project Kpis, Project Dashboard, Project Metrics.
-
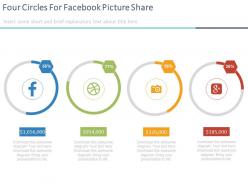 14858728 style essentials 2 dashboard 4 piece powerpoint presentation diagram infographic slide
Very useful for small and large businesses. Highly impactful and Customizable text, color, images and infographics. Crisp PPT Presentation examples giving you the ability to amend its features for specific use. PPT example slides fully compatible with google slides. Easy to comprehend, user friendly Infographics for impact. Option to view PPT sample slide in widescreen. Convert slides to JPG and PDF easily.
-
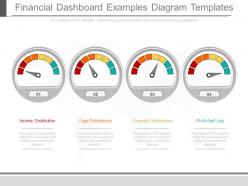 71417379 style essentials 2 dashboard 4 piece powerpoint presentation diagram infographic slide
Presenting apt financial dashboard examples diagram templates. This is a financial dashboard examples diagram templates. This is a four stage process. The stages in this process are income distribution, cogs distributions, expense distributions, profit and loss.
-
 31314893 style essentials 2 dashboard 4 piece powerpoint presentation diagram infographic slide
PPT slides are well-matched with Google slides. Multiple display options i.e. standard and widescreen view. 100% editable PowerPoint templates changing color, text and font is possible. Quick to download and share. Flexibility to convert into JPEG and PDF document. Perfect for business professionals, managers, executives, students etc.
-
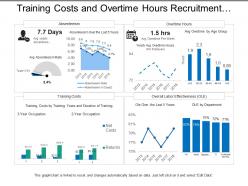 90454204 style essentials 2 financials 4 piece powerpoint presentation diagram infographic slide
Presenting this set of slides with name - Training Costs And Overtime Hours Recruitment Dashboard. This is a four stage process. The stages in this process are Staffing Plan, Recruitment, Staff Management.
-
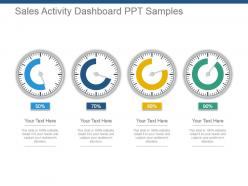 66989338 style essentials 2 dashboard 4 piece powerpoint presentation diagram infographic slide
Presenting sales activity dashboard snapshot ppt samples. This is a sales activity dashboard ppt samples. This is a four stage process. The stages in this process are sales, activity, dashboard, financial, strategy.
-
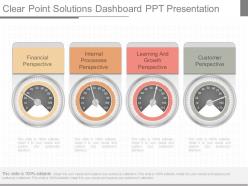 95999695 style essentials 2 dashboard 3 piece powerpoint presentation diagram infographic slide
Adjust the substance at your own solace and need. Customize it with your organization name and logo. Download and spare the introduction in wanted organization. Perfect with wide assortment of on the web and disconnected programming choices. Plenty of professionally made slides. Completely editable PowerPoint introduction. Material by human asset branch of a few associations alongside business people and administrative understudies.The stages in this process are financial perspective, internal processes perspective, learning and growth perspective, customer perspective.
-
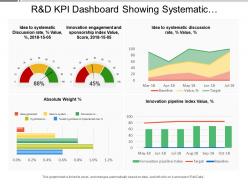 33223190 style essentials 2 financials 4 piece powerpoint presentation diagram infographic slide
Presenting this set of slides with name - R And D Kpi Dashboard Showing Systematic Discussion Rate Innovation Engagement And Sponsorship Index. This is a four stage process. The stages in this process are R And D, Research And Development, Research And Technological Development.
-
 58164589 style essentials 2 dashboard 4 piece powerpoint presentation diagram infographic slide
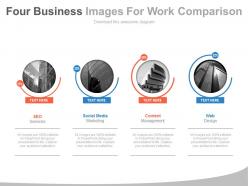
Completely editable PowerPoint slides including fonts, text, colors. Presentation design can be displayed in standard and widescreen view. PPT template is fully editable to allow customization. Simple to download and convert into PDF format. Suitable for small and large scale organizations. Compatible with number of software options. Personalize the presentation with individual company name and logo. Excellence in picture quality. Suitable for research and development team, business planners, corporate team leaders and managers.
-
 63584971 style layered vertical 4 piece powerpoint presentation diagram infographic slide
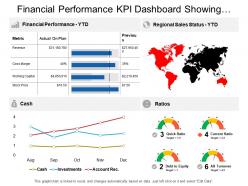
Presenting this set of slides with name - Financial Performance Kpi Dashboard Showing Regional Sales Status Cash And Ratios. This is a four stage process. The stages in this process are Financial Performance, Financial Report, Financial Review.
-
 55942853 style essentials 2 dashboard 4 piece powerpoint presentation diagram infographic slide
Well-crafted and professionally equipped PowerPoint visual. Ease of editing every component of the PPT template. Guidance for executing the changes has been provided for assistance. Modify and personalize the presentation by including the company name and logo. Compatible with varied number of format options. Compatible with multiple software options available both online and offline. Perfect for business strategists, sales and marketing team, customer service team and entrepreneurs.
-
 65250728 style essentials 2 dashboard 4 piece powerpoint presentation diagram infographic slide
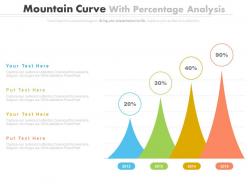
Great tool for various purposes especially businesses having strategic goals. Handy in Schools, Universities and other professional organisation. Hassle free PPT design templates. View in widescreen for maximum benefit. Compatible with google slides. Convert slide to JPG and PDF formats. Make use of icons library to change icons according to your needs. Change aspects like colors, Icon shape and size etc.
-
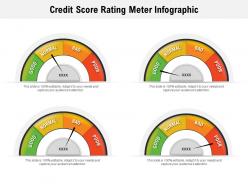 Credit score rating meter infographic
Presenting Credit Score Rating Meter Infographic slide. This PPT supports both the standard(4:3) and widescreen(16:9) sizes. This presentation is very easy to download and can be converted into numerous images or document formats including JPEG, PNG, or PDF. It is also compatible with Google Slides and editable in PowerPoint. Alter the style, size, color, background, and other attributes according to your requirements. Moreover, high-quality images prevent the lowering of quality.
-
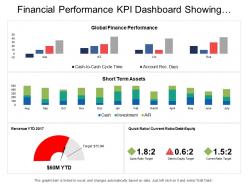 40266992 style concepts 1 growth 4 piece powerpoint presentation diagram infographic slide
Presenting this set of slides with name - Financial Performance Kpi Dashboard Showing Revenue Quick Ratio Short Term Assets. This is a four stage process. The stages in this process are Financial Performance, Financial Report, Financial Review.
-
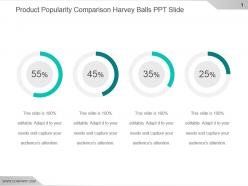 43722849 style essentials 2 dashboard 4 piece powerpoint presentation diagram infographic slide
Presenting product popularity comparison harvey balls ppt slide. This is a product popularity comparison harvey balls ppt slide. This is a four stage process. The stages in this process are business, percentage, finance, marketing, strategy, success.
-
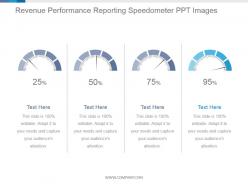 91057285 style essentials 2 dashboard 4 piece powerpoint presentation diagram infographic slide
Presenting revenue performance reporting speedometer ppt images. This is a revenue performance reporting speedometer ppt images. This is a four stage process. The stages in this process are dashboard, measure, percentage, business, marketing.
-
 41185557 style essentials 2 dashboard 4 piece powerpoint presentation diagram infographic slide
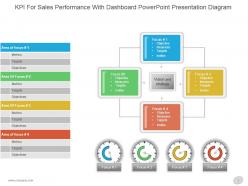
Presenting kpi for sales performance with dashboard powerpoint presentation diagram. This is a kpi for sales performance with dashboard powerpoint presentation diagram. This is a four stage process. The stages in this process are area of focus, metrics, objectives, focus, objective, measures, targets, invites, vision and strategy.
-
 22751670 style essentials 2 dashboard 4 piece powerpoint presentation diagram template slide
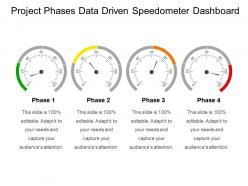
Presenting project phases data driven speedometer dashboard. This is a project phases data driven speedometer dashboard snapshot. This is a four stage process. The stages in this process are project phases templates, project steps, project methods.
-
 73879690 style essentials 2 dashboard 4 piece powerpoint presentation diagram infographic slide
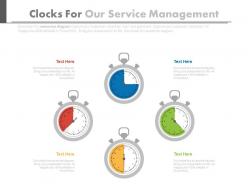
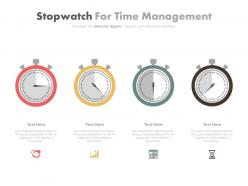
Presenting four stopwatch for time management powerpoint slides. This Power Point template diagram slide has been crafted with graphic of four stopwatches. This PPT diagram contains the concept of time management representation. Use this PPT diagram for business and management related presentations.
-
 45944478 style essentials 2 dashboard 4 piece powerpoint presentation diagram infographic slide
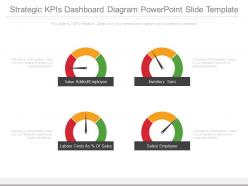
Presenting strategic kpis dashboard snapshot diagram powerpoint slide template. This is a strategic kpis dashboard diagram powerpoint slide template. This is a four stage process. The stages in this process are value added employee, inventory turn, sales employee, labour costs as of sales.
-
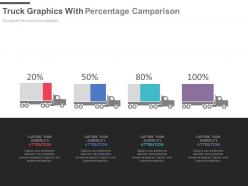 19483160 style essentials 2 compare 4 piece powerpoint presentation diagram infographic slide
The slides transmit a powerful display quality impacting an everlasting impression. Download the slide info graphics in various file formats (JPEG, JPG, PDF.) Play the slides in Google slides as a convenient measure. Transform the slide as per your own suitability in terms of colour and size adjustment. Position the graphics accordingly to recast its outlook. The watermark of Slide Team is easily removable.
-
 58624038 style essentials 2 dashboard 4 piece powerpoint presentation diagram template slide
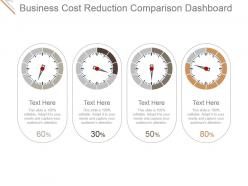
Presenting business cost reduction comparison dashboard ppt ideas. This is a business cost reduction comparison dashboard snapshot ppt ideas. This is a four stage process. The stages in this process are business, meter, measure, reduction, cost.
-
 Economic impact of covid 19 on different sectors of india ppt powerpoint presentation icon
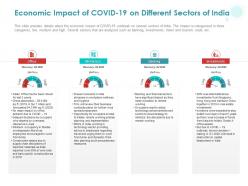
This slide provides details about the economic impact of COVID 19 outbreak on several sectors of India. The impact is categorized in three categories, low, medium and high. Several sectors that are analyzed such as banking, investments, travel and tourism, retail, etc. Presenting this set of slides with name Economic Impact Of COVID 19 On Different Sectors Of India Ppt Powerpoint Presentation Icon. This is a four stage process. The stages in this process are Office, Workplace, Banking, Investments. This is a completely editable PowerPoint presentation and is available for immediate download. Download now and impress your audience.
-
 4445233 style essentials 2 dashboard 4 piece powerpoint presentation diagram template slide
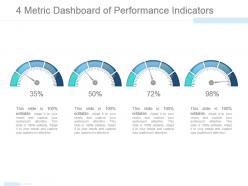
Presenting 4 metric dashboard of performance indicators example of ppt. This is a 4 metric dashboard of performance indicators example of ppt. This is a four stage process. The stages in this process are dashboard, finance, percentage, business, marketing.
-
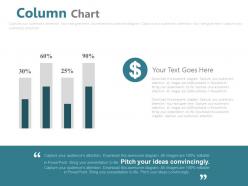 94044946 style essentials 2 dashboard 4 piece powerpoint presentation diagram infographic slide
This PPT Template can be used by any employees for representing business and finance related presentations. All these icons and elements used here are 100% editable in terms of color, size, and orientation of the elements mentioned in the slides. These PPT slides are compatible with Google slides and can be edited in any PowerPoint software.
-
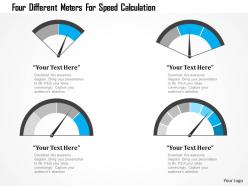 93921386 style essentials 2 dashboard 4 piece powerpoint presentation diagram infographic slide
Proofing and editing can be done with ease in PPT design. Presentation slide is of utmost use to management professionals, big or small organizations and business startups. Smooth functioning is ensured by the presentation slide show on all software’s. When projected on the wide screen the PPT layout does not sacrifice on pixels or color resolution.
-
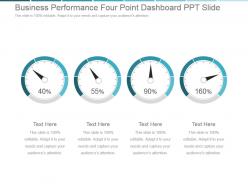 70421303 style essentials 2 dashboard 4 piece powerpoint presentation diagram infographic slide
Presenting business performance four point dashboard snapshot ppt slide. This is a business performance four point dashboard ppt slide. This is a four stage process. The stages in this process are business, success, dashboard, finance, strategy.
-
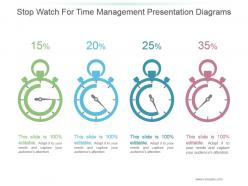 27949794 style essentials 2 dashboard 4 piece powerpoint presentation diagram infographic slide
Presenting stop watch for time management presentation diagrams. This is a stop watch for time management presentation diagrams. This is a four stage process. The stages in this process are business, marketing, stopwatch, management, presentation.
-
 66914169 style essentials 2 dashboard 4 piece powerpoint presentation diagram infographic slide
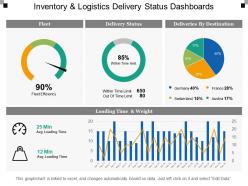
Presenting this set of slides with name - Inventory And Logistics Delivery Status Dashboards. This is a four stage process. The stages in this process are Inventory And Logistics, Inventory Management, Warehousing And Inventory Management.
-
 77315625 style essentials 2 dashboard 4 piece powerpoint presentation diagram infographic slide
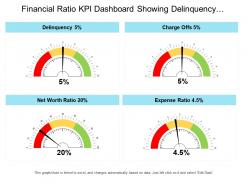
Presenting this set of slides with name - Financial Ratio Kpi Dashboard Snapshot Showing Delinquency Charge Offs And Net Worth Ratio. This is a four stage process. The stages in this process are Accounting Ratio, Financial Statement, Financial Ratio.


