Collection of 5 Dashboard Essentials PowerPoint PPT Templates
-
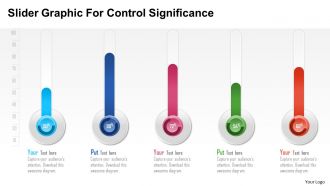 225702 style essentials 2 dashboard 5 piece powerpoint presentation diagram infographic slide
We are proud to present our slider graphic for control significance powerpoint template. Graphic of slider has been used to craft this power point template. This PPT diagram contains the concept of control. Use this PPT diagram for business and marketing related presentations.
-
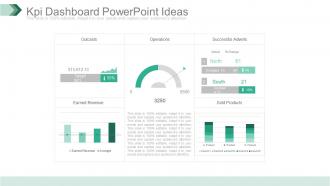 73555808 style essentials 2 dashboard 5 piece powerpoint presentation diagram template slide
Fabulously composed PPT design useful for business professionals, organizational experts or researchers , students and many more from diverse areas , Comprehensive and convenient PPT Images with ductile dummy data options, Consonant with all available graphic software’s and Google slides, Accessible to other file configurations like PDF or JPG. Multi-color options, background images, styles and other characteristics are fully editable, Expeditious downloading process, Allows to introduce your company logo or brand name in the PPT slides.
-
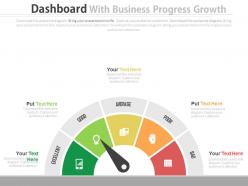 63627068 style essentials 2 dashboard 5 piece powerpoint presentation diagram infographic slide
Professionally crafted PPT slides for professional users. Editable PowerPoint diagrams and illustrations. Privilege of insertion of logo and trademarks for more personalization. Presentable and easy to comprehend info graphic format. Adaptable to wide screen view without the problem of pixilation. The presentation template can be downloaded and saved in any desired format. Perfect for business analyst, developers, digital marketing professionals, sales team, students etc.
-
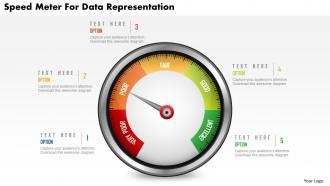 35202737 style essentials 2 dashboard 5 piece powerpoint presentation diagram infographic slide
We are proud to present our speed meter for data representation powerpoint template. Graphic of speed meter has been used to design this power point template. This PPT diagram contains the concept of data representation. Use this PPT diagram for data related presentations.
-
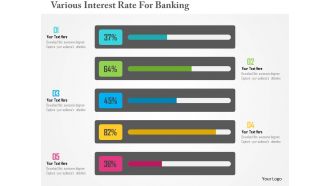 16641870 style variety 3 measure 5 piece powerpoint presentation diagram infographic slide
Adjustable presentation diagram as can be displayed in standard and widescreen view. PowerPoint templates are well-attuned with Google slides. Effortlessly editable PPT slides as editing possible with color, text and font. Alike presentation slides available with different nodes and stages. Download is fast and can be easily share with large audience. Flexible design as can be transformed into JPEG and PDF document.
-
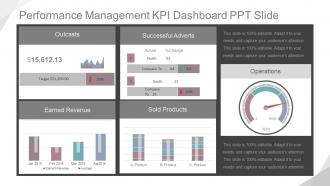 7937074 style essentials 2 dashboard 5 piece powerpoint presentation diagram infographic slide
Presenting performance management kpi dashboard snapshot ppt slide. This is a performance management kpi dashboard ppt slide. This is a five stage process. The stages in this process are product, sold products, compare to, south, north, actual, change, successful adverts, jan, feb, mar, apr, earned revenue, average, target, outcasts, operations.
-
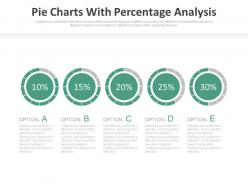 68794265 style essentials 2 dashboard 5 piece powerpoint presentation diagram infographic slide
Capture the interest of your audience with a vibrant showcase of supreme quality visuals. Customize on the colour part, orientation scheme, and size restructuring to cast a suitable interface of the slide. Play it on Google Slides with a convenient download option in multiple file formats. Utilize the ample text space for an explanatory write-up. A complete user guide follows the slide for easy transformation.
-
 4163565 style essentials 2 dashboard 5 piece powerpoint presentation diagram infographic slide
Ready made PPT graphic helps in saving time and effort. Include or exclude slide content as per your individual need. Colors, visuals and text can be easily changed as the PPT slide is completely editable. Personalize the presentation with individual company name and logo. This PPT Slide is available in both Standard and Widescreen slide size. Easy and quick downloading process. Flexible option for conversion in PDF or JPG formats. Compatible with Google slides.
-
 70094834 style essentials 2 financials 5 piece powerpoint presentation diagram infographic slide
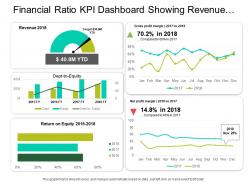
Presenting this set of slides with name - Financial Ratio Kpi Dashboard Showing Revenue Net Profit Margin And Debt To Equity. This is a five stage process. The stages in this process are Accounting Ratio, Financial Statement, Financial Ratio.
-
 6602301 style essentials 2 dashboard 5 piece powerpoint presentation diagram infographic slide
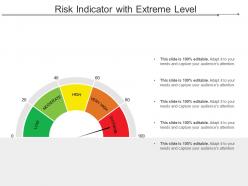
Presenting this set of slides with name - Risk Indicator With Extreme Level. This is a five stage process. The stages in this process are Risk Meter, Risk Speedometer, Hazard Meter.
-
 76244282 style essentials 2 dashboard 5 piece powerpoint presentation diagram infographic slide
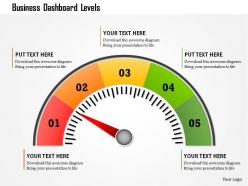
We are proud to present our 1214 business dashboard levels powerpoint presentation. Colored meter with multiple levels has been used to craft this power point template. This PPT contains the concept of measurement. Use this PPT for your measurement related presentations.
-
 46870140 style essentials 2 dashboard 5 piece powerpoint presentation diagram infographic slide
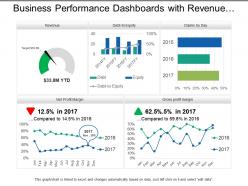
Presenting, our business performance dashboards with revenue and ratios PPT deck. Pre-designed chart sheet directed PowerPoint Presentation template. Administration of high-resolution images, graphs, and comparison diagrams. Filled with methods and effects to create an impact. Can be quickly converted into JPEG/JPG or PDF formats as per the requirements. Congenial with Google Slides for ease. Project to widescreen without cringing about pixelating, after downloading explore these characteristics.
-
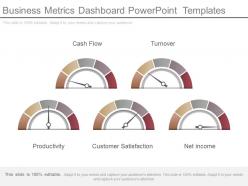 74149678 style essentials 2 dashboard 5 piece powerpoint presentation diagram infographic slide
Presenting business metrics dashboard PowerPoint templates. Simple to use PowerPoint template layout Demonstrate it with professional details name and image of the establishment. Text, font, colors and orientation can be transformed as per the preference. Familiar with software’s such as JPG and PDF and also with Google slides. Genuine high resolution PPT slide stays even after customization. Easy to download and share at any location. Hundred percent editable Presentation graphic is available with different portray options i.e. standard and widescreen view.
-
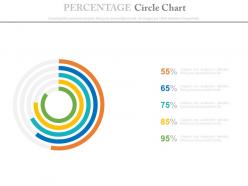 1705267 style essentials 2 dashboard 5 piece powerpoint presentation diagram infographic slide
High resolution PPT example for Technology Vision. Wide screen projection does not affect the output adversely. Easy to edit and customize colorful PPT graphics. Precise and easy to comprehend information on PPT sample. Increase the level of personalization with your company logo and name. Compatible with all software and can be saved in any format. Useful for business analysts, finance experts, accounts specialists, sales team.
-
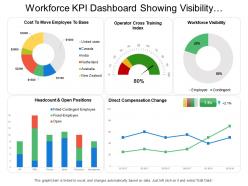 6070909 style essentials 2 financials 5 piece powerpoint presentation diagram infographic slide
Presenting this set of slides with name - Workforce Kpi Dashboard Showing Visibility Headcount And Direct Compensation Change. This is a five stage process. The stages in this process are Staff, Personnel, Workforce.
-
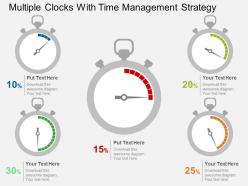
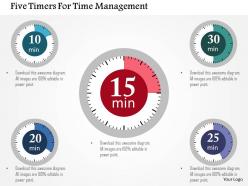 87893299 style essentials 2 dashboard 5 piece powerpoint presentation diagram infographic slide
We are proud to present our five timers for time management flat powerpoint design. Graphic of five timers has been used to craft this power point template diagram. This PPT diagram contains the concept of time management. Use this PPT diagram for management and business related presentation.
-
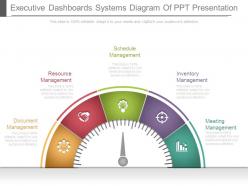 71735785 style circular semi 5 piece powerpoint presentation diagram infographic slide
Amazing executive dashboards systems diagram PPT Graphic. Multiple options to display in standard or in widescreen view. Text, font, colors and orientation can be easily changes as per your business requirements. Unaffected High resolution PPT slides even after customization. Well compatible with all the software’s and Google slides. Convertible into PDF or JPG formats. Useful for business executives, politicians, corporate leaders, students, professors, etc. Personalize it with company name and logo of your own.The stages in this process are document management and much more.
-
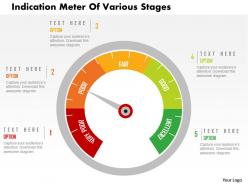 85446677 style essentials 2 dashboard 5 piece powerpoint presentation diagram infographic slide
We are proud to present our indication meter of various stages flat powerpoint design. Graphic of indication meter has been used to craft this power point template diagram. This PPT diagram contains the concept of control indication. Use this PPT diagram for business and technology related presentations.
-
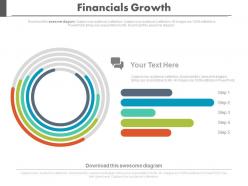 12697599 style essentials 2 dashboard 5 piece powerpoint presentation diagram template slide
The Ppt templates are adaptive to the customization of colour change, placement, and restructuring of the graphics. A grand display is promised with a high-resolution quality. Download the ppt diagram in multiple file formats (JPEG, JPEG, and PDF). The slides are congruous to Google slides. Fill in the text and other specifications of the organization at a few clicks.
-
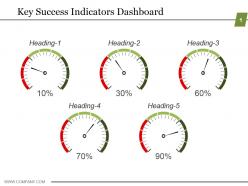 56486438 style essentials 2 dashboard 5 piece powerpoint presentation diagram infographic slide
Presenting key success indicators dashboard PowerPoint slide show. Totally flexible PowerPoint format as hues, symbols, and content can be change according to the need. Alter the template slide with brand name, insignia, slogan or some other component. Ease of download and simple to change over into programming projects, for example, JPEG and PDF. You can download the template with different stages and nodes. When projected on broad screen, image graphics quality does not get harm.
-
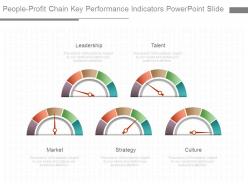 69130835 style essentials 2 dashboard 5 piece powerpoint presentation diagram infographic slide
Stunning people profit chain key indicators performance PPT template. Modify and personalize the presentation by including the company name and logo. Guidance for executing the changes has been provided for assistance. Easy and convenient downloading by following simple steps. Professional and business oriented PPT presentation slides. No concession with the quality, once opened on wide screen. Editable visuals, colors and text. Useful for sales leaders, marketers, business professionals, analysts, strategists, etc. Can be presented in both standard and widescreen view.
-
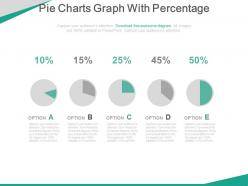 90294610 style essentials 2 dashboard 5 piece powerpoint presentation diagram infographic slide
Icons can be resized and colored. Color, style and position can be standardized, supports font size which can be read from a distance. PPT slide is compatible with Microsoft 2010 and 2013 versions. Beneficial for businessman, representatives of big or small organizations for setting the business or meeting agendas for analysis. Background in PPT graphic is subtle and consistent to avoid presentation look flashy or vibrant.
-
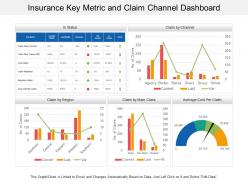 5010124 style essentials 2 financials 5 piece powerpoint presentation diagram infographic slide
• Easy to customize. • Easy to replace any words, picture or number provided in the template with your own content and use it for presentation. • Freedom to incorporate your own company’s name and logo in the presentation for personalization. • The PPT visuals used are of high resolution. • No issue of image pixilation if projected on wide screen. • Compatibility with numerous format and software options. • Widely used by marketers, businessmen, insurance managers and educators.
-
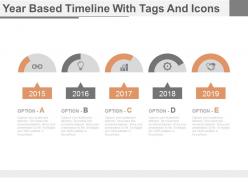 41886231 style essentials 2 dashboard 5 piece powerpoint presentation diagram infographic slide
Highly customizable slides catering to businessmen and working professionals alike. Easily compatible with google slides for ease of access. PPT templates available in widescreen for different viewing platforms. Facility to convert the slides into PDF or JPG formats. To the point data with appropriate use of highly stylized tags and icons. Neat presentation visuals depicting year by year progress.
-
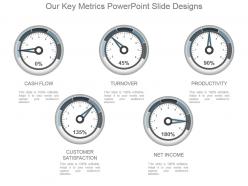 35570286 style essentials 2 dashboard 5 piece powerpoint presentation diagram infographic slide
Presenting our key metrics PowerPoint slide designs. This power point slide offers you plenty of space to put in titles and sub titles. High resolution-based presentation layout does not change the image even after resizing. This presentation icon is fully compatible with Google slides. Quick downloading speed and simple editing options in color text and fonts.PPT icons can easily be changed into JPEG and PDF applications. This diagram has been designed for entrepreneurs, corporate and business managers.
-
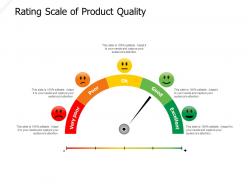 Rating scale of product quality
Presenting this set of slides with name Rating Scale Of Product Quality. This is a five stage process. The stages in this process are Product Improvement, Rating Scale, Product Quality. This is a completely editable PowerPoint presentation and is available for immediate download. Download now and impress your audience.
-
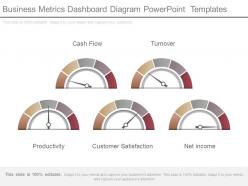 50419697 style essentials 2 dashboard 5 piece powerpoint presentation diagram infographic slide
Presenting business metrics dashboard diagram powerpoint templates. This is a business metrics dashboard diagram powerpoint templates. This is a five stage process. The stages in this process are cash flow, turnover, productivity, customer satisfaction, net income.
-
 65385101 style concepts 1 decline 5 piece powerpoint presentation diagram infographic slide
We are proud to present our sequence of thermometer for result analysis flat powerpoint design. This power point template diagram has been crafted with graphic of thermometer in sequence. This PPT diagram contains the concept of business result analysis. Use this PPT diagram for business and medical presentations.
-
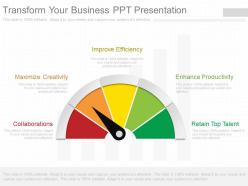 95366782 style essentials 2 dashboard 5 piece powerpoint presentation diagram infographic slide
Presentation icon supports the use of color, size and orientation according to one’s requirement. PPT design is in tune with 32 or 64 bit windows and MAC OS. Predesigned symbols and text holders well braced by PPT graphic. Friendly design used by businessmen and professionals. No additional software, application or Photoshop required for editing the PPT slide.The stages in this process are collaborations, maximize creativity, improve efficiency, enhance productivity, retain top talent.
-
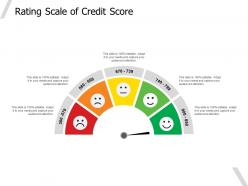 Rating scale of credit score
Presenting this set of slides with name Rating Scale Of Credit Score. This is a five stage process. The stages in this process are Product Improvement, Rating Scale, Product Quality. This is a completely editable PowerPoint presentation and is available for immediate download. Download now and impress your audience.
-
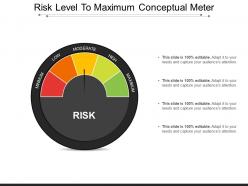 24179247 style essentials 2 dashboard 5 piece powerpoint presentation diagram infographic slide
Presenting this set of slides with name - Risk Level To Maximum Conceptual Meter. This is a five stage process. The stages in this process are Risk Meter, Risk Speedometer, Hazard Meter.
-
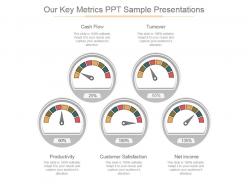 94425376 style essentials 2 dashboard 5 piece powerpoint presentation diagram infographic slide
Presenting our key metrics ppt sample presentations. This is a our key metrics ppt sample presentations. This is a five stage process. The stages in this process are cash flow, turnover, net income, customer satisfaction, productivity.
-
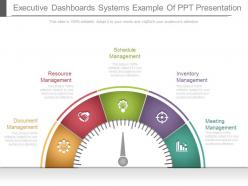 73268501 style essentials 2 dashboard 5 piece powerpoint presentation diagram infographic slide
Presenting executive dashboards systems example of ppt presentation. This is a executive dashboards systems example of ppt presentation. This is a five stage process. The stages in this process are document management, resource management, schedule management, inventory management, meeting management.
-
 5396121 style essentials 2 dashboard 5 piece powerpoint presentation diagram infographic slide
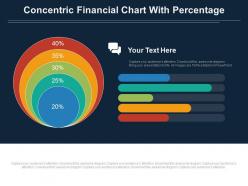
The graphics present a flamboyant projection delivering utmost clarity. The slides are compatible with the Google Slides and the multiple file formats are available to save the template post downloading. Explore the wide range of customization of its colors, orientation, and size scheme. Remove the watermark of Slide Team and insert the desired text, watermark and logo at few clicks.
-
 33997026 style essentials 2 dashboard 5 piece powerpoint presentation diagram infographic slide
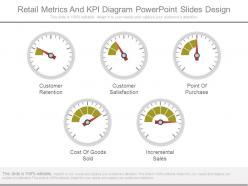
Presenting retail metrics and kpi diagram powerpoint slides design. This is a retail metrics and kpi diagram powerpoint slides design. This is a five stage process. The stages in this process are customer retention, customer satisfaction, point of purchase, cost of goods sold, incremental sales.
-
 85698852 style essentials 2 dashboard 5 piece powerpoint presentation diagram infographic slide
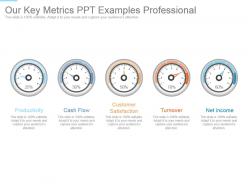
Presenting our key metrics ppt examples professional. This is a our key metrics ppt examples professional. This is a five stage process. The stages in this process are productivity, cash flow, customer satisfaction, turnover, net income.
-
 78946947 style essentials 2 financials 5 piece powerpoint presentation diagram infographic slide
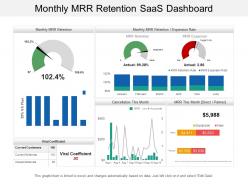
Offering monthly MRR retention Saas dashboard PPT template. Access to convert the presentation design into JPG and PDF. Offer 100% access to change the values, size and style of the slides once downloaded and saved in the desired format. High quality charts, images and visuals used in the designing process. Choice to get presentation slide in standard or in widescreen view. Easy to convert in JPEG and PDF document. Compatible with Google slides. Easy and hassle free downloading process.
-
 42411238 style essentials 2 financials 5 piece powerpoint presentation diagram infographic slide
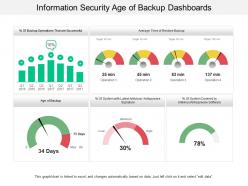
Presenting this set of slides with name - Information Security Age Of Backup Dashboards. This is a five stage process. The stages in this process are Information Security Strategy, Information Security Plan, Information Protection Strategy.
-
 42646223 style essentials 2 dashboard 5 piece powerpoint presentation diagram infographic slide
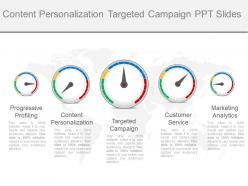
Presenting content personalization targeted campaign ppt slides. Presenting content personalization targeted campaign ppt slides. This is a content personalization targeted campaign ppt slides. This is a five stage process. The stages in this process are progressive profiling, content personalization, targeted campaign, customer service, marketing analytics.
-
 Key business metrics dashboard growth ppt powerpoint gallery slides
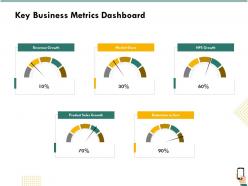
Presenting this set of slides with name Key Business Metrics Dashboard Snapshot Growth Ppt Powerpoint Gallery Slides. This is a five stage process. The stages in this process are Revenue Growth, Market Share, NPS Growth, Product Sales Growth, Reduction In Cost. This is a completely editable PowerPoint presentation and is available for immediate download. Download now and impress your audience.
-
 17848153 style concepts 1 growth 5 piece powerpoint presentation diagram infographic slide
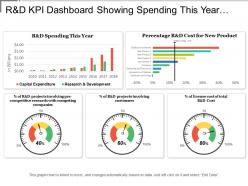
Presenting this set of slides with name - R And D Kpi Dashboard Showing Spending This Year And Cost For New Product. This is a five stage process. The stages in this process are R And D, Research And Development, Research And Technological Development.
-
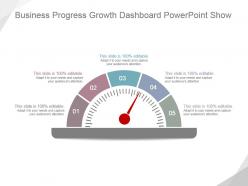 76064910 style essentials 2 dashboard 5 piece powerpoint presentation diagram template slide
Presenting business progress growth dashboard powerpoint show. This is a business progress growth dashboard powerpoint show. This is a five stage process. The stages in this process are business, marketing, dashboard, measure, management.
-
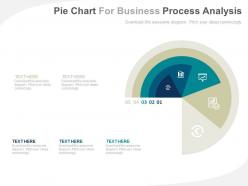 54210551 style essentials 2 dashboard 5 piece powerpoint presentation diagram infographic slide
PowerPoint slide templates assist business owners, managers and employees responsible for smooth management of organisation. View slides in widescreen and display them on any screen platform. Effortlessly convert slides into JPG and PDF with minimum effort. Templates compatible with Google Slides. Easily adjust icons according to your liking. Change colors and size of the icons. Add texts for summary.
-
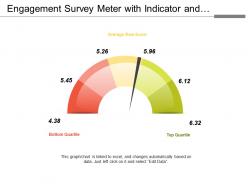 92770455 style essentials 2 dashboard 5 piece powerpoint presentation diagram infographic slide
Presenting this set of slides with name - Engagement Survey Meter With Indicator And Score. This is a five stage process. The stages in this process are Engagement Survey, Engagement Observation, Engagement View.
-
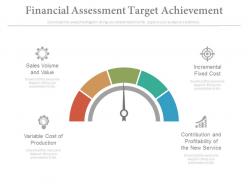 31539327 style circular semi 1 piece powerpoint presentation diagram infographic slide
Presenting financial assessment target achievement ppt slides. This is a financial assessment target achievement ppt slides. This is a one stage process. The stages in this process are finance, business, marketing, strategy.
-
 60511645 style essentials 2 financials 5 piece powerpoint presentation diagram infographic slide
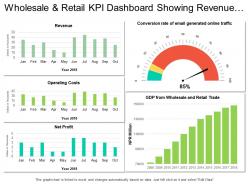
Presenting the KPI dashboard presentation template. This PowerPoint slide is fully editable in PowerPoint and is professionally designed. The user can bring changes to edit the objects in the slide like font size and font color without going through any hassle. This presentation slide is 100% compatible with Google Slide and can be saved in JPG or PDF file format without any fuss. Fast download this at the click of the button.
-
 74100949 style essentials 2 dashboard 5 piece powerpoint presentation diagram infographic slide
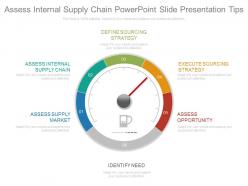
Presenting assess internal supply chain powerpoint slide presentation tips. Presenting assess internal supply chain powerpoint slide presentation tips. This is a assess internal supply chain powerpoint slide presentation tips. This is a five stage process. The stages in this process are define sourcing strategy, execute sourcing strategy, assess opportunity, assess internal supply chain, assess supply market.
-
 73572783 style essentials 2 dashboard 5 piece powerpoint presentation diagram infographic slide
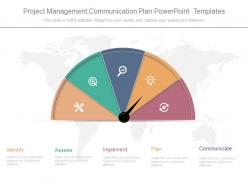
Presenting project management communication plan powerpoint templates. This is a project management communication plan powerpoint templates. This is a five stage process. The stages in this process are identify, assess, implement, plan, communicate.
-
 56976718 style essentials 2 dashboard 5 piece powerpoint presentation diagram infographic slide
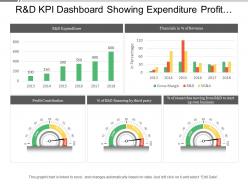
Presenting this set of slides with name - R And D Kpi Dashboard Showing Expenditure Profit Contribution And Financial In Percentage Of Revenue. This is a five stage process. The stages in this process are R And D, Research And Development, Research And Technological Development.
-
 30808582 style essentials 2 dashboard 5 piece powerpoint presentation diagram infographic slide
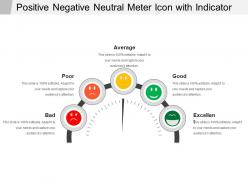
Presenting this set of slides with name - Positive Negative Neutral Meter Icon With Indicator. This is a five stage process. The stages in this process are Positive Negative Neutral Icon, Smile Happy Sad, Yes Sure Ugh.
-
 24151969 style essentials 2 dashboard 5 piece powerpoint presentation diagram infographic slide
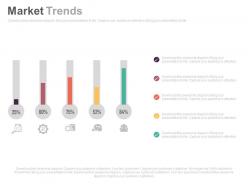
Presenting five staged market trends and percentage chart powerpoint slides. This Power Point template slide has been crafted with graphic of five staged market and percentage chart. This PPT slide contains the concept of financial analysis. Use this PPT slide for business and finance related presentations.
-
 66278074 style essentials 2 dashboard 5 piece powerpoint presentation diagram infographic slide
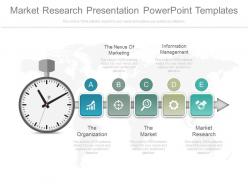
Presenting market research presentation powerpoint templates. Presenting market research presentation powerpoint templates. This is a market research presentation powerpoint templates. This is a five stage process. The stages in this process are the nexus of marketing, information management, the organization, the market, market research.
-
 Key business metrics dashboard m3407 ppt powerpoint presentation infographics design
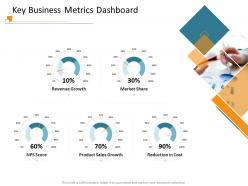
Presenting this set of slides with name Key Business Metrics Dashboard Snapshot M3407 Ppt Powerpoint Presentation Infographics Design. This is a five stage process. The stages in this process are Revenue Growth, Market Share, Product Sales Growth, Reduction In Cost. This is a completely editable PowerPoint presentation and is available for immediate download. Download now and impress your audience.
-
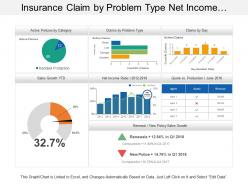 42309004 style essentials 2 financials 5 piece powerpoint presentation diagram infographic slide
Presenting this set of slides with name - Insurance Claim By Problem Type Net Income Ratio Dashboard. This is a five stage process. The stages in this process are Assurance, Surety, Insurance.
-
 33087376 style essentials 2 dashboard 5 piece powerpoint presentation diagram infographic slide
Presenting business team for about us detail of company powerpoint slides. This Power Point template diagram slide has been crafted with graphic of business team. This PPT diagram contains the concept of business about us detail representation. Use this PPT diagram for business and finance related presentations.
-
 71254905 style essentials 2 dashboard 5 piece powerpoint presentation diagram template slide
Presenting five business peoples for skill assessment powerpoint slides. This Power Point template slide has been crafted with graphic of five business peoples. This PPT slide contains the concept of skill assessment. Use this PPT slide for business and marketing related presentations.
-
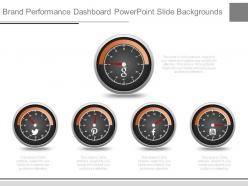 52386514 style essentials 2 dashboard 5 piece powerpoint presentation diagram infographic slide
Presenting brand performance dashboard powerpoint slide backgrounds. This is a brand performance dashboard powerpoint slide backgrounds. This is a five stage process. The stages in this process are dashboard, strategy, business, marketing.
-
 53934733 style essentials 2 financials 3 piece powerpoint presentation diagram infographic slide
Presenting kpis and operations dashboard snapshot presentation powerpoint example. This is a kpis and operations dashboard presentation powerpoint example. This is a three stage process. The stages in this process are operations, revenue, manufacturing.
-
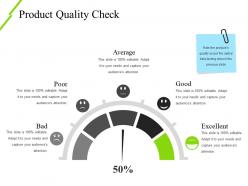 7992816 style essentials 2 dashboard 5 piece powerpoint presentation diagram infographic slide
Presenting the Product Quality Check PPT Slide template. The slide is fully editable in PowerPoint and other office suites. Alter the font style, font color, and other attributes within seconds. The PPT is compatible with Google Slides. Convert this template into numerous images or document formats like JPEG or PDF. High-quality graphics ensure that distortion does not occur. Moreover, both standard(4:3) and widescreen(16:9) viewing angles are supported for clarity.
-
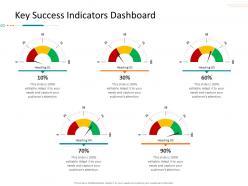 Key success indicators dashboard corporate tactical action plan template company ppt sample
Increase audience engagement and knowledge by dispensing information using Key Success Indicators Dashboard Corporate Tactical Action Plan Template Company Ppt Sample. This template helps you present information on five stages. You can also present information on Key Success Indicators Dashboard using this PPT design. This layout is completely editable so personaize it now to meet your audiences expectations.


