Top Collection of 6 Dashboard Essentials PowerPoint PPT Templates
-
 61920198 style essentials 2 dashboard 6 piece powerpoint presentation diagram infographic slide
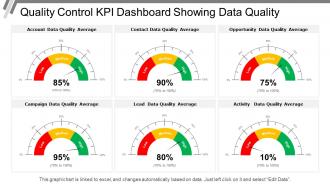
Presenting this set of slides with name - Quality Control Kpi Dashboard Snapshot Showing Data Quality. This is a six stage process. The stages in this process are Quality Management, Quality Control, Quality Assurance.
-
 40668413 style essentials 2 dashboard 6 piece powerpoint presentation diagram infographic slide
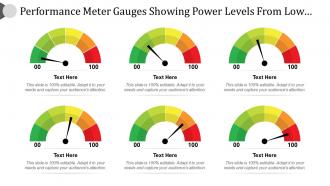
Introducing, the performance meter gauges PowerPoint Presentation Slide. This Presentation has been designed professionally and is fully editable. You can reshape the font size, font type, colors, and even the background. This Template is amiable with Google Slide and can be saved in JPG or PDF format without any fuss created. Fast download at the click of the button.
-
 72671910 style essentials 2 financials 6 piece powerpoint presentation diagram infographic slide
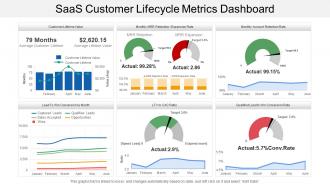
Presenting this set of slides with name - Saas Customer Lifecycle Metrics Dashboard. Highlighting Saas customer lifecycle metrics dashboard PowerPoint presentation. Offer 100% access to change the size and style of the slides once downloaded and saved in the desired format. Beneficial for the business managers, marketing professionals and the strategy designers. Access to convert the presentation design into JPG and PDF. High quality images and visuals used in the designing process. Choice to get presentation slide in standard or in widescreen view. Easy to convert in JPEG and PDF document.
-
 28232360 style essentials 2 dashboard 6 piece powerpoint presentation diagram infographic slide
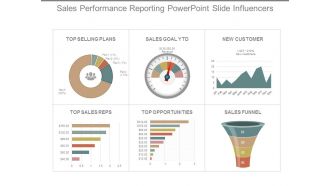
These slides are 100% editable to match your liking. Instantly downloadable graphics. Standard and widescreen compatibility. Can be opened with Google Slides. Suitable for use by marketers, sales team, businessmen. Premium customer support provided.This is a six stage process. The stages in this process are top selling plans, sales goal ytd, new customer, top sales reps, top opportunities, sales funnel.
-
 4574713 style essentials 2 dashboard 6 piece powerpoint presentation diagram infographic slide
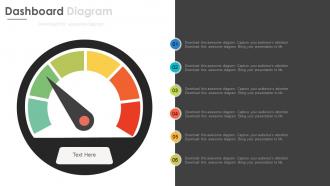
PPT slide is compatible with Google slide. High resolution. PPT visual is useful to businessmen, sales, marketing, finance, accounting and service sector departments. Presentation graphic can be optimized and viewed in tablets, phone, widescreen monitors and projector screens. PowerPoint diagram is compatible with Microsoft 2010 and 2013 versions. Pre designed shapes help to save lot of time and effort.
-
 81906914 style essentials 2 financials 6 piece powerpoint presentation diagram infographic slide
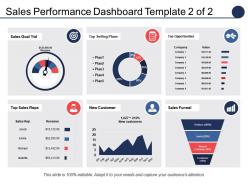
Presenting sales performance dashboard top selling plans top opportunities PPT template. Completely amendable by any user at any point of time without any hassles. Error free performance to put an everlasting impression on the viewers. Great for incorporating business details such as name, logo and trademark. Can be utilized by students, entrepreneurs, investors and customers. Professionally designed presentation slides. Personalize the presentation with individual company name and logo. Available in both Standard and Widescreen slide size.
-
 83477491 style essentials 2 financials 6 piece powerpoint presentation diagram infographic slide
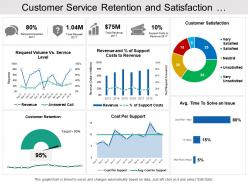
Presenting this set of slides with name - Customer Service Retention And Satisfaction Dashboard. This is a six stage process. The stages in this process are Customer Base, Recurring Customers, Customer Services.
-
 45436157 style essentials 2 dashboard 6 piece powerpoint presentation diagram infographic slide
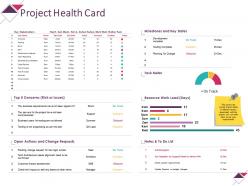
Presenting this set of slides with name - Project Health Card Powerpoint Slide Information. This is a six stage process. The stages in this process are Task Meter, Resource Work Load, Open Actions And Change, Dashboard, Business.
-
 27104020 style essentials 2 financials 6 piece powerpoint presentation diagram infographic slide
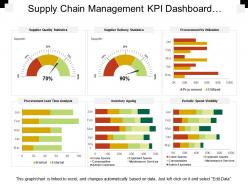
Presenting this set of slides with name - Supply Chain Management Kpi Dashboard Showing Procurement Vs Utilization. This is a six stage process. The stages in this process are Demand Forecasting, Predicting Future Demand, Supply Chain Management.
-
 89803841 style division donut 6 piece powerpoint presentation diagram template slide
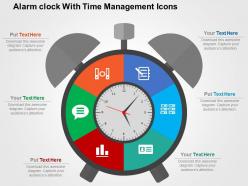
Entirely editable PowerPoint slide with great picture quality. Compatible with several software programs like JPEG or PDF. Access to include or exclude any element as per the business requirement. Customization of PowerPoint diagram and text is permitted according to your preference. Presentation layout available in standard as well as in widescreen slide size. PPT design can be downloaded with different nodes and stages.
-
 48126678 style essentials 2 financials 6 piece powerpoint presentation diagram infographic slide
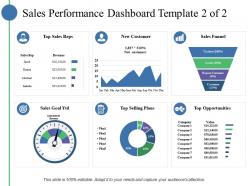
Introducing sales performance dashboard top sales reps new customer PowerPoint template. Presentation slides are crafted with high quality resolution designs. PPT templates comes in standard and widescreen view. Instant download and can be converted into other formats i.e. JPEG and PDF. Perfect for business management experts and research development team. Replace the watermark with your company’s logo. Possess time saving qualities. Presentation slides are well-matched with Google slides. Fast download and effortlessly inclusion in your presentation.
-
 19714613 style essentials 2 financials 6 piece powerpoint presentation diagram infographic slide
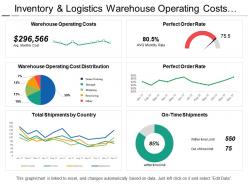
Presenting inventory and logistics warehouse operating costs dashboard PPT slideshow. Editable charts, visuals, colors and text. Presentable and easy to comprehend info graphic format. The presentation template can be downloaded and saved in any desired format. Privilege of insertion of logo and trademarks for more personalization. Adaptable to wide screen view without the problem of pixilation. Can be used with Google slides. Easy to edit and customize as per your needs. Beneficial for industry professionals, managers, executives, researchers, sales people, etc.
-
 9075833 style essentials 2 dashboard 6 piece powerpoint presentation diagram infographic slide
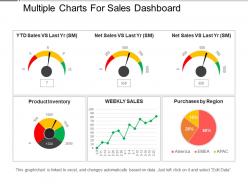
Presenting multiple charts for sales dashboard PPT image. Incredibly amicable PPT design entirely useful for Sales professionals and experts. Comprehensive and convenient PPT Image with ductile dummy data options with an alternative to add company name, design, or symbol. Consonant with all available graphic softwares and Google Slides. Totally accessible into other file configurations like PDF or JPG. Features as background images, styles, texts, and other characteristics are fully editable. Expeditious downloading process.
-
 32563845 style circular semi 6 piece powerpoint presentation diagram infographic slide
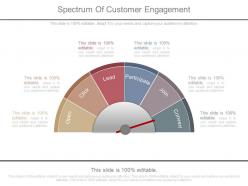
Presenting spectrum of customer engagement ppt presentation. This is a spectrum of customer engagement ppt presentation. This is a six stage process. The stages in this process are open, click, lead, participate, join, convert.
-
 6581102 style circular hub-spoke 6 piece powerpoint presentation diagram infographic slide
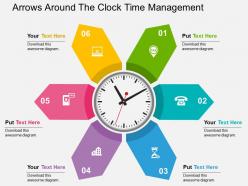
Visually appealing PowerPoint presentation patterns. High quality images and visuals used in the PPT design. Adaptable PPT slides as fully compatible with Google slides. Beneficial for industry professionals, managers, executives, researchers, sales people, etc. The presentation template can be downloaded and saved in any desired format. Privilege of insertion of logo and trademarks for more personalization.
-
 74193217 style essentials 2 dashboard 6 piece powerpoint presentation diagram infographic slide
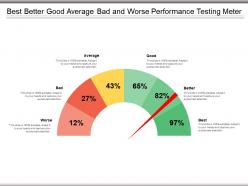
Presenting this set of slides with name - Best Better Good Average Bad And Worse Performance Testing Meter. This is a six stage process. The stages in this process are Performance Testing, Performance Analysis, Performance Monitoring.
-
 23659841 style essentials 2 financials 6 piece powerpoint presentation diagram template slide
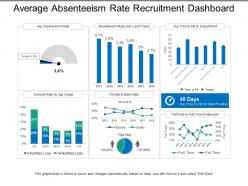
Presenting this set of slides with name - Average Absenteeism Rate Recruitment Dashboard. This is a six stage process. The stages in this process are Staffing Plan, Recruitment, Staff Management.
-
 98430836 style division pie 6 piece powerpoint presentation diagram infographic slide
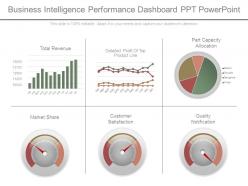
Presenting business intelligence performance dashboard snapshot ppt powerpoint. This is a business intelligence performance dashboard ppt powerpoint. This is a six stage process. The stages in this process are total revenue, detailed profit of top product line, part capacity allocation, market share, customer satisfaction, quality notification.
-
 37838639 style essentials 2 dashboard 6 piece powerpoint presentation diagram infographic slide
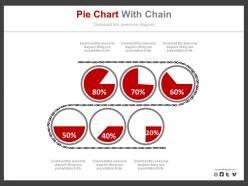
Pixel friendly images and slide icons. 100% customization allowed. Easy to download. Save in the wide variety of formats. Customize the background, style and orientation. Attune well with the Google slides. Useful for the business entrepreneurs, marketing professionals and students.
-
 99434417 style circular hub-spoke 6 piece powerpoint presentation diagram infographic slide
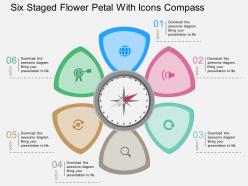
We are proud to present our six staged flower petal with icons compass flat powerpoint design. Six staged flower petal with icons has been used to craft this power point diagram. This PPT diagram contains the concept of process flow. Use this PPT diagram for business and marketing related presentations.
-
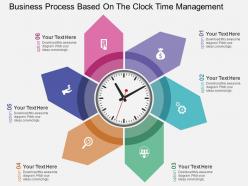 30515273 style circular loop 6 piece powerpoint presentation diagram infographic slide
Fully editable and professional PPT Slide. Inspired by the trending time management tools and techniques. Easily and effortlessly modifiable by any user at any time without even having any specialized knowledge. Compatible with Microsoft office software and the Google slides. Available to be saved in JPG or PDF format. Modify and personalize the presentation by including the company name and logo.
-
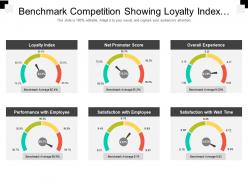 18243130 style essentials 2 dashboard 6 piece powerpoint presentation diagram infographic slide
Presenting this set of slides with name - Benchmark Competition Showing Loyalty Index And Net Promoters Score. This is a six stage process. The stages in this process are Benchmark Competition, Competitive Analysis, Competition Landscape.
-
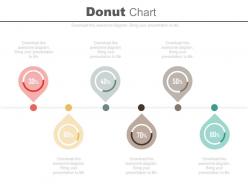 49496627 style essentials 2 dashboard 6 piece powerpoint presentation diagram infographic slide
Presenting six staged donut chart percentage timeline diagram powerpoint slides. This Power Point template slide has been crafted with graphic of six staged donut chart and percentage timeline. This PPT slide contains the concept of financial analysis. Use this PPT slide for business and finance related presentations.
-
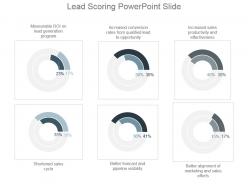 70877615 style essentials 2 dashboard 6 piece powerpoint presentation diagram infographic slide
Presenting lead scoring powerpoint slide. This is a lead scoring powerpoint slide. This is a six stage process. The stages in this process are measurable roi on lead generation program, increased conversion rates from qualified lead to opportunity, increased sales productivity and effectiveness, shortened sales cycle, better forecast and pipeline visibility, better alignment of marketing and sales efforts.
-
 38323906 style circular semi 6 piece powerpoint presentation diagram infographic slide
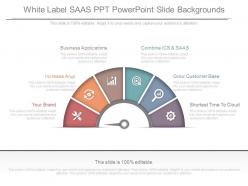
Presenting a white label saas ppt powerpoint slide backgrounds. This is a white label saas ppt powerpoint slide backgrounds. This is a six stage process. The stages in this process are your brand, increase arup, business applications, combine ics and saas, grow customer base, shortest time to cloud.
-
 78740577 style essentials 2 dashboard 6 piece powerpoint presentation diagram infographic slide
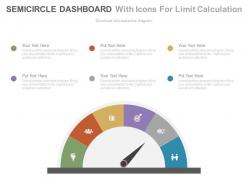
Presenting semicircle dashboard with icons for limit calculation powerpoint slides. This Power Point template diagram slide has been crafted with graphic of semicircle dashboard and icons. This PPT diagram contains the concept of limit calculation representation. Use this PPT diagram for business and finance related presentations.
-
 87173496 style essentials 2 dashboard 6 piece powerpoint presentation diagram infographic slide
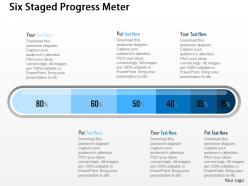
We are proud to present our cf six staged progress meter powerpoint template. Six staged progress meter has been used to decorate this power point template. This PPT contains the concept of progress measurement. Use this PPT for business progress related presentations.
-
 38156714 style essentials 2 financials 6 piece powerpoint presentation diagram infographic slide
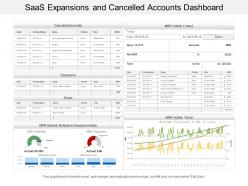
Presenting Saas expansions and cancellation accounts dashboard PPT template. Download is quick and can be easily shared. Conveys a sense of change over time. Suitable for corporate leaders and business associates. Flexible PPT slide as can be used whenever required. PowerPoint design can be shared in Standard and Widescreen view. High quality graphics and visuals used in the PPT. Option to include business content i.e. name, logo and text. Effortless conversion into PDF/ JPG format. Can be easily merged with your ongoing presentation slides.
-
 95259552 style essentials 2 dashboard 6 piece powerpoint presentation diagram infographic slide
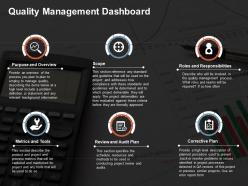
Presenting quality management dashboard powerpoint graphics. This is a quality management dashboard powerpoint graphics. This is a six stage process. The stages in this process are purpose and overview, scope, roles and responsibilities, metrics and tools, review and audit plan, corrective plan.
-
 Sample agenda for sales meeting with client infographic template
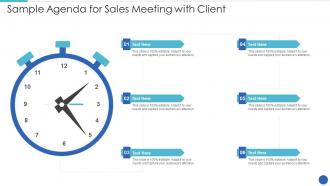
Deploy our Sample Agenda For Sales Meeting With Client Infographic Template to present high quality presentations. It is designed in PowerPoint and is available for immediate download in standard and widescreen sizes. Not only this, but this layout is also 100 percent editable, giving you full control over its applications.
-
 90533155 style essentials 2 dashboard 6 piece powerpoint presentation diagram infographic slide
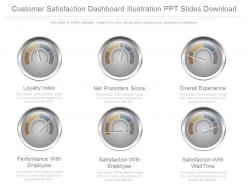
Presenting download customer satisfaction dashboard illustration ppt slides download. This is a customer satisfaction dashboard illustration ppt slides download. This is a six stage process. The stages in this process are loyalty index, net promoters score, overall experience, performance with employee, satisfaction with employee, satisfaction with wait time.
-
 Performance score meter with black cursor
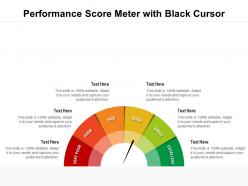
Presenting Performance Score Meter With Black Cursor slide. This PPT supports both the standard(4:3) and widescreen(16:9) sizes. This presentation is very easy to download and can be converted into numerous images or document formats including JPEG, PNG, or PDF. It is also compatible with Google Slides and editable in PowerPoint. Alter the style, size, color, background, and other attributes according to your requirements. Moreover, high-quality images prevent the lowering of quality.
-
 27094312 style essentials 2 dashboard 6 piece powerpoint presentation diagram infographic slide
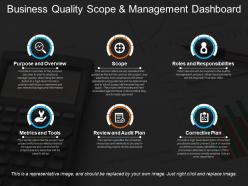
Presenting business quality scope and management dashboard. This is a business quality scope and management dashboard. This is a six stage process. The stages in this process are business quality, quality management, quality assurance.
-
 44121495 style essentials 2 dashboard 6 piece powerpoint presentation diagram template slide
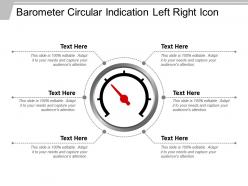
Presenting barometer circular indication left right icon. This is a barometer circular indication left right icon. This is a six stage process. The stages in this process are barometer, weather instrument, ?pressure gauge.
-
 33275311 style essentials 2 dashboard 6 piece powerpoint presentation diagram infographic slide
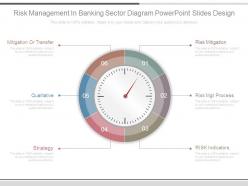
Presenting risk management in banking sector diagram powerpoint slides design. This is a risk management in banking sector diagram powerpoint slides design. This is a six stage process. The stages in this process are risk mitigation, risk mgt process, risk indicators, strategy, qualitative, mitigation or transfer.
-
 Key financial ratios fy20 account ppt powerpoint presentation show icons
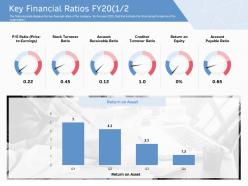
The following slide displays the key financial ratios of the company for the year 2020 that that indicate the financial performance of the organization. Presenting this set of slides with name Key Financial Ratios Fy20 Account Ppt Powerpoint Presentation Show Icons. This is a six stage process. The stages in this process are Stock Turnover Ratio, Account Receivable Ratio, Creditor Turnover Ratio, Return On Equity, Account Payable Ratio. This is a completely editable PowerPoint presentation and is available for immediate download. Download now and impress your audience.
-
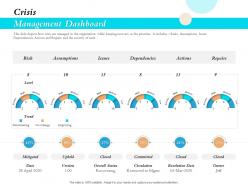 Crisis management dashboard actions ppt file topics
This slide depicts how crisis are managed in the organization while keeping recovery as the priorities. It includes Risks Assumptions Issues Dependencies Actions and Repairs and the severity of each. Presenting this set of slides with name Crisis Management Dashboard Snapshot Actions Ppt File Topics. This is a six stage process. The stages in this process are Risk, Assumptions, Issues, Dependencies, Actions. This is a completely editable PowerPoint presentation and is available for immediate download. Download now and impress your audience.
-
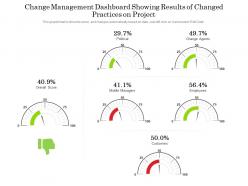 Change management dashboard showing results of changed practices on project
Presenting this set of slides with name Change Management Dashboard Showing Results Of Changed Practices On Project. This is a six stage process. The stages in this process are Employees, Customers, Overall Score. This is a completely editable PowerPoint presentation and is available for immediate download. Download now and impress your audience.
-
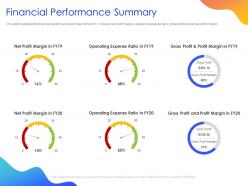 Financial performance summary ppt powerpoint presentation pictures influencers
This slide illustrates the financial performance summary of the firm. It covers net profit margin, operating expense ratio, gross profit and gross profit margin. Presenting this set of slides with name Financial Performance Summary Ppt Powerpoint Presentation Pictures Influencers. This is a six stage process. The stages in this process are Profit Margin, Operating Expense, Gross Profit. This is a completely editable PowerPoint presentation and is available for immediate download. Download now and impress your audience.
-
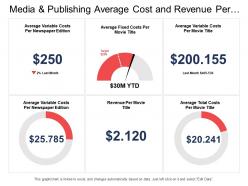 64655886 style essentials 2 dashboard 6 piece powerpoint presentation diagram template slide
Presenting this set of slides with name - Media And Publishing Average Cost And Revenue Per Movie Title Dashboard. This is a six stage process. The stages in this process are Media And Publishing, Media Communication.
-
 Effect of quality with csat
Presenting this set of slides with name Effect Of Quality With CSAT. This is a six stage process. The stages in this process are Customer Support, Completion Rate, Product CAST, Response Rate, Onboarding CAST. This is a completely editable PowerPoint presentation and is available for immediate download. Download now and impress your audience.
-
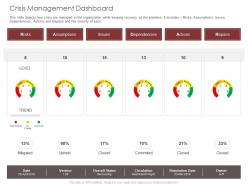 Crisis management dashboard level ppt powerpoint presentation infographics master slide
This slide depicts how crisis are managed in the organization while keeping recovery as the priorities. It includes Risks, Assumptions, Issues, Dependencies, Actions and Repairs and the severity of each. Presenting this set of slides with name Crisis Management Dashboard Level Ppt Powerpoint Presentation Infographics Master Slide. This is a six stage process. The stages in this process are Risks, Assumptions, Issues, Level, Trend. This is a completely editable PowerPoint presentation and is available for immediate download. Download now and impress your audience.
-
 28581380 style essentials 2 dashboard 6 piece powerpoint presentation diagram infographic slide
Presenting 6 Feature With Meter Performance Icon which is fully editable. Change the colors, fonts, font size, and font types as per your requirement. This template is adaptable with Google Slides which makes it easily accessible at once. Freely access your presentation in both 4:3 and 16:9 aspect ratio. You can open and save your presentation in various formats like PDF, JPG, and PNG.
-
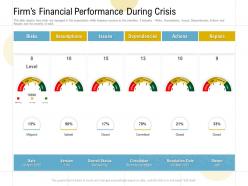 Firms financial performance during crisis risks ppt powerpoint presentation gallery files
This slide depicts how crisis are managed in the organization while keeping recovery as the priorities. It includes Risks, Assumptions, Issues, Dependencies, Actions and Repairs and the severity of each. Presenting this set of slides with name Firms Financial Performance During Crisis Risks Ppt Powerpoint Presentation Gallery Files. This is a six stage process. The stages in this process are Risks, Assumptions, Issues, Dependencies, Actions, Repairs, Mitigated, Upheld, Closed, Committed. This is a completely editable PowerPoint presentation and is available for immediate download. Download now and impress your audience.
-
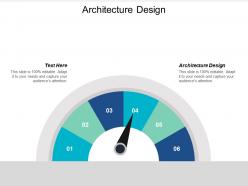 Architecture design ppt powerpoint presentation file deck cpb
Presenting this set of slides with name Architecture Design Ppt Powerpoint Presentation File Deck Cpb. This is an editable Powerpoint six stages graphic that deals with topics like Architecture Design to help convey your message better graphically. This product is a premium product available for immediate download and is 100 percent editable in Powerpoint. Download this now and use it in your presentations to impress your audience.
-
 95299780 style essentials 2 dashboard 6 piece powerpoint presentation diagram infographic slide
Presenting 6 optimize icon with circular meter and red indicator. This is a 6 optimize icon with circular meter and red indicator. This is a six stage process. The stages in this process are optimize icon, analyze icon, engineering icon.
-
 62055391 style essentials 2 dashboard 6 piece powerpoint presentation diagram infographic slide
Presenting 6 optimize icon with stopwatch and indicator. This is a 6 optimize icon with stopwatch and indicator. This is a six stage process. The stages in this process are optimize icon, analyze icon, engineering icon.
-
 38173608 style essentials 2 dashboard 6 piece powerpoint presentation diagram infographic slide
Presenting 6 optimize icon with settings icon and meter. This is a 6 optimize icon with settings icon and meter. This is a six stage process. The stages in this process are optimize icon, analyze icon, engineering icon.
-
 94473221 style essentials 2 dashboard 6 piece powerpoint presentation diagram infographic slide
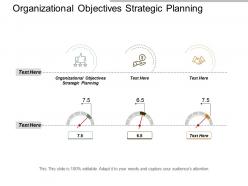
Presenting this set of slides with name - Organizational Objectives Strategic Planning Ppt Powerpoint Presentation Model Cpb. This is an editable six stages graphic that deals with topics like Organizational Objectives Strategic Planning to help convey your message better graphically. This product is a premium product available for immediate download, and is 100 percent editable in Powerpoint. Download this now and use it in your presentations to impress your audience.
-
 64676192 style essentials 2 dashboard 6 piece powerpoint presentation diagram infographic slide
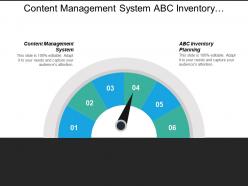
Presenting this set of slides with name - Content Management System Abc Inventory Planning Customer Satisfaction Cpb. This is an editable six graphic that deals with topics like Content Management System, Abc Inventory Planning, Customer Satisfaction to help convey your message better graphically. This product is a premium product available for immediate download, and is 100 percent editable in Powerpoint. Download this now and use it in your presentations to impress your audience.


