Financial Reviews and Accounting PPT Slides
-
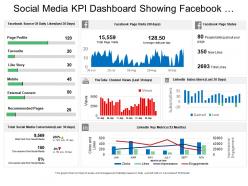 73902800 style essentials 2 financials 5 piece powerpoint presentation diagram infographic slide
Presenting this set of slides with name - Social Media Kpi Dashboard Showing Facebook Page Stats Youtube Channel Views. This is a five stage process. The stages in this process are Social Media, Digital Marketing, Social Marketing.
-
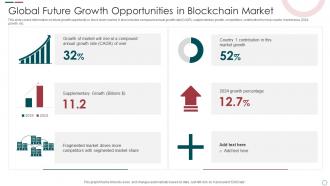 Global Future Growth Opportunities In Blockchain Market
This slide covers information on future growth opportunity in block chain market. It also includes compound annual growth rate CAGR, supplementary growth, competitors, contribution from top country market area, 2024 growth, etc. Presenting our set of slides with name Global Future Growth Opportunities In Blockchain Market. This exhibits information on six stages of the process. This is an easy-to-edit and innovatively designed PowerPoint template. So download immediately and highlight information on Global Future Growth, Opportunities, Blockchain Market.
-
 Customers Willingness To Pay Strategy Icon
Presenting our set of slides with Customers Willingness To Pay Strategy Icon. This exhibits information on Three stages of the process. This is an easy to edit and innovatively designed PowerPoint template. So download immediately and highlight information on Customers Willingness, Pay Strategy Icon.
-
 74041683 style essentials 2 financials 1 piece powerpoint presentation diagram infographic slide
Easy proofing and editing is added on feature of presentation visual. Presentation slide is useful in business marketing, management and recourse disbursement. Basic theme yet it can modified with respect to font, color and layout. Attractive color scheme gives a professional look to PPT layout. Conversion into PDF or JPG formats is very easy and handy. PPT graphic offers font size which can be read from a distance.
-
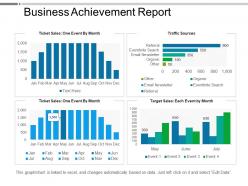 22010307 style essentials 2 financials 4 piece powerpoint presentation diagram infographic slide
Presenting business achievement report PowerPoint templates slideshow which is 100% editable. This PPT template is crafted with attractive display and unique components. This PPT slide is excel linked i.e. data driven and easy to customize and enables you to personalize it as per your own criteria. The presentation slide is fully compatible with Google slides, multiple format and software options. In case of any assistance, kindly take instructions from our presentation design services and it is easy to download in a very short span of time. The images, layouts, designs are of high quality and ensures quality in widescreen.
-
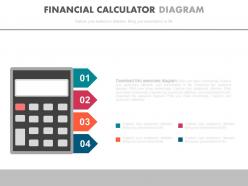 13096370 style essentials 2 financials 4 piece powerpoint presentation diagram infographic slide
Presenting four staged financial calculation diagram powerpoint slides. This Power Point template diagram slide has been crafted with graphic of four staged calculation diagram. This PPT diagram contains the concept of financial calculation. Use this PPT diagram for business and marketing related presentations.
-
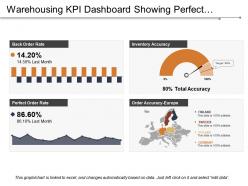 58461 style essentials 2 financials 4 piece powerpoint presentation diagram infographic slide
PPT design can instantly be downloaded as JPEG and PDF formats. Design template is easily editable, the best advantage of this business oriented PPT design is the use of excel linked charts, where charts in PPT design will automatically get changed when you update storage related figures on linked excel sheet. The PPT design is fully compatible with Google Slides and MS PowerPoint software. Design can be viewed both in standard and full screen view.
-
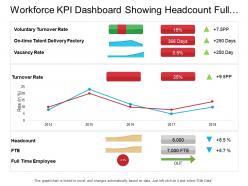 53214381 style essentials 2 financials 3 piece powerpoint presentation diagram infographic slide
Presenting this set of slides with name - Workforce Kpi Dashboard Showing Headcount Full Time Employee And Turnover Rate. This is a three stage process. The stages in this process are Staff, Personnel, Workforce.
-
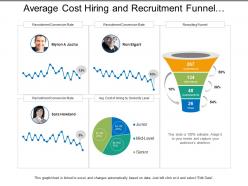 29546045 style layered funnel 3 piece powerpoint presentation diagram infographic slide
Presenting this set of slides with name - Average Cost Hiring And Recruitment Funnel Dashboard. This is a three stage process. The stages in this process are Staffing Plan, Recruitment, Staff Management.
-
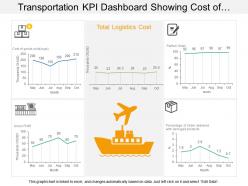 8839611 style essentials 2 financials 2 piece powerpoint presentation diagram infographic slide
Presenting KPI dashboard showing cost of goods sold logistics cost and gross profit PPT slide. This layout is fully compatible with Google slides and data driven. User can edit the data in linked excel sheet and graphs and charts gets customized accordingly. Easy to put in company logo, trademark or name; accommodate words to support the key points. Images do no distort out even when they are projected on large screen. Adjust colors, text and fonts as per your business requirements
-
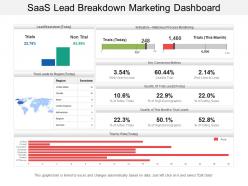 88830346 style essentials 2 financials 5 piece powerpoint presentation diagram infographic slide
Presenting this set of slides with name - Saas Lead Breakdown Marketing Dashboard. Stunning Saas lead breakdown marketing dashboard PPT template. Download is rapid and can be displayed in widescreen view mode also. 100% editable PPT designs as completely modifiable such as icons, text, colors, etc. Effortlessly convertible into JPEG and PDF file formats. Top quality and creative PowerPoint slide design. Adjustable presentation graphic as compatible with Google slides. Perfect for sales executives, marketers, business professionals, analysts, strategists, students, teachers, etc. Information on making the changes has been provided for your provision.
-
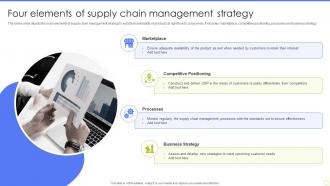 Four Elements Of Supply Chain Management Strategy
The below slide depicts the main elements of supply chain management strategy to establish availability of products at right time to consumers. It includes marketplace, competitive positioning, processes and business strategy. Presenting our set of slides with Four Elements Of Supply Chain Management Strategy. This exhibits information on four stages of the process. This is an easy to edit and innovatively designed PowerPoint template. So download immediately and highlight information on Marketplace, Competitive Positioning, Processes, Business Strategy.
-
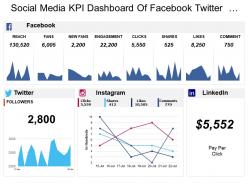 53848885 style essentials 2 financials 4 piece powerpoint presentation diagram infographic slide
Presenting this set of slides with name - Social Media Kpi Dashboard Of Facebook Twitter Instagram Clicks Followers. This is a four stage process. The stages in this process are Social Media, Digital Marketing, Social Marketing.
-
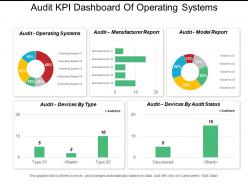 18075649 style essentials 2 financials 5 piece powerpoint presentation diagram template slide
Presenting this set of slides with name - Audit Kpi Dashboard Of Operating Systems Manufacturer Report And Model Report. This is a five stage process. The stages in this process are Audit, Examine, Survey.
-
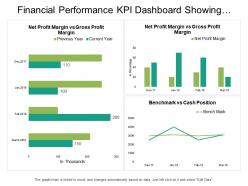 81603876 style essentials 2 financials 4 piece powerpoint presentation diagram infographic slide
Presenting this set of slides with name - Financial Performance Kpi Dashboard Showing Benchmark Vs Cash Position. This is a four stage process. The stages in this process are Financial Performance, Financial Report, Financial Review.
-
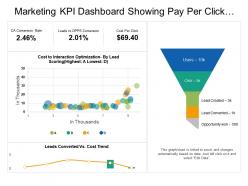 44993197 style essentials 2 financials 3 piece powerpoint presentation diagram infographic slide
Presenting this set of slides with name - Marketing Kpi Dashboard Showing Pay Per Click Campaign Optimization. This is a three stage process. The stages in this process are Marketing, Branding, Promoting.
-
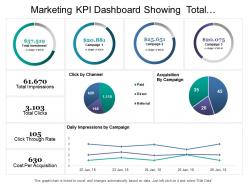 52553811 style division donut 4 piece powerpoint presentation diagram infographic slide
Presenting marketing KPI dashboard showing total investment impressions click cost per acquisition PPT slide. This layout is fully compatible with Google slides and data driven. User can edit the data in linked excel sheet and graphs and charts gets customized accordingly. Easy to put in company logo, trademark or name; accommodate words to support the key points. Images do no distort out even when they are projected on large screen. Adjust colors, text and fonts as per your business requirements
-
 20985052 style essentials 2 financials 4 piece powerpoint presentation diagram infographic slide
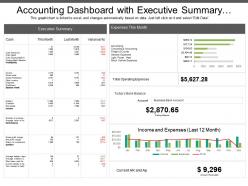
Presenting accounting dashboard with executive summary and monthly expenses PPT slideshow. Makes the information clear in the mind of the audience. Editable visuals, colors and charts. Easy to edit and customize as per your needs. Beneficial for industry professionals, technologists, managers, executives, researchers, sales people, etc. Flexible presentation designs can be presented in standard and widescreen view. Has a futuristic and realistic approach. Privilege of insertion of logo and trademarks for more personalization. Easy to download and save. Highly beneficial PowerPoint Slide for highlighting financial data.
-
 Value Based Pricing Strategy For Profit Margin Growth
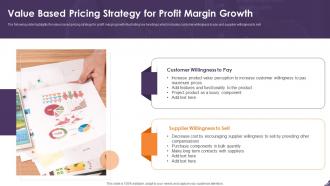
The following slide highlights the value based pricing strategy for profit margin growth illustrating key headings which includes customer willingness to pay and supplier willingness to sell Presenting our set of slides with name Value Based Pricing Strategy For Profit Margin Growth. This exhibits information on two stages of the process. This is an easy-to-edit and innovatively designed PowerPoint template. So download immediately and highlight information on Customer Willingness Pay, Supplier Willingness To Sell.
-
 Debt Recovery Process Step 4 Issue Court Proceeding For Recovering Debt
This slide shows five steps to file issue court proceedings for recovering amount from debtors. It include steps such as file legal complaint, serve legal documents and respond to claim, etc. Increase audience engagement and knowledge by dispensing information using Debt Recovery Process Step 4 Issue Court Proceeding For Recovering Debt. This template helps you present information on five stages. You can also present information on Serve Legal Documents, Court Hearing, Enforcement, Issue Court Proceeding using this PPT design. This layout is completely editable so personaize it now to meet your audiences expectations.
-
 22473637 style essentials 2 financials 2 piece powerpoint presentation diagram template slide
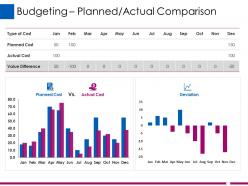
Presenting this set of slides with name - Budgeting Planned Actual Comparison Ppt Layouts. This is a two stage process. The stages in this process are Finance, Business, Analysis, Marketing, Planning.
-
 23612104 style essentials 2 financials 6 piece powerpoint presentation diagram infographic slide
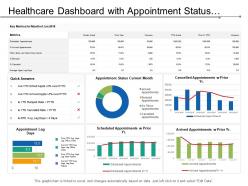
Presenting this set of slides with name - Healthcare Dashboard With Appointment Status Current Month. This is a six stage process. The stages in this process are Healthcare, Health Improvement, Medical Care.
-
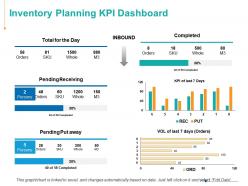 53600398 style essentials 2 financials 2 piece powerpoint presentation diagram infographic slide
Presenting this set of slides with name - Inventory Planning KPI Dashboard Ppt Powerpoint Presentation Icon. This is a two stage process. The stages in this process are Finance, Analysis, Business, Investment, Marketing.
-
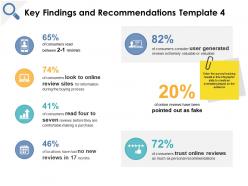 Key findings and recommendations online reviews growth ppt powerpoint presentation file icons
Presenting this set of slides with name Key Findings And Recommendations Online Reviews Growth Ppt Powerpoint Presentation File Icons. This is a six stage process. The stages in this process are Finance, Marketing, Management, Investment, Analysis. This is a completely editable PowerPoint presentation and is available for immediate download. Download now and impress your audience.
-
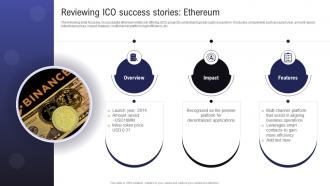 Comprehensive Guide To Raise Reviewing ICO Success Stories Ethereum BCT SS
The following slide focusses on successful ethereum initial coin offering ICO project to understand global crypto ecosystem. It includes components such as launch year, amount raised, initial token prices, impact, features, multichannel platform, high efficiency, etc. Increase audience engagement and knowledge by dispensing information using Comprehensive Guide To Raise Reviewing ICO Success Stories Ethereum BCT SS This template helps you present information on Three stages. You can also present information on Decentralized Applications, Business Operations Reviewing using this PPT design. This layout is completely editable so personaize it now to meet your audiences expectations.
-
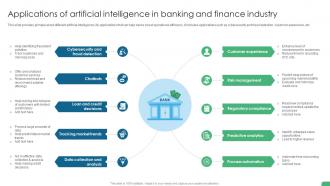 Applications Of Artificial Intelligence In Banking And Finance Digital Transformation In Banking DT SS
This slide provides glimpse about different artificial intelligence AI applications that can help banks boost operational efficiency. It includes applications such as cybersecurity and fraud detection, customer experience, etc. Introducing Applications Of Artificial Intelligence In Banking And Finance Digital Transformation In Banking DT SS to increase your presentation threshold. Encompassed with ten stages, this template is a great option to educate and entice your audience. Dispence information on Credit Decisions, Market Trends, Collection And Analysis using this template. Grab it now to reap its full benefits.
-
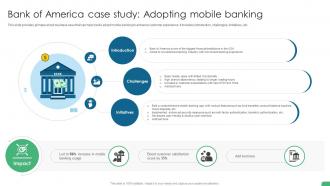 Bank Of America Case Study Adopting Mobile Banking Digital Transformation In Banking DT SS
This slide provides glimpse about business case that can help banks adopt mobile banking to enhance customer experience. It includes introduction, challenges, initiatives, etc. Introducing Bank Of America Case Study Adopting Mobile Banking Digital Transformation In Banking DT SS to increase your presentation threshold. Encompassed with three stages, this template is a great option to educate and entice your audience. Dispence information on Introduction, Challenges, Initiatives, Customer Satisfaction using this template. Grab it now to reap its full benefits.
-
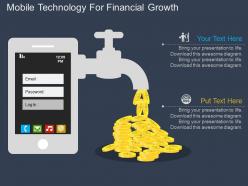 85173494 style essentials 2 financials 2 piece powerpoint presentation diagram infographic slide
Presenting new mobile technology for financial growth flat powerpoint design. This Power Point template diagram has been crafted with graphic of mobile diagram. This PPT diagram contains the concept of financial growth and mobile technology application. Use this PPT diagram for finance and technology related presentations.
-
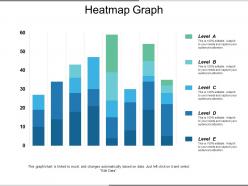 19413284 style essentials 2 financials 5 piece powerpoint presentation diagram infographic slide
Presenting the Heatmap Graph PowerPoint theme which is designed professionally for your convenience. Open and save your presentation in various formats like PDF, JPG, and PNG. You can freely access your presentation in both 4:3 and 16:9 aspect ratio. Alter the font, color, font size, and font types of the slides as per your needs. This template is compatible with Google Slides which makes it easily accessible at once.
-
 86915718 style variety 2 currency 2 piece powerpoint presentation diagram infographic slide
Presenting this set of slides with name - Stack Of Coins Showing Dollar Sign. This is a two stage process. The stages in this process are Coin Icon, Penny Icon, Stack Icon.
-
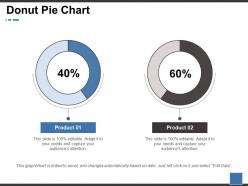 42219778 style division donut 2 piece powerpoint presentation diagram infographic slide
Explore the donut pie chart PowerPoint presentation slide. This presentation has been designed by professionals and is fully editable. You can reshape the font size, font type, colors, and even the background. This Template is attainable with Google Slide and can be saved in JPG or PDF format without any resistance created during the process. Fast download at the click of the button provided below.
-
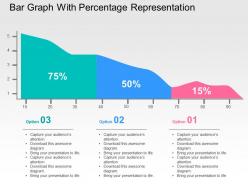 24785500 style concepts 1 growth 3 piece powerpoint presentation diagram infographic slide
Well compatible with Google slides. Runs smoothly with all software’s. Can be easily converted into PDF or JPG formats. Follow the instructions for editing and changing the slide. No diversion of pixels when opened on a wide screen display. Useful for the business managers or entrepreneurs. Allow instant downloading of the slide template.
-
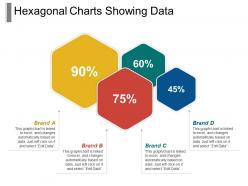 11569560 style cluster hexagonal 4 piece powerpoint presentation diagram infographic slide
Presenting our exceptional Hexagonal charts showing data PowerPoint layout. This PPT design holds five slides to help you present the figures in a systematic way. This PowerPoint theme is accessible in standard as well as wide-screen formats. It is completely editable as well. You can use it on Microsoft Office, Google slides and many other presentation software.
-
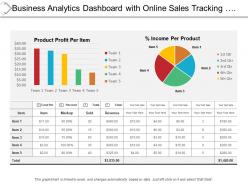 23757357 style essentials 2 financials 2 piece powerpoint presentation diagram infographic slide
This is a two stage process. The stages in this process are Business Analytics, BA, Organizations Data.
-
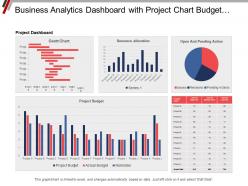 73274958 style essentials 2 financials 5 piece powerpoint presentation diagram infographic slide
This is a five stage process. The stages in this process are Business Analytics, BA, Organizations Data.
-
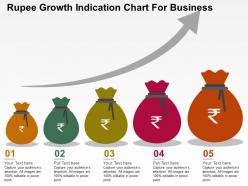 76178503 style concepts 1 growth 5 piece powerpoint presentation diagram infographic slide
Easy to input company logo, brand name or name. Presentation templates quality remain similar even when you resize the image. This PPT template fully compatible with Google slides. Formats can easily be changed into other software’s applications like PDF and JPEG. Amend PowerPoint design slides font, text, color and design as per your necessities. Ideal for entrepreneurs and large business organization.
-
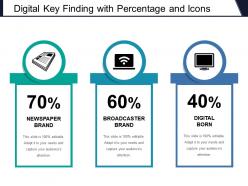 67092154 style essentials 2 financials 3 piece powerpoint presentation diagram template slide
Presenting this set of slides with name - Digital Key Finding With Percentage And Icons. This is a three stage process. The stages in this process are Key Findings, Key Achievements, Key Accomplishment.
-
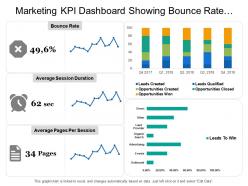 16912769 style essentials 2 financials 3 piece powerpoint presentation diagram template slide
Presenting this set of slides with name - Marketing Kpi Dashboard Showing Bounce Rate Average Session Duration. This is a three stage process. The stages in this process are Marketing, Branding, Promoting.
-
 55406444 style essentials 2 financials 6 piece powerpoint presentation diagram infographic slide
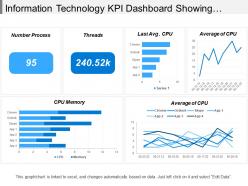
Presenting this set of slides with name - Information Technology Kpi Dashboard Showing Cpu Memory Average Of Cpu. This is a six stage process. The stages in this process are Information Technology, It, Iot.
-
 44756860 style essentials 2 financials 4 piece powerpoint presentation diagram infographic slide
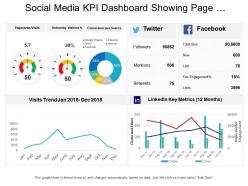
Presenting this set of slides with name - Social Media Kpi Dashboard Showing Page Viewsvisits Conversion Per Source. This is a four stage process. The stages in this process are Social Media, Digital Marketing, Social Marketing.
-
 4925780 style essentials 2 financials 3 piece powerpoint presentation diagram template slide
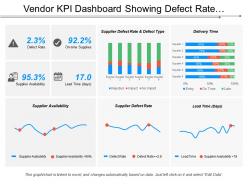
Presenting this set of slides with name - Vendor Kpi Dashboard Showing Defect Rate On-Time Suppliers And Lead Time. This is a stage process. The stages in this process are Vendor, Supplier, Retailer.
-
 97390645 style essentials 2 financials 4 piece powerpoint presentation diagram infographic slide
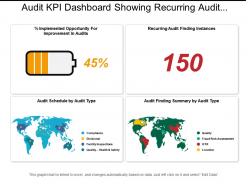
Presenting this set of slides with name - Audit Kpi Dashboard Showing Recurring Audit Finding Instances And Audit Finding Summary. This is a four stage process. The stages in this process are Audit, Examine, Survey.
-
 65442761 style essentials 2 financials 5 piece powerpoint presentation diagram infographic slide
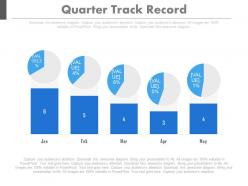
Presenting use quarter percentage track record powerpoint slides. This Power Point template slide has been crafted with graphic of percentage icons. This PPT slide contains the concept of data record analysis. Use this PPT slide for business and sales related presentations.
-
 7709962 style essentials 2 financials 3 piece powerpoint presentation diagram infographic slide
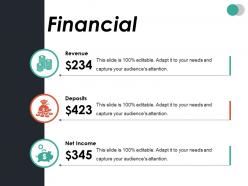
Presenting this set of slides with name - Financial Ppt Summary Professional. This is a three stage process. The stages in this process are Finance, Business, Marketing, Strategy, Icons.
-
 97184548 style essentials 2 financials 3 piece powerpoint presentation diagram infographic slide
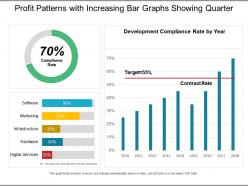
Presenting this set of slides with name - Profit Patterns With Increasing Bar Graphs Showing Quarter. This is a three stage process. The stages in this process are Engineering, Procurement And Construction, Construction Management, Engineering, Purchasing And Construction .
-
 40218787 style essentials 2 financials 4 piece powerpoint presentation diagram infographic slide
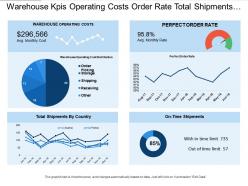
Presenting this set of slides with name - Warehouse Kpis Operating Costs Order Rate Total Shipments Country. This is a four stage process. The stages in this process are Warehouse Kpi, Warehouse Dashboard, Warehouse Metrics.
-
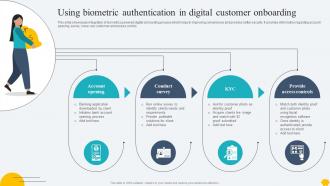 Digitalising Customer Onboarding Using Biometric Authentication In Digital Customer
This slide showcases integration of biometrics powered digital onboarding process which helps in improving convenience and provides better security. It provides information regarding account opening, survey, know your customer and access control. Introducing Digitalising Customer Onboarding Using Biometric Authentication In Digital Customer to increase your presentation threshold. Encompassed with Four stages, this template is a great option to educate and entice your audience. Dispence information on Using Biometric, Digital Customer using this template. Grab it now to reap its full benefits.
-
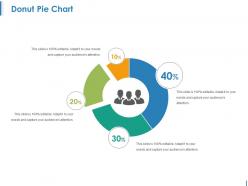 9137099 style division donut 4 piece powerpoint presentation diagram infographic slide
Presenting this set of slides with name - Donut Pie Chart Ppt Examples. This is a four stage process. The stages in this process are Donut Pie Chart, Finance, Marketing, Strategy, Analysis.
-
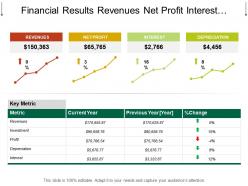 13858653 style essentials 2 financials 4 piece powerpoint presentation diagram infographic slide
Presenting, Financial Results Revenues Net Profit Interest Depreciation PowerPoint template. This presentation slide is beneficial for managers, employees, accountant, CA, finance manager, and organizations looking to project their business process through a flow chart. This presentation template is hundred percent editable, which means you can change the text, color, and view of the given template according to your desire. You can choose icons among the thousands of options accessible. This presentation slide is compatible with Google Slides. Ease of download and convert into jpeg or pdf format.
-
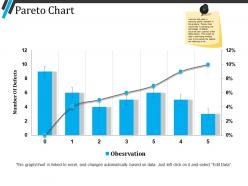 57399992 style essentials 2 financials 7 piece powerpoint presentation diagram infographic slide
Presenting pareto chart powerpoint templates. This is a pareto chart powerpoint templates. This is a seven stage process. The stages in this process are pareto chart, business, growth, finance, analysis.
-
 1977365 style essentials 2 financials 8 piece powerpoint presentation diagram infographic slide
Presenting this set of slides with name - Government And Public Works Kpi Dashboard Showing Criminal Records. This is a eight stage process. The stages in this process are Government And Public Works, Government And Public Tasks.
-
 37590182 style essentials 2 financials 3 piece powerpoint presentation diagram infographic slide
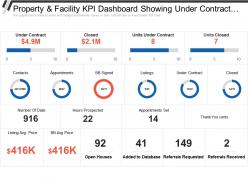
Get a chance to explore, property and facility KPI dashboard showing under contract closed and monthly team pacing KPI dashboard PowerPoint Presentation Slide. This Presentation has been designed by professionals and is fully editable. You can reshape the font size, font type, colors, and even the background. This Template is cordial with Google Slide and can be saved in JPG or PDF format without any resistance created. Fast download at the click of the button.
-
 5619954 style essentials 2 financials 3 piece powerpoint presentation diagram template slide
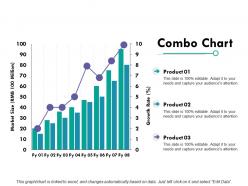
Presenting this set of slides with name - Combo Chart Finance Ppt Powerpoint Presentation Diagram Graph Charts. This is a three stage process. The stages in this process are Combo Chart, Product, Growth Rate, Market Size, Finance.
-
 76993999 style essentials 2 financials 1 piece powerpoint presentation diagram infographic slide
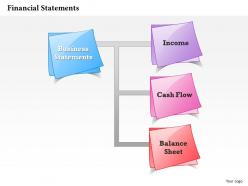
Slide runs smoothly on all related software. PPT slides can be deployed in a simple and direct manner. More customization options by affixing your company’s logo, trademark. No space constraints while adding elements. PPT graphics don’t pixelate when projected on widescreen. Changeable layout including font, text, color and design. Append title and sub-title at will. Compatible with Google slides for better shared information distribution.
-
 33112722 style concepts 1 growth 5 piece powerpoint presentation diagram infographic slide
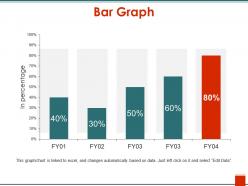
Presenting the Bar Graph PowerPoint Ideas template. The template is fully editable in MS PowerPoint and other similar software. Modify the font type, size, diagram color, background color, etc. according to your needs. The slide is also compatible with Google Slides and can be saved in numerous images or document formats such as JPG or PDF. High-quality graphics ensure that pixelation does not arise.
-
 36940311 style essentials 2 financials 4 piece powerpoint presentation diagram infographic slide
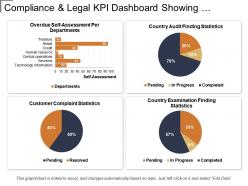
Presenting this set of slides with name - Compliance And Legal Kpi Dashboard Showing Self-Assessment Per Department. This is a four stage process. The stages in this process are Compliance And Legal, Legal Governance, Risk Management.
-
 15605836 style essentials 2 financials 4 piece powerpoint presentation diagram infographic slide
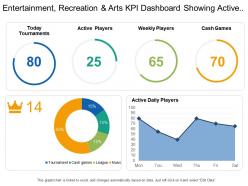
Presenting this set of slides with name - Entertainment Recreation And Arts Kpi Dashboard Showing Active Daily Players And Today Tournaments. This is a four stage process. The stages in this process are Entertainment, Recreation And Arts, Attractions, Culture, Entertainment.
-
 6154852 style essentials 2 financials 5 piece powerpoint presentation diagram infographic slide
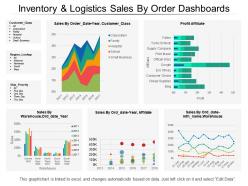
Presenting this set of slides with name - Inventory And Logistics Sales By Order Dashboards. This is a five stage process. The stages in this process are Inventory And Logistics, Inventory Management, Warehousing And Inventory Management.
-
 17348758 style division donut 5 piece powerpoint presentation diagram infographic slide
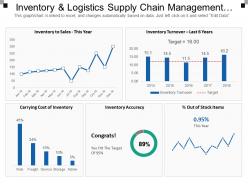
Presenting inventory and logistics supply chain management dashboards PowerPoint template. Access to edit the content, style, size and orientation of the PPT slides. Extremely spacious to cover all the aspects of the company profile. High resolution images do not pixelate when projected on wide screen. Personalize the PPT with your company name and logo. Modify the presentation elements as per the need of an hour. Compatible with numerous software and format options. Used by entrepreneurs, marketers, managerial department, stakeholders and students. Self-explanatory and intellectual slide charts.
-
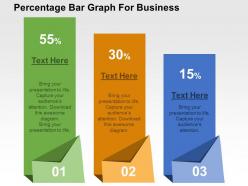 14346313 style essentials 2 financials 3 piece powerpoint presentation diagram infographic slide
We are proud to present our percentage bar graph for business flat powerpoint design. This power point template diagram has been crafted with graphic of percentage and bar graph. This PPT diagram contains the concept of financial analysis. Use this PPT diagram for business and finance related presentations.


