Financial Reviews and Accounting PPT Slides
-
 97722968 style essentials 1 agenda 6 piece powerpoint presentation diagram infographic slide
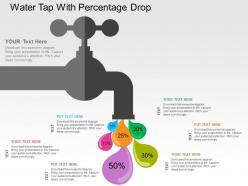
We are proud to present our water tap with percentage drop flat powerpoint design. Graphic of water tap and percentage drop has been used to craft this power point template diagram. This PPT diagram contains the concept of financial interest calculation. Use this PPT diagram for business and finance related presentations.
-
 17458092 style concepts 1 growth 3 piece powerpoint presentation diagram infographic slide
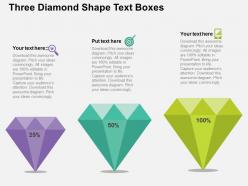
We are proud to present our three diamond shape text boxes flat powerpoint design. Three diamond shape text boxes has been used to craft this power point template diagram. This PPT diagram contains the concept of business data representation. Use this PPT diagram for business and management related presentations.
-
 32402461 style essentials 2 financials 2 piece powerpoint presentation diagram infographic slide
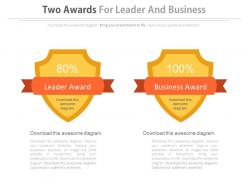
Presenting two awards for leader and business powerpoint slides. This Power Point template slide has been crafted with graphic of two awards. This PPT slide contains the concept of success milestones representation. Use this PPT slide for business and finance related presentations.
-
 46730994 style essentials 2 financials 4 piece powerpoint presentation diagram infographic slide
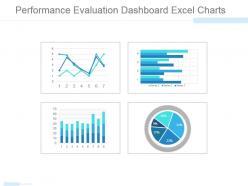
Presenting performance evaluation dashboard excel charts powerpoint topics. This is a performance evaluation dashboard excel charts powerpoint topics. This is a four stage process. The stages in this process are graph, finance, dashboard, pie, business.
-
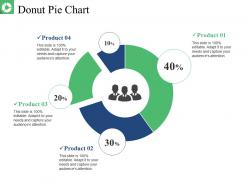 21004700 style division donut 4 piece powerpoint presentation diagram infographic slide
Presenting this set of slides with name - Donut Pie Chart Presentation Layouts. This is a four stage process. The stages in this process are Donut Pie Chart, Finance, Marketing, Strategy, Analysis.
-
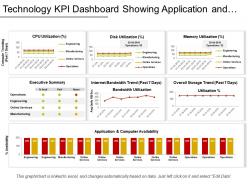 98560201 style essentials 2 financials 7 piece powerpoint presentation diagram infographic slide
Presenting this set of slides with name - Technology Kpi Dashboard Showing Application And Compute Availability. This is a seven stage process. The stages in this process are Technology, IT, IOT.
-
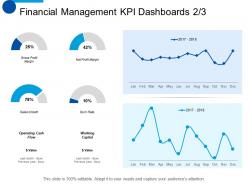 84618710 style essentials 2 financials 6 piece powerpoint presentation diagram infographic slide
Presenting this set of slides with name - Financial Management KPI Dashboards Snapshot Planning Ppt Summary Smartart. This is a six stage process. The stages in this process are Sales Growth, Gross Profit Margin, Net Profit Margin, Planning, Marketing.
-
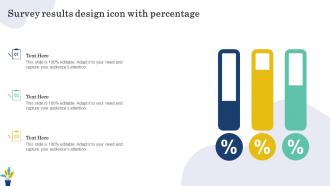 Survey Results Design Icon With Percentage
Introducing our premium set of slides with name Survey Results Design Icon With Percentage. Ellicudate the three stages and present information using this PPT slide. This is a completely adaptable PowerPoint template design that can be used to interpret topics like Survey, Results Design, Icon With Percentage. So download instantly and tailor it with your information.
-
 Sales Management Report Icon With Key Insights
Introducing our premium set of slides with Sales Management Report Icon With Key Insights. Elucidate the four stages and present information using this PPT slide. This is a completely adaptable PowerPoint template design that can be used to interpret topics like Sales Management Report, Icon, Key Insights. So download instantly and tailor it with your information.
-
 Digital Transformation In Wealth Management Icon For Automating Services
Introducing our premium set of slides with Digital Transformation In Wealth Management Icon For Automating Services. Ellicudate the three stages and present information using this PPT slide. This is a completely adaptable PowerPoint template design that can be used to interpret topics like Digital Transformation, Wealth Management Icon, Automating Services. So download instantly and tailor it with your information.
-
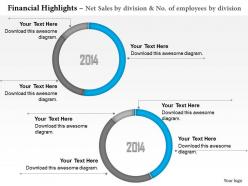 62596348 style essentials 2 financials 1 piece powerpoint presentation diagram infographic slide
They provide easy and simple way of displaying your financial status on yearly basis. They have the tendency to cover the significant aspects while executing the annual financial sales report. They have a unique and dynamic appearance. They support various formats. These illustrations have a completely professional look and feel.
-
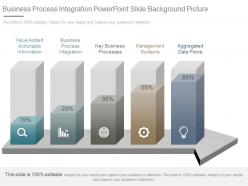 5535599 style essentials 2 financials 5 piece powerpoint presentation diagram infographic slide
Presenting business process integration powerpoint slide background picture. This is a business process integration powerpoint slide background picture. This is a five stage process. The stages in this process are value added actionable information, business process integration, key business processes, management systems, aggregated data flows.
-
 12903886 style essentials 2 dashboard 2 piece powerpoint presentation diagram infographic slide
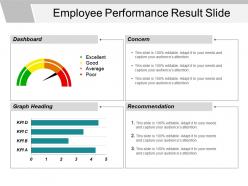
Presenting Employee Performance Result Slide PowerPoint Slide Influencers. Download this slide and save this in JPG and PDF formats along with the various other formats. A user can display this employee performance result template on either standard or wide screen. The infographic performance slide design is completely compatible with Google Slides and fully customizable in PowerPoint. Sharing of employee performance slide with large segment is easy due to its superb pixel quality. You can modify the color, text, font style & font size and aspect ratio of this infographic employee performance slide.
-
 76047564 style essentials 2 financials 3 piece powerpoint presentation diagram infographic slide
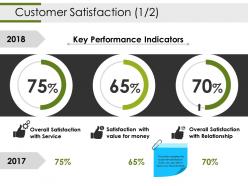
Presenting customer satisfaction powerpoint slide backgrounds. This is a customer satisfaction powerpoint slide backgrounds. This is a three stage process. The stages in this process are donut, marketing, planning, finance, success.
-
 80561482 style essentials 2 financials 4 piece powerpoint presentation diagram infographic slide
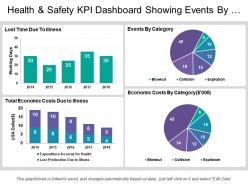
Presenting health and safety presentation template. This modern dashboard design is fully editable and is created under the strict supervision of professionals. You can bring changes to the objects in the slide like font size and font color hassle-free. This presentation slide is fully compatible with Google Slide and can be saved in JPG or PDF file format without any hassle. Fast download this at the click of the button.
-
 61814001 style essentials 2 financials 6 piece powerpoint presentation diagram infographic slide
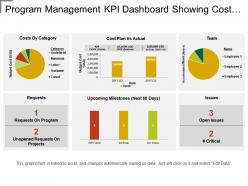
Presenting this set of slides with name - Program Management Kpi Dashboard Showing Cost Plan Vs Actual. This is a six stage process. The stages in this process are Program Development, Human Resource Management, Program Management.
-
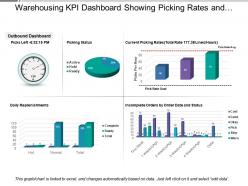 65970131 style essentials 2 financials 5 piece powerpoint presentation diagram infographic slide
The professionally built, business oriented slide is completely editable; you can modify and customize the design according to your business needs. You may include business logo, trademarks to personalize the slideshow. The slideshow can be opened and updated with Google Slides and MS PowerPoint software. Quick and easy downloading available; PPT design can be downloaded as JPEG or PDF format.
-
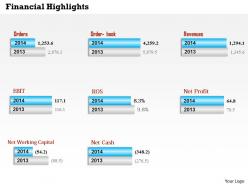 17354527 style essentials 2 financials 1 piece powerpoint presentation diagram infographic slide
High quality PPT graphics don’t pixelate when projected on large screen. Widely used by financiers, finance department, business managers and planners for translating information. 100 percent editable PowerPoint colors, orientation, text and graphics. Easy inclusion of company name, trademark and logo. Compatible with multiple number of online and offline software. Flexible option for conversion in PDF or JPG formats.
-
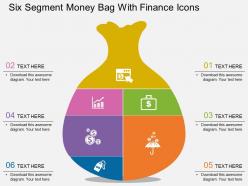 2561336 style essentials 2 financials 6 piece powerpoint presentation diagram infographic slide
Presenting bh six segment money bag with finance icons flat powerpoint design. Six segment money bag and finance icons have been used to craft this power point template diagram. This PPT diagram contains the concept of financial investment analysis. Use this PPT diagram can be used for business and finance related presentations.
-
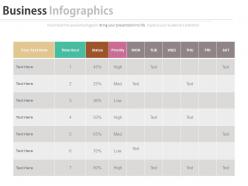 32541079 style essentials 2 financials 1 piece powerpoint presentation diagram infographic slide
Presenting business time management sheet daily activity plan schedule powerpoint slides. This Power Point template slide has been crafted with graphic of activity plan and time icons. This PPT slide contains the concept of business time management and planning. Use this PPT slide for business and marketing related presentations.
-
 58817951 style essentials 2 financials 4 piece powerpoint presentation diagram infographic slide
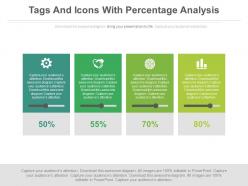
Presenting four tags and icons with percentage analysis powerpoint slides. This Power Point template diagram with graphic of four staged tags and icons. This PPT diagram contains the concept of percentage analysis. Use this PPT diagram for business and finance related presentations.
-
 93603866 style essentials 2 financials 6 piece powerpoint presentation diagram infographic slide
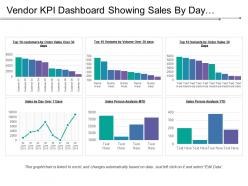
Presenting this set of slides with name - Vendor Kpi Dashboard Showing Sales By Day Sales Person Analysis Top 10 Customers By Order Value. This is a six stage process. The stages in this process are Vendor, Supplier, Retailer.
-
 12154556 style essentials 2 financials 3 piece powerpoint presentation diagram infographic slide
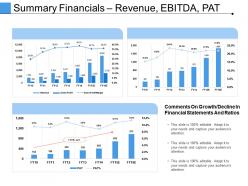
Presenting this set of slides with name - Summary Financials Revenue Ebitda Pat Powerpoint Slide Designs. This is a three stage process. The stages in this process are Finance, Marketing, Bar, Planning, Growth.
-
 53451463 style essentials 2 financials 5 piece powerpoint presentation diagram infographic slide
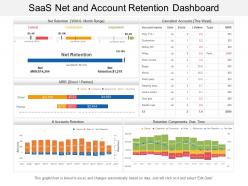
Presenting this set of slides with name - Saas Net And Account Retention Dashboard. Awesome blend colors, font and shape. PowerPoint template is completely flexible with Google slides and simply alterable into JPEG and PDF. Choice edits and personalizes the PPT design by including the business symbol. Similar designs come with different nodes and stages. Easy to portray in standard and widescreen view options and can be shared with large set of audience. Download is fast and saves valuable time. High resolution and awesome quality Presentation slide.
-
 Corporate Financials Month End Calendar Icon
Introducing our premium set of slides with Corporate Financials Month End Calendar Icon. Ellicudate the three stages and present information using this PPT slide. This is a completely adaptable PowerPoint template design that can be used to interpret topics like Corporate Financials Month End Calendar Icon. So download instantly and tailor it with your information.
-
 Why Invest With Us Curie Investor Funding Elevator Pitch Deck
This slide represents the benefits an investor is getting on investing in us. It includes benefits such as higher dividend yield, high return on investment and international expansion. Increase audience engagement and knowledge by dispensing information using Why Invest With Us Curie Investor Funding Elevator Pitch Deck. This template helps you present information on three stages. You can also present information on Financial Gains, Return On Investment using this PPT design. This layout is completely editable so personaize it now to meet your audiences expectations.
-
 97945843 style essentials 2 financials 1 piece powerpoint presentation diagram infographic slide
100% alterable content, shades, images, hue etc. of PowerPoint images, Adequate space provided to insert text, titles and subtitles, Simply click to add logo, trademark or name, Flexibility to convert into various file configuration like PDF or JPG, Ready to use or instant downloading options available hence saves time, Runs efficiently with other software’s, well versed with all Google slides, high quality PPT graphics which are quite effective when projected on larger screen.
-
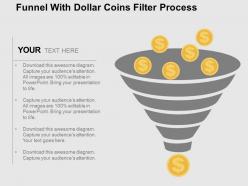 66503568 style essentials 2 financials 1 piece powerpoint presentation diagram infographic slide
We are proud to present our fh funnel with dollar coins filter process flat powerpoint design. This power point template diagram has been crafted with graphic of funnel and dollar coins. This PPT diagram contains the concept of filter process .Use this PPT diagram for business and management related presentations.
-
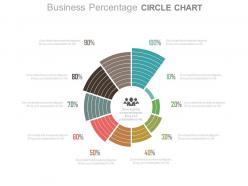 3864599 style essentials 2 financials 10 piece powerpoint presentation diagram infographic slide
Presenting ten staged business percentage circle chart powerpoint slides. This Power Point template diagram slide has been crafted with graphic of ten staged circle chart diagram. This PPT diagram contains the concept of business data analysis. Use this PPT diagram for business and finance related presentations.
-
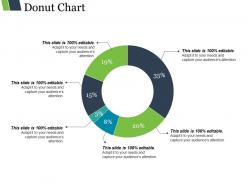 64961481 style division donut 6 piece powerpoint presentation diagram infographic slide
Presenting donut chart presentation ideas. This is a donut chart presentation ideas. This is a six stage process. The stages in this process are percentage, finance, donut, business.
-
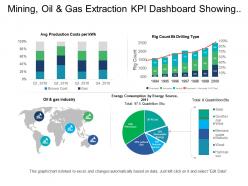 43029827 style essentials 2 financials 4 piece powerpoint presentation diagram infographic slide
Presenting this set of slides with name - Mining Oil And Gas Extraction Kpi Dashboard Showing Average Production Costs And Energy Consumption. This is a four stage process. The stages in this process are Mining, Oil And Gas Extraction, Refinery, Natural Gas.
-
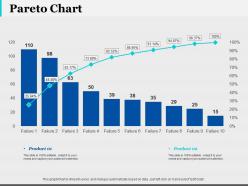 98188073 style essentials 2 financials 2 piece powerpoint presentation diagram infographic slide
This is a two stage process. The stages in this process are Finance, Analysis, Business, Investment, Marketing.
-
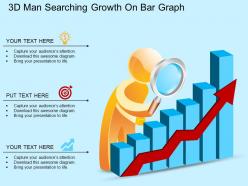 22379012 style concepts 1 growth 3 piece powerpoint presentation diagram infographic slide
Presenting eb 3d man searching growth on bar graph powerpoint template. This Power Point template diagram has been crafted with graphic of 3d man and bar graph. This PPT diagram contains the concept of growth. Use this PPT diagram for business and marketing related presentations.
-
 76301312 style concepts 1 growth 5 piece powerpoint presentation diagram infographic slide
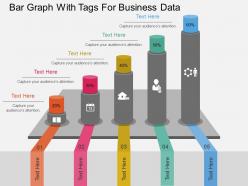
Presenting pptx bar graph with tags for business data flat powerpoint design. This Power Point template diagram has been crafted with graphic of bar graph and tags icons. This PPT diagram contains the concept of business data analysis and business planning. Use this PPT diagram for business and finance related presentations.
-
 68967335 style essentials 2 financials 8 piece powerpoint presentation diagram infographic slide
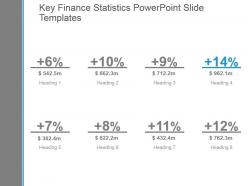
Presenting key finance statistics powerpoint slide templates. This is a key finance statistics powerpoint slide templates. This is a eight stage process. The stages in this process are business, success, strategy, management, marketing, process.
-
 51421674 style essentials 2 financials 4 piece powerpoint presentation diagram infographic slide
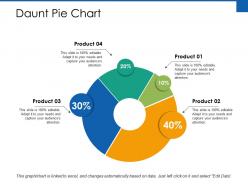
Presenting this set of slides with name - Daunt Pie Chart Ppt Powerpoint Presentation Summary. This is a four stages process. The stages in this process are Finance, Marketing, Management, Investment, Analysis.
-
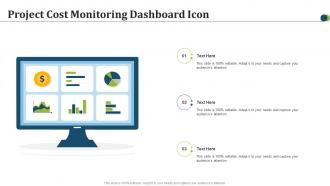 Project Cost Monitoring Dashboard Icon
Introducing our premium set of slides with Project Cost Monitoring Dashboard Icon. Ellicudate the three stages and present information using this PPT slide. This is a completely adaptable PowerPoint template design that can be used to interpret topics like Project Cost Monitoring, Dashboard Icon. So download instantly and tailor it with your information.
-
 Business Transformation Cost Reduction Icon
Presenting our set of slides with Business Transformation Cost Reduction Icon. This exhibits information on three stages of the process. This is an easy to edit and innovatively designed PowerPoint template. So download immediately and highlight information on Business Transformation, Cost Reduction.
-
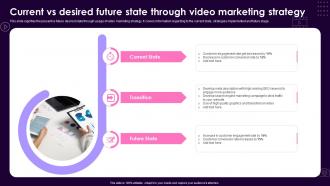 Current Vs Desired Future State Through Video Marketing Strategy
This slide signifies the present vs future desired state through usage of video marketing strategy. It covers information regarding to the current state, strategies implemented and future stage. Presenting our set of slides with name Current Vs Desired Future State Through Video Marketing Strategy. This exhibits information on three stages of the process. This is an easy-to-edit and innovatively designed PowerPoint template. So download immediately and highlight information on Current State, Transition, Future State.
-
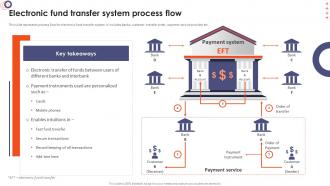 Online Banking Management Electronic Fund Transfer System Process Flow
This slide represents process flow for electronic fund transfer system. It includes banks, customer, transfer order, payment service provider etc. Introducing Online Banking Management Electronic Fund Transfer System Process Flow to increase your presentation threshold. Encompassed with five stages, this template is a great option to educate and entice your audience. Dispence information on Payment Instruments, Secure Transactions, Fast Fund Transfer, Electronic Fund Transfer, using this template. Grab it now to reap its full benefits.
-
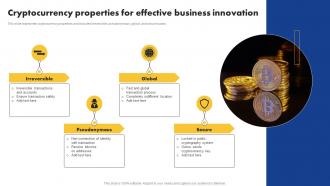 Cryptocurrency Properties For Effective Business Innovation
This slide represents cryptocurrency properties and includes irreversible, pseudonymous, global, and secure bases. Presenting our set of slides with Cryptocurrency Properties For Effective Business Innovation. This exhibits information on four stages of the process. This is an easy to edit and innovatively designed PowerPoint template. So download immediately and highlight information on Irreversible, Pseudonymous, Global.
-
 55162865 style essentials 2 financials 2 piece powerpoint presentation diagram infographic slide
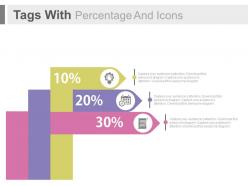
Presenting three tags with percentage and icons powerpoint slides. This Power Point template slide has been crafted with graphic of three tags and percentage diagram. This PPT slide contains the concept of financial data analysis. Use this PPT slide for business and finance related presentations.
-
 43064529 style essentials 2 financials 4 piece powerpoint presentation diagram infographic slide
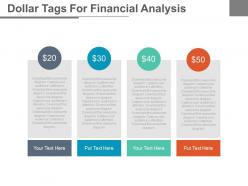
Presenting four dollar tags for financial analysis powerpoint slides. This Power Point template diagram with graphic of four dollar tags. This PPT diagram contains the concept of financial analysis. Use this PPT diagram for business and finance related presentations.
-
 88425089 style essentials 2 financials 2 piece powerpoint presentation diagram infographic slide
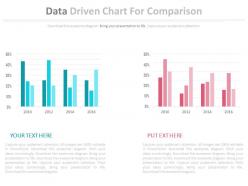
Presenting two data driven chart for comparison powerpoint slides. This Power Point template diagram with graphic of two data driven chart diagram. This PPT diagram contains the concept of data comparison analysis. Use this PPT diagram for business and finance related presentations.
-
 70875860 style layered horizontal 3 piece powerpoint presentation diagram infographic slide
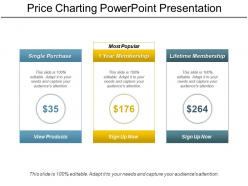
Presenting price charting PowerPoint presentation slideshow which is 100% editable. This PPT template is crafted with attractive display and unique components. This PPT slide is easy to customize and enables you to personalize it as per your own criteria. The presentation slide is fully compatible with Google slides, multiple format and software options. In case of any assistance, kindly take instructions from our presentation design services and it is easy to download in a very short span of time. The images, layouts, designs are of high quality and ensures quality in widescreen.
-
 92601889 style division pie 8 piece powerpoint presentation diagram infographic slide
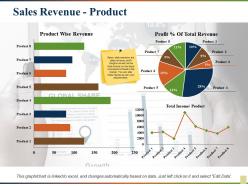
Presenting this set of slides with name - Sales Revenue Product Revenue New Customers Gross Profit. This is a eight stage process. The stages in this process are Product Wise Revenue, Profit Percentage Of Total Revenue, Total Income, Product.
-
 87851501 style essentials 2 financials 4 piece powerpoint presentation diagram infographic slide
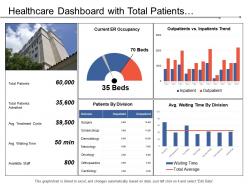
Presenting this set of slides with name - Healthcare Dashboard With Total Patients Admitted And Average Treatment Cost. This is a four stage process. The stages in this process are Healthcare, Health Improvement, Medical Care.
-
 23706782 style essentials 2 financials 5 piece powerpoint presentation diagram infographic slide
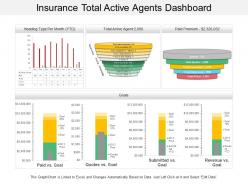
• Multi colored beautifully designed visuals • Easy to download • Easy to customize and personalize • Ease of inclusion and exclusion of slide content as per company specific data • Thoroughly editable slides • High resolution visuals • Compatible with Google slides • Compatible with numerous forms format options available in market • Harmonious with multiple software options • Used by business analysts, insurance companies, insurance employees, and other such professionals.
-
 4932513 style essentials 2 financials 4 piece powerpoint presentation diagram infographic slide
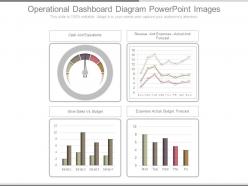
Presenting operational dashboard diagram powerpoint images. This is a operational dashboard diagram powerpoint images. This is a four stage process. The stages in this process are cash and equivalents, revenue and expenses actual and forecast, store sales vs budget, expenses actual budget forecast.
-
 3838762 style essentials 2 dashboard 3 piece powerpoint presentation diagram template slide
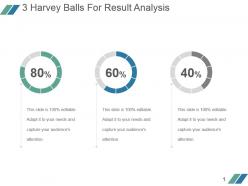
Presenting 3 harvey balls for result analysis example of ppt. This is a 3 harvey balls for result analysis example of ppt. This is a three stage process. The stages in this process are finance, process, business, marketing, percentage.
-
 50520207 style division pie 4 piece powerpoint presentation diagram infographic slide
Presenting this set of slides with name - Key Statistics Powerpoint Slide Templates. This is a four stage process. The stages in this process are Pie Chart, Marketing, Analysis, Strategy, Business.
-
 88399143 style essentials 2 financials 4 piece powerpoint presentation diagram template slide
Presenting this set of slides with name - Workforce Kpi Dashboard Showing Average Age Female Percentage And Average Tenure. This is a four stage process. The stages in this process are Staff, Personnel, Workforce.
-
 69174809 style essentials 2 financials 4 piece powerpoint presentation diagram infographic slide
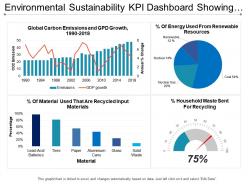
Presenting this set of slides with name - Environmental Sustainability Kpi Dashboard Showing Global Carbon Emission And Gdp Growth. This is a four stage process. The stages in this process are Environment Sustainability, Environment Continual, Environment Feasibility.
-
 75931426 style hierarchy matrix 1 piece powerpoint presentation diagram infographic slide
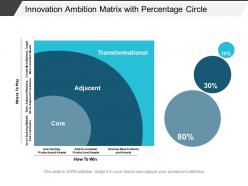
Presenting this set of slides with name - Innovation Ambition Matrix With Percentage Circle. This is a one stage process. The stages in this process are Innovation Ambition Matrix, Innovation Management, Innovation Strategy.
-
 9176052 style essentials 2 financials 6 piece powerpoint presentation diagram infographic slide
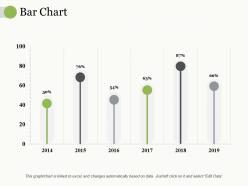
Presenting this set of slides with name - Bar Chart Ppt Professional Designs Download. This is a six stage process. The stages in this process are Business, Marketing, Percentage, Product.
-
 52225186 style essentials 2 financials 4 piece powerpoint presentation diagram infographic slide
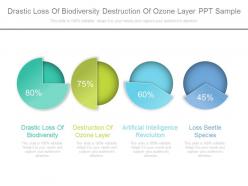
Presenting drastic loss of biodiversity destruction of ozone layer ppt sample. This is a drastic loss of biodiversity destruction of ozone layer ppt sample. This is a four stage process. The stages in this process are drastic loss of biodiversity, destruction of ozone layer, artificial intelligence revolution, loss beetle species.
-
 34549439 style essentials 2 financials 2 piece powerpoint presentation diagram infographic slide
Presenting opportunity cost time and money balance. This is a opportunity cost time and money balance. This is a two stage process. The stages in this process are alternative cost, opportunity cost, alternative price, expected return.
-
 44311811 style essentials 2 financials 3 piece powerpoint presentation diagram infographic slide
Presenting this set of slides with name - Business Transformation Business Woman Paperwork Planning. This is a three stage process. The stages in this process are Transformation Process, Digital Transformation, Business Transformation.
-
 25402990 style layered vertical 6 piece powerpoint presentation diagram infographic slide
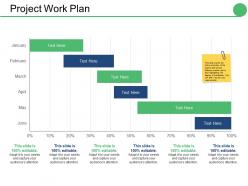
Presenting this set of slides with name - Project Work Plan Ppt Infographics Vector. This is a six stage process. The stages in this process are Month, Business, Step, Management, Percentage.
-
 91436544 style essentials 2 financials 3 piece powerpoint presentation diagram infographic slide
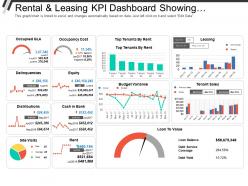
Presenting this set of slides with name - Rental And Leasing Kpi Dashboard Showing Occupancy Cost Equity Loan To Value. This is a three stage process. The stages in this process are Rental And Leasing, Dealing And Leasing, Rental And Engage.


