Financial Reviews and Accounting PPT Slides
-
 91436544 style essentials 2 financials 3 piece powerpoint presentation diagram infographic slide
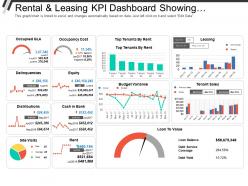
Presenting this set of slides with name - Rental And Leasing Kpi Dashboard Showing Occupancy Cost Equity Loan To Value. This is a three stage process. The stages in this process are Rental And Leasing, Dealing And Leasing, Rental And Engage.
-
 63062872 style essentials 2 financials 4 piece powerpoint presentation diagram infographic slide
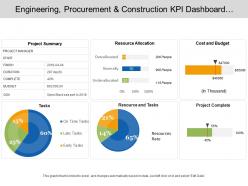
Presenting this set of slides with name - Engineering Procurement And Construction Kpi Dashboard Showing Project Summary Cost And Budget. This is a four stage process. The stages in this process are Engineering, Procurement And Construction, Construction Management, Engineering, Purchasing And Construction .
-
 12605361 style essentials 2 financials 5 piece powerpoint presentation diagram infographic slide
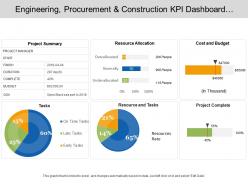
Presenting this set of slides with name - Engineering Procurement And Construction Kpi Dashboard Showcasing Project Summary Cost And Budget. This is a five stage process. The stages in this process are Engineering, Procurement And Construction, Construction Management, Engineering, Purchasing And Construction .
-
 App metrics dashboard ppt powerpoint presentation icon model
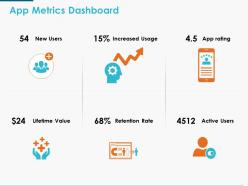
This is a six stage process. The stages in this process are Finance, Analysis, Business, Investment, Marketing.
-
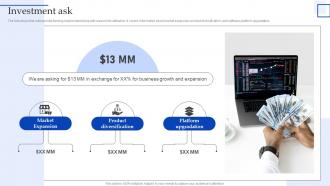 Investment Ask Sample Pitch Deck For Asset Management
The following slide outlines total funding requirement along with reasons for utilization. It covers information about market expansion, product diversification, and software platform upgradation. Introducing Investment Ask Sample Pitch Deck For Asset Management to increase your presentation threshold. Encompassed with four stages, this template is a great option to educate and entice your audience. Dispence information on Market Expansion, Product Diversification, Platform Upgradation, using this template. Grab it now to reap its full benefits.
-
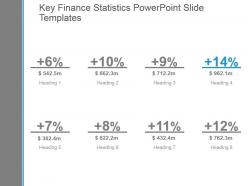 68967335 style essentials 2 financials 8 piece powerpoint presentation diagram infographic slide
Presenting key finance statistics powerpoint slide templates. This is a key finance statistics powerpoint slide templates. This is a eight stage process. The stages in this process are business, success, strategy, management, marketing, process.
-
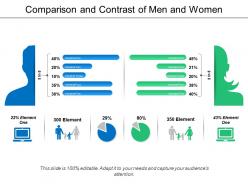 61999650 style essentials 2 financials 4 piece powerpoint presentation diagram infographic slide
Presenting this set of slides with name - Comparison And Contrast Of Men And Women. This is a four stage process. The stages in this process are Comparison Of Two, Compare, comeptitive analysis.
-
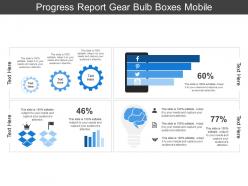 62608871 style essentials 2 financials 4 piece powerpoint presentation diagram infographic slide
Presenting this set of slides with name - Progress Report Gear Bulb Boxes Mobile. This is a four stage process. The stages in this process are Progress Report, Growth Report, Improvement Report.
-
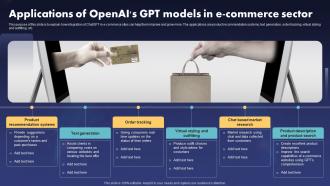 Chatgpt IT Applications Of Openais Gpt Models In E Commerce Sector
This purpose of this slide is to explain how integration of ChatGPT in e commerce sites can help them improve and grow more. The applications are product recommendation systems, text generation, order tracking, virtual styling and outfitting, etc. Introducing Chatgpt IT Applications Of Openais Gpt Models In E Commerce Sector to increase your presentation threshold. Encompassed with six stages, this template is a great option to educate and entice your audience. Dispence information on Order Tracking, Product Recommendation Systems, Chat Based Market Research, using this template. Grab it now to reap its full benefits.
-
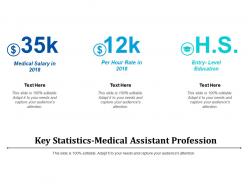 93550617 style linear single 3 piece powerpoint presentation diagram infographic slide
Presenting this set of slides with name - Key Statistics-Medical Assistant Profession. This is a three stage process. The stages in this process are Medical Assistant, Medical Help, Medical Support.
-
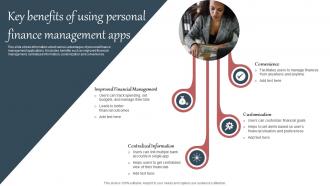 Everything About Mobile Banking Key Benefits Of Using Personal Finance Management Apps Fin SS V
This slide shows information about various advantages of personal finance management applications. It includes benefits such as improved financial management, centralized information, customization and convenience. Increase audience engagement and knowledge by dispensing information using Everything About Mobile Banking Key Benefits Of Using Personal Finance Management Apps Fin SS V. This template helps you present information on four stages. You can also present information on Improved Financial Management, Centralized Information, Convenience, Customization using this PPT design. This layout is completely editable so personaize it now to meet your audiences expectations.
-
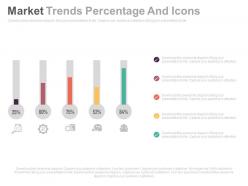 30613672 style essentials 2 financials 5 piece powerpoint presentation diagram infographic slide
Presenting five staged market trends percentage and icons powerpoint slides. This Power Point template slide has been crafted with graphic of five staged percentage and icons. This PPT slide contains the concept of financial growth analysis. Use this PPT slide for business and finance related presentations.
-
 85882693 style essentials 2 financials 4 piece powerpoint presentation diagram infographic slide
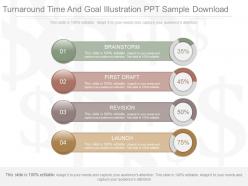
Presenting pptx turnaround time and goal illustration ppt sample download. This is a turnaround time and goal illustration ppt sample download. This is a four stage process. The stages in this process are brainstorm, first draft, revision, launch.
-
 4404606 style essentials 2 financials 5 piece powerpoint presentation diagram infographic slide
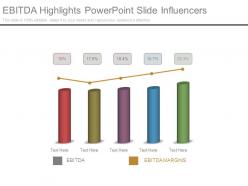
Presenting ebitda highlights powerpoint slide influencers. This is a ebitda highlights powerpoint slide influencers. This is a five stage process. The stages in this process are graph chart, strategy, management, business, success.
-
 53501075 style essentials 2 financials 3 piece powerpoint presentation diagram infographic slide
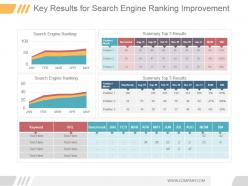
Presenting key results for search engine ranking improvement good ppt example. This is a key results for search engine ranking improvement good ppt example. This is a three stage process. The stages in this process are search engine ranking, summary top 3 results, jan, feb, mar, apr, may, position month, position, aug, sep, oct, nov, dec, mom, bm, url, keyword.
-
 92934498 style essentials 2 financials 3 piece powerpoint presentation diagram infographic slide
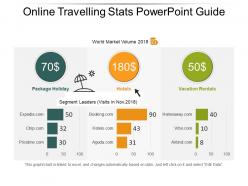
Presenting online traveling stats PowerPoint guide. Quickly adjust the color schemes used here and join text to personalize the layout. Compatible with Google Slides and can be converted into jpg or pdf formats by ensuring a few steps. This PPT deck can be easily converted into pdf or jpeg format just by following a few simsple steps. Include your traveling plans/packages in this PPT design and use in both standard 4:3 and widescreen format 16:9 after downloading. This is an entirely editable and high-resolution design which do not pixelate when elongated on a widescreen. Download this predesigned format in seconds.
-
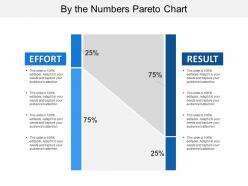 27577290 style essentials 2 financials 2 piece powerpoint presentation diagram infographic slide
Presenting this set of slides with name - By The Numbers Pareto Chart. This is a two stage process. The stages in this process are By The Numbers, Numerology, Number Series.
-
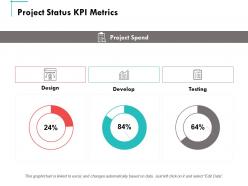 38022365 style essentials 2 financials 3 piece powerpoint presentation diagram infographic slide
Presenting this set of slides with name - Project Status Kpi Metrics Develop Ppt Powerpoint Presentation Summary Aids. This is a three stages process. The stages in this process are Finance, Marketing, Management, Investment, Analysis.
-
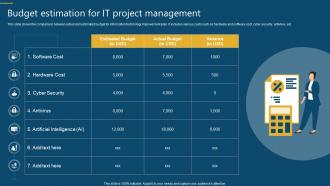 Budget Estimation For It Project Management
This slide shows the comparison between actual and estimated budget for information technology improvement plan. It includes various costs such as hardware and software cost, cyber security, antivirus, etc. Presenting our set of slides with name Budget Estimation For It Project Management. This exhibits information on one stages of the process. This is an easy-to-edit and innovatively designed PowerPoint template. So download immediately and highlight information on Cyber Security, Antivirus, Hardware Cost.
-
 Robotic Process Automation KPI Icon
Introducing our premium set of slides with Robotic Process Automation KPI Icon. Ellicudate the three stages and present information using this PPT slide. This is a completely adaptable PowerPoint template design that can be used to interpret topics like Robotic Process, Automation Kpi Icon. So download instantly and tailor it with your information.
-
 25402990 style layered vertical 6 piece powerpoint presentation diagram infographic slide
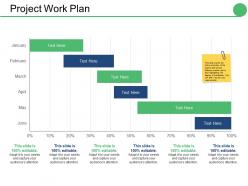
Presenting this set of slides with name - Project Work Plan Ppt Infographics Vector. This is a six stage process. The stages in this process are Month, Business, Step, Management, Percentage.
-
 26824926 style essentials 2 financials 1 piece powerpoint presentation diagram infographic slide
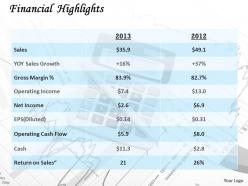
Presentation slide is beneficial for clients, managers, project in charge, financial sector and business conferences. Color, style and position can be standardized, supports font size which can be read from a distance. PPT slide is compatible with Microsoft 2010 and 2013 versions. Text and graphics can be placed on the slide. PPT diagram 100% compatible with Google slide.
-
 68538042 style essentials 2 financials 1 piece powerpoint presentation diagram infographic slide
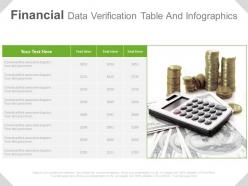
Presenting financial data verification table and infographics powerpoint slides. This Power Point template slide has been crafted with graphic of data verification table and info graphics. This PPT slide contains the concept of financial data analysis. Use this PPT slide for business and finance related presentations.
-
 2709664 style essentials 2 financials 4 piece powerpoint presentation diagram template slide
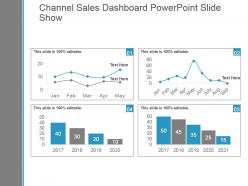
Presenting channel sales dashboard powerpoint slide show. This is a channel sales dashboard powerpoint slide show. This is a four stage process. The stages in this process are business, marketing, line chart, dashboard, management.
-
 41703379 style layered vertical 11 piece powerpoint presentation diagram template slide
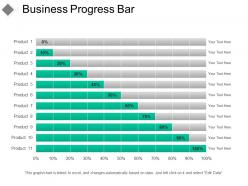
Presenting Business Progress Bar Sample Of PPT template. This slide is designed according to your specific needs. You can include a wide range of custom made slides with all sorts of relevant charts and graphs. Download this PowerPoint template in both widescreen(16:9) and standard screen(4:3) sizes. The layout is completely supported by Google Slides. This slide can be saved into JPG or PDF format can be done with just the click of a button.
-
 38041750 style essentials 2 financials 3 piece powerpoint presentation diagram infographic slide
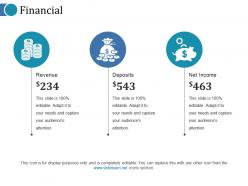
Presenting this set of slides with name - Financial Ppt Professional. This is a three stage process. The stages in this process are Financial, Business, Management, Analysis, Marketing.
-
 56976718 style essentials 2 dashboard 5 piece powerpoint presentation diagram infographic slide
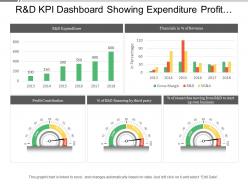
Presenting this set of slides with name - R And D Kpi Dashboard Showing Expenditure Profit Contribution And Financial In Percentage Of Revenue. This is a five stage process. The stages in this process are R And D, Research And Development, Research And Technological Development.
-
 31623030 style essentials 2 financials 5 piece powerpoint presentation diagram infographic slide
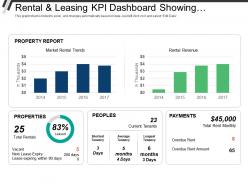
Presenting this set of slides with name - Rental And Leasing Kpi Dashboard Showing Properties People Payments Rental Revenue. This is a five stage process. The stages in this process are Rental And Leasing, Dealing And Leasing, Rental And Engage.
-
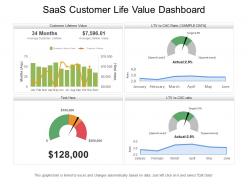 78914451 style essentials 2 financials 4 piece powerpoint presentation diagram infographic slide
Introducing Saas customer life value dashboard PPT template. An easy access to make the desired changes or edit it anyways. Wide screen view of the slides. Easy conversion into Jpeg or Pdf format. The PPT images offer compatibility with Google templates. High resolution icons for clear message delivery. Unique and informational content. Valuable for business professionals, sales representatives, marketing professionals, students and selling investigators. High quality charts and visuals used in the designing process. They enhance the performance of the presentation.
-
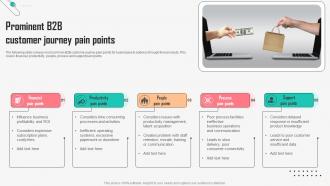 Prominent B2B Customer Journey Pain Points
The following slide conveys most common B2B customer journey pain points for businesses to address through their products. This covers financial, productivity, people, process and support pain points. Introducing our premium set of slides with Prominent B2B Customer Journey Pain Points. Ellicudate the Five stages and present information using this PPT slide. This is a completely adaptable PowerPoint template design that can be used to interpret topics like Financial Pain Points, Productivity Pain Points. So download instantly and tailor it with your information.
-
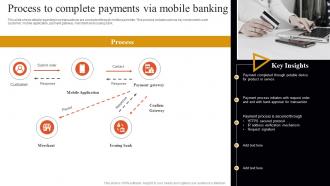 Banking Solutions For Improving Customer Process To Complete Payments Via Mobile Banking Fin SS V
This slide shows details regarding how transactions are conducted through mobile payments. This process includes various key components such customer, mobile application, payment gateway, merchant and issuing bank. Introducing Banking Solutions For Improving Customer Process To Complete Payments Via Mobile Banking Fin SS V to increase your presentation threshold. Encompassed with five stages, this template is a great option to educate and entice your audience. Dispence information on Mobile Application, Payment Gateway, Confirm Gateway, Merchant , using this template. Grab it now to reap its full benefits.
-
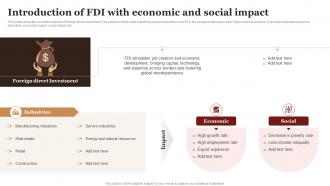 Introduction Of FDI With Economic And Social Impact Complete Guide Empower
This slide shows the complete overview of foreign direct investment. The purpose of this slide is that how various industries use FDI in the best possible way to earn higher revenue in future. It includes parameters such as industries, economic impact, social impact, etc. Introducing Introduction Of FDI With Economic And Social Impact Complete Guide Empower to increase your presentation threshold. Encompassed with two stages, this template is a great option to educate and entice your audience. Dispence information on Manufacturing Industries, Economic, Social using this template. Grab it now to reap its full benefits.
-
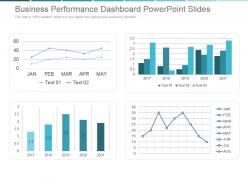 51475590 style essentials 2 financials 4 piece powerpoint presentation diagram template slide
Presenting business performance dashboard powerpoint slides. This is a business performance dashboard powerpoint slides. This is a four stage process. The stages in this process are business, chart and graph, strategy, success, line graph.
-
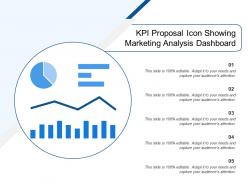 19216359 style division pie 5 piece powerpoint presentation diagram infographic slide
Presenting this set of slides with name - Kpi Proposal Icon Showing Marketing Analysis Dashboard. This is a five stage process. The stages in this process are Kpi Proposal, Kpi Plan, Kpi Scheme.
-
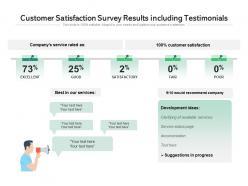 Customer satisfaction survey results including testimonials
Presenting this set of slides with name Customer Satisfaction Survey Results Including Testimonials. This is a five stage process. The stages in this process are Excellent, Good, Satisfactory, Fair, Poor. This is a completely editable PowerPoint presentation and is available for immediate download. Download now and impress your audience.
-
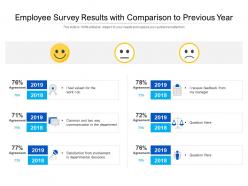 Employee survey results with comparison to previous year
Presenting this set of slides with name Employee Survey Results With Comparison To Previous Year. This is a six stage process. The stages in this process are Communication, Involvement, Departmental Decisions. This is a completely editable PowerPoint presentation and is available for immediate download. Download now and impress your audience.
-
 Project Management Cost Estimation Icon
Presenting our set of slides with Project Management Cost Estimation Icon. This exhibits information on four stages of the process. This is an easy to edit and innovatively designed PowerPoint template. So download immediately and highlight information on Project Management, Cost Estimation Icon.
-
 60038435 style concepts 1 growth 2 piece powerpoint presentation diagram infographic slide
Presenting company market size comparison chart ppt slide. This is a company market size comparison chart ppt slide. This is a two stage process. The stages in this process are business, success, strategy, finance, growth, success.
-
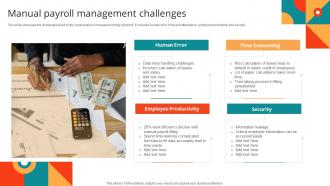 Manual Payroll Management Challenges
This slide showcase the challenges faced by the organisation in manual recording of payroll. It includes human error, time and attendance, employee productivity and security. Introducing our premium set of slides with Manual Payroll Management Challenges. Ellicudate the one stages and present information using this PPT slide. This is a completely adaptable PowerPoint template design that can be used to interpret topics like Human Error, Time Consuming, Employee Productivity, Security. So download instantly and tailor it with your information.
-
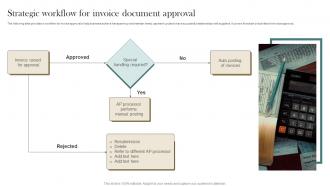 Strategic Workflow For Invoice Document Approval
The following slide provides a workflow for invoice approval to help business achieve transparency and maintain timely payment cycles to have successful relationships with suppliers. It covers flowchart of activities for invoice approval. Presenting our set of slides with Strategic Workflow For Invoice Document Approval. This exhibits information on one stages of the process. This is an easy to edit and innovatively designed PowerPoint template. So download immediately and highlight information on Strategic Workflow, Invoice Document Approval.
-
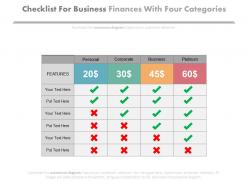 69510511 style essentials 2 financials 1 piece powerpoint presentation diagram infographic slide
Presenting checklist for business finances with four categories powerpoint slides. This is a checklist for business finances with four categories powerpoint slides. This is a one stage process. The stages in this process are financials.
-
 20785542 style linear single 3 piece powerpoint presentation diagram infographic slide
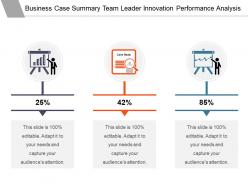
Presenting business case summary team leader innovation performance analysis. This is a business case summary team leader innovation performance analysis. This is a three stage process. The stages in this process are business case summary, business case overview, business case introduction.
-
 44399516 style essentials 2 financials 4 piece powerpoint presentation diagram infographic slide
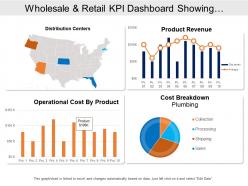
Presenting this set of slides with name - Wholesale And Retail Kpi Dashboard Showing Distribution Centers Product Revenue. This is a four stage process. The stages in this process are Wholesale And Retail, Extensive And Retail, Wholesale And Distribute.
-
 93343141 style essentials 2 financials 4 piece powerpoint presentation diagram infographic slide
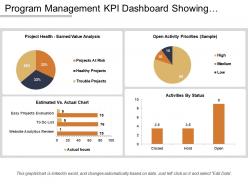
Presenting this set of slides with name - Program Management Kpi Dashboard Showing Estimated Vs Actual Chart. This is a four stage process. The stages in this process are Program Development, Human Resource Management, Program Management.
-
 83818930 style essentials 2 financials 4 piece powerpoint presentation diagram infographic slide
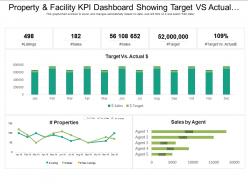
Get a chance to go through, property and facility KPI dashboard showing target-vs-actual cost and sales by agent PowerPoint Presentation Slide. This Presentation has been designed by professionals and is fully editable. You can have access to alter the font size, font type, colors, and even the background. This Template is amiable with Google Slide and can be saved in JPG or PDF format without any chaos created. Fast download at the click of the button.
-
 70433868 style essentials 2 financials 2 piece powerpoint presentation diagram infographic slide
Presenting this set of slides with name - Kpi And Dashboard Ppt Show Outfit. This is a two stage process. The stages in this process are Business, Management, Strategy, Analysis, Marketing.
-
 8717240 style concepts 1 opportunity 2 piece powerpoint presentation diagram infographic slide
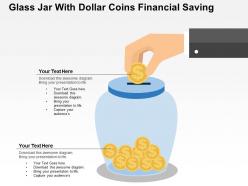
We are proud to present our glass jar with dollar coins financial saving flat powerpoint design. This power point template diagram has been crafted with graphic of glass jar and dollar coins. This PPT diagram contains the concept of financial saving. Use this PPT diagram for business and finance related presentations.
-
 80781080 style essentials 2 financials 4 piece powerpoint presentation diagram template slide
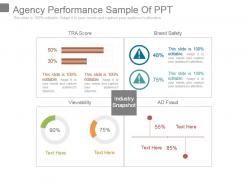
Presenting agency performance sample of ppt. This is a agency performance sample of ppt. This is a four stage process. The stages in this process are tra score, brand safety, viewability, industry snapshot, ad fraud.
-
 95076882 style essentials 2 financials 3 piece powerpoint presentation diagram infographic slide
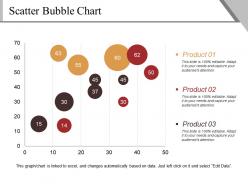
Presenting scatter bubble chart presentation background images. This is a scatter bubble chart presentation background images. This is a three stage process. The stages in this process are bubble, finance, business, marketing, strategy.
-
 6085492 style essentials 2 financials 2 piece powerpoint presentation diagram infographic slide
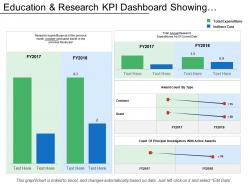
Presenting education and research KPI dashboard showing research expenditure PPT slide. The expenditure on research and development presentation slide designed by the professional team of SlideTeam. The research expenditure PPT template is fully editable in PowerPoint. The research and development expenditure PowerPoint template is compatible with Google Slide so a user can share this dashboard slide with others. A user can make changes in the font size, font type, color as well as dimensions of the research expenditure PPT template as per the requirement. You may edit the value in the expense research and development presentation slide as the slide gets linked with the Excel sheet.
-
 99297674 style essentials 2 financials 3 piece powerpoint presentation diagram infographic slide
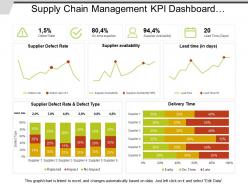
Presenting this set of slides with name - Supply Chain Management Kpi Dashboard Showing Defect Rate And Delivery Time. This is a three stage process. The stages in this process are Demand Forecasting, Predicting Future Demand, Supply Chain Management.
-
 39358768 style essentials 2 financials 5 piece powerpoint presentation diagram infographic slide
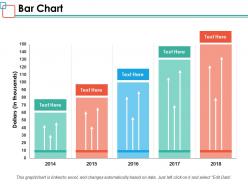
Presenting this set of slides with name - Bar Chart Ppt Powerpoint Presentation Inspiration Images. This is a five stage process. The stages in this process are Business, Management, Strategy, Analysis, Marketing.
-
 9317861 style essentials 2 financials 2 piece powerpoint presentation diagram infographic slide
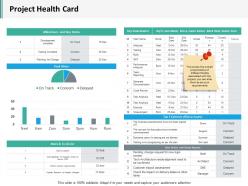
Presenting this set of slides with name - Project Health Card Slide2 Ppt Infographics Structure. This is a two stage process. The stages in this process are Business, Management, Strategy, Analysis, Marketing.
-
 14107897 style essentials 2 financials 5 piece powerpoint presentation diagram infographic slide
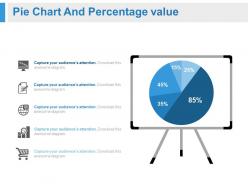
Presenting white board with pie chart and percentage powerpoint slides. This Power Point template slide has been crafted with graphic of white board and pie chart diagram. This PPT slide contains the concept of business result analysis. Use this PPT slide for business and finance related presentations.
-
 42244890 style essentials 2 financials 1 piece powerpoint presentation diagram infographic slide
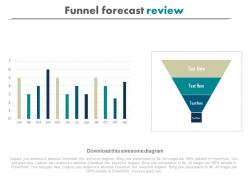
Presenting download funnel forecast review powerpoint slides. This Power Point template slide has been crafted with graphic of funnel and bar graph charts. This PPT slide contains the concept of result analysis. Use this PPT slide for business and marketing related presentations.
-
 56973478 style essentials 2 financials 13 piece powerpoint presentation diagram infographic slide
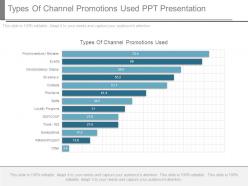
Presenting types of channel promotions used ppt presentation. This is a types of channel promotions used ppt presentation. This is a thirteen stage process. The stages in this process are types of channel promotions used, loyalty programs.
-
 95142964 style essentials 2 financials 4 piece powerpoint presentation diagram infographic slide
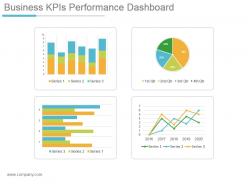
Presenting business kpis performance dashboard snapshot powerpoint slide clipart. This is a business kpis performance dashboard powerpoint slide clipart. This is a four stage process. The stages in this process are series, qtr.
-
 99002480 style essentials 2 financials 6 piece powerpoint presentation diagram infographic slide
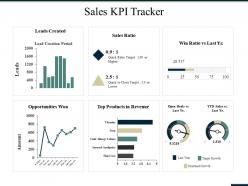
Presenting this set of slides with name - Sales Kpi Tracker Ppt Summary Grid. This is a six stage process. The stages in this process are Leads Created, Sales Ratio, Opportunities Won, Products In Revenue, Open Deals Vs.
-
 67270048 style essentials 2 financials 7 piece powerpoint presentation diagram infographic slide
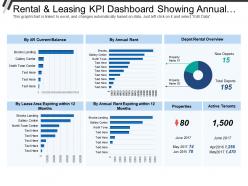
Presenting this set of slides with name - Rental And Leasing Kpi Dashboard Showing Annual Rent Depot Rental Overview. This is a seven stage process. The stages in this process are Rental And Leasing, Dealing And Leasing, Rental And Engage.
-
 8772479 style essentials 2 financials 4 piece powerpoint presentation diagram infographic slide
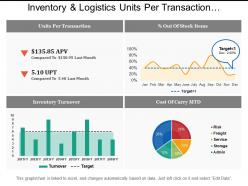
Spectacular inventory and logistics units per transaction dashboards PPT template. Top quality and creative PowerPoint slide design. Adjustable presentation graphic as compatible with Google slides. Perfect for sales executives, marketers, business professionals, analysts, strategists, students, teachers, etc. Information on making the changes has been provided for your provision. Download is rapid and can be displayed in widescreen view mode also. 100% editable PPT designs as completely modifiable such as icons, text, colors, etc. Effortlessly convertible into JPEG and PDF file formats.


