Financial Reviews and Accounting PPT Slides
-
 38203634 style essentials 2 financials 5 piece powerpoint presentation diagram infographic slide
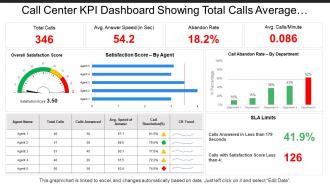
Presenting this set of slides with name - Call Center Kpi Dashboard Showing Total Calls Average Answer Speed Abandon Rate. This is a five stage process. The stages in this process are Call Center Agent, Customer Care, Client Support.
-
 79058532 style essentials 2 dashboard 4 piece powerpoint presentation diagram infographic slide
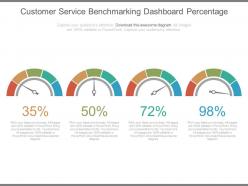
This PPT slide can be used by anyone looking to project their Customer Service Bench marking related ideas. This PowerPoint template is 100% editable, which means text, color, and shapes of the given elements can be altered according to your liking. These slides are also compatible with Google slides. You can edit the text section to write a short brief about the process.The stages in this process are finance, marketing, strategy, business.
-
 75506128 style essentials 2 financials 5 piece powerpoint presentation diagram infographic slide
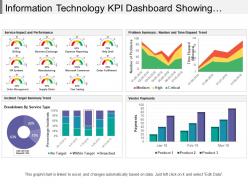
Presenting this set of slides with name - Information Technology Kpi Dashboard Showing Incident Target Summary Trend. This is a five stage process. The stages in this process are Information Technology, It, Iot.
-
 70238124 style essentials 2 financials 5 piece powerpoint presentation diagram infographic slide
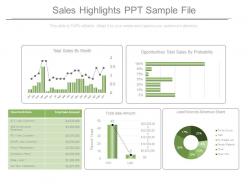
Presenting sales highlights ppt sample file. This is a sales highlights ppt sample file. This is a five stage process. The stages in this process are total sales by month, opportunities total sales by probability, opportunity name amount, total sale amount, lead sources revenue share.
-
 42986457 style essentials 2 financials 5 piece powerpoint presentation diagram infographic slide
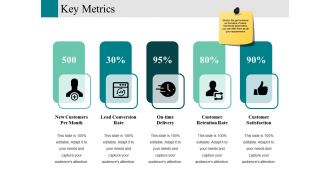
Presenting this set of slides with name - Key Metrics Ppt Design. This is a five stage process. The stages in this process are New Customers Per Month, Lead Conversion Rate, On Time Delivery, Customer Retention Rate, Customer Satisfaction.
-
 19907513 style essentials 2 financials 4 piece powerpoint presentation diagram infographic slide
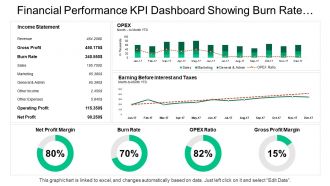
Presenting this set of slides with name - Financial Performance Kpi Dashboard Showing Burn Rate Opex Ratio Gross Profit. This is a four stage process. The stages in this process are Financial Performance, Financial Report, Financial Review.
-
 70257157 style division donut 2 piece powerpoint presentation diagram infographic slide
Presenting project name cost baseline portfolio dashboards PPT template. Download is quick and can be easily shared. Conveys a sense of change over time. Suitable for corporate leaders and business associates. Flexible PPT slide as can be used whenever required. PowerPoint design can be shared in Standard and Widescreen view. High quality graphics and visuals used in the PPT. Option to include business content i.e. name, logo and text. Effortless conversion into PDF/ JPG format. Can be easily merged with your ongoing presentation slides.
-
 22655294 style essentials 2 financials 4 piece powerpoint presentation diagram infographic slide
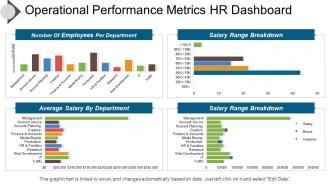
Introducing operational performance metric HR PPT image. Fully regulated PowerPoint template quite reasonable for the HR and management professionals and business specialists. Extensive scope for reviving the dummy data and can add company logo, trademark etc. Reconvert able background PPT image, subject matter, designs, context etc. according to need. Versant with all Google Slides and other system applications. Can be easily projected over wide screen with exceptional picture quality.
-
 1843728 style essentials 2 financials 1 piece powerpoint presentation diagram infographic slide
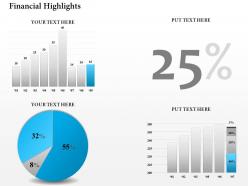
Alter the PPT diagram by addition of business label. Swift download and easy to alter into JPEG and PDF document. PowerPoint diagram well-attuned with Google slides. Greater quality presentation design. Specific and easy to apprehend information. Choice to present design in standard and widescreen display view. Presentation slide can be accessed with different nodes and stages. Suitable for finance data management experts, financial reporting team, data analyst etc.
-
 61035884 style essentials 2 financials 4 piece powerpoint presentation diagram infographic slide
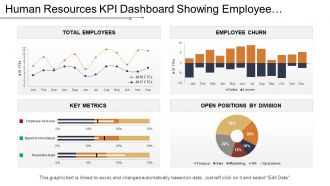
Presenting this set of slides with name - Kpi Dashboard Showing Employee Churn Key Metrics And Open Positions. This is a four stage process. The stages in this process are Human Resource, Hrm, Human Capital.
-
 38673194 style essentials 2 financials 5 piece powerpoint presentation diagram infographic slide
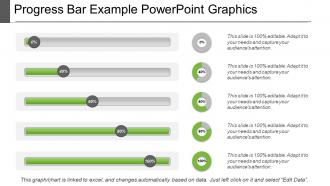
We brings to you the progress bar example PowerPoint graphics. You can download this PPT completely free of cost. You just have to edit the data in a pre-designed format and present it. You can insert pictures and new slides to this ready-made deck of slides. All these slides are fully compatible with Google Slides. This presentation can be downloaded in JPG and PDF formats. It can be viewed in the 16:9 ratio widescreen size and the ratio of 4:3 standard screen size.
-
 47173408 style essentials 2 financials 5 piece powerpoint presentation diagram infographic slide
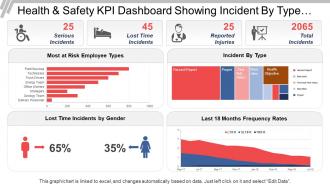
Presenting the dashboard presentation slide. This KPI dashboard is fully editable and is designed by professionals looking for professional presentation design. You can edit the objects in the slide like font size and font color easily. This presentation slide is fully compatible with Google Slide and can be saved in JPG or PDF file format without any hassle. Click on the download button below.
-
 53694906 style essentials 2 financials 4 piece powerpoint presentation diagram infographic slide
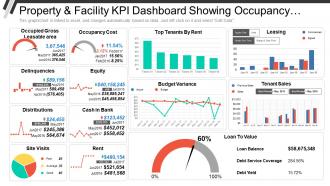
Presenting Property And Facility KPI Dashboard Showing Occupancy Cost Delinquencies And Distributions PPT slide. The Property And Facility KPI Dashboard PPT slide designed professionally by the team of SlideTeam to present the different parameters. These parameters have illustrated by different charts such as bar, line and pie chart, along with that the text in the KPI metric dashboard slide is customizable in PowerPoint. The logistics KPI dashboard template is compatible with Google Slide. A user can do alteration in the font size, font type, color and dimensions of the different figures as per the requirement.
-
 181595 style essentials 2 financials 3 piece powerpoint presentation diagram infographic slide
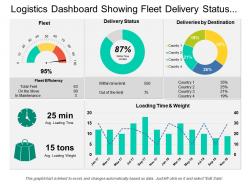
Presenting this set of slides with name - Logistics Dashboard Showing Fleet Delivery Status And Delivery By Destination. This is a three stage process. The stages in this process are Logistics Dashboard, Logistics Kpis, Logistics Performance.
-
 70650808 style division donut 3 piece powerpoint presentation diagram infographic slide
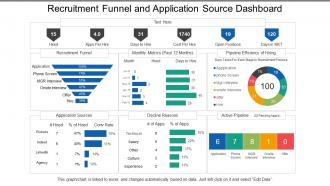
Presenting this set of slides with name - Recruitment Funnel And Application Source Dashboard. This is a three stage process. The stages in this process are Staffing Plan, Recruitment, Staff Management.
-
 2166426 style division donut 3 piece powerpoint presentation diagram infographic slide
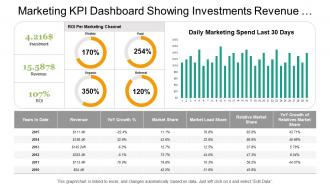
Presenting marketing kpi dashboard showing investments revenue metrics details presentation template slide. The PPT template is very user friendly as it allows you to make numerous changes to the editable slides. You can amend the font size, font style and also the font color as per your requirements. Template slide can be downloaded quickly and cab be saved in format of PDF or JPG easily. The template slide after being downloaded can be viewed in large screen display ratio of 16:9 or standard size display ratio of 4:3.
-
 60486942 style essentials 2 financials 4 piece powerpoint presentation diagram infographic slide
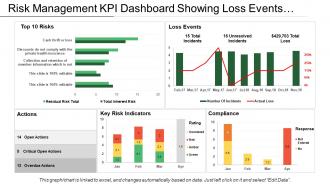
Presenting this set of slides with name - Risk Management Kpi Dashboard Showing Loss Events Actions And Compliance. This is a four stage process. The stages in this process are Risk Management, Risk Assessment, Project Risk.
-
 18069569 style essentials 2 financials 6 piece powerpoint presentation diagram template slide
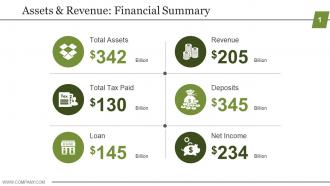
Presenting assets and revenue financial summary powerpoint graphics. This is a assets and revenue financial summary powerpoint graphics. This is a six stage process. The stages in this process aretotal assets, total tax paid, loan, revenue, deposits, net income.
-
 50469508 style essentials 2 financials 6 piece powerpoint presentation diagram infographic slide
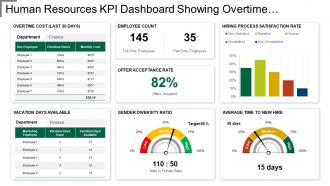
Presenting this set of slides with name - Kpi Dashboard Showing Overtime Cost Gender Diversity Ratio. This is a six stage process. The stages in this process are Human Resource, Hrm, Human Capital.
-
 54110994 style essentials 2 financials 4 piece powerpoint presentation diagram infographic slide
Presenting project name status schedule and management dashboard PowerPoint template. Presentation slides are compatible with Google slides. Download is quick and can be easily shared. Conveys a sense of change over time. Suitable for corporate leaders and business associates. Flexible PPT slide as can be used whenever required. PowerPoint design can be shared in Standard and Widescreen view. High quality graphics and visuals used in the PPT. Option to include business content i.e. name, logo and text. Effortless conversion into PDF/ JPG format.
-
 68619290 style essentials 2 financials 3 piece powerpoint presentation diagram template slide
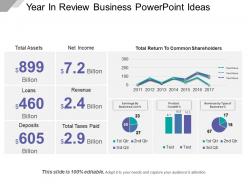
Presenting Year In Review Business PowerPoint Ideas. Get this Excel linked PPT slide and deliver quality presentations to your audience. You are free to make changes in any part of the slide. Modify the colors as per your choice, change the font type and font size and save this in JPG and PDF formats. This is entirely compatible with Google Slides and can be viewed on the standard screen and widescreen.
-
 55091760 style essentials 2 financials 5 piece powerpoint presentation diagram infographic slide
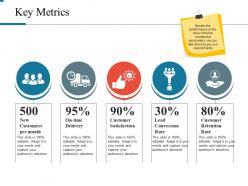
Presenting key metrics powerpoint slide background designs. This is a key metrics powerpoint slide background designs. This is a five stage process. The stages in this process are new customers per month, on time delivery, customer satisfaction, lead conversion rate, customer retention rate.
-
 65919369 style essentials 2 financials 6 piece powerpoint presentation diagram infographic slide
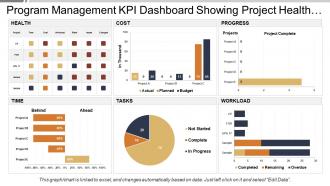
Presenting this set of slides with name - Program Management Kpi Dashboard Showing Project Health And Progress. This is a six stage process. The stages in this process are Program Development, Human Resource Management, Program Management.
-
 15888914 style essentials 2 financials 4 piece powerpoint presentation diagram infographic slide
Pixel friendly images and icons. Use the variety of icons available to download and replace. Edit the background with the company name or brand logo. Follow guidelines to make modifications in the template. Easy to download and save in various formats. Used by the business leaders, professional analysts and the student learning business.The stages in this process are marketing, finance, business.
-
 40357147 style essentials 2 financials 4 piece powerpoint presentation diagram infographic slide
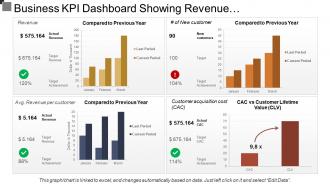
Presenting this set of slides with name - Business Kpi Dashboard Showing Revenue And Customer Lifetime Value. This is a four stage process. The stages in this process are Business Dashboard, Business Kpi, Business Performance.
-
 59551623 style essentials 2 financials 6 piece powerpoint presentation diagram infographic slide
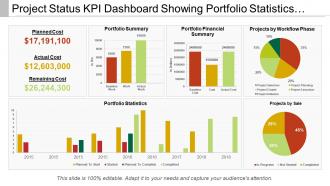
Presenting Project Status Kpi Dashboard Showing Portfolio Statistics And Workflow Phase PPT template. All around planned layout slide. This template slide is completely perfect with Google. Tend to upgrade the general effect of your introduction. Introduced to be spared in JPEG, JPG or PDF arrange whenever required. Space accessible to include your organization data as and when required. The format slide is famous and popular because of its simple utilize and openness. Basic and accommodating downloading by following clear advances. This slide keeps up the demonstrable skill of the introduction.
-
 63007252 style essentials 2 financials 4 piece powerpoint presentation diagram infographic slide
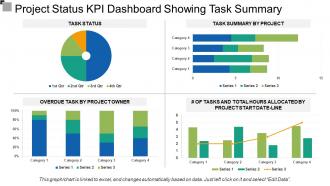
Presentation template is attainable in standard and widescreen view. Presentation slides created with high quality resolution design. Totally variable design as color, text and font can be edited with ease. PPT slide easy to download with different slides. Easy to transmute the presentation slide into JPEG and PDF document. Download is quick. PowerPoint slide helps you to save time and effort. Just enter the business information and share with your shareholders, clients, team etc. Professionally crafted with concept in mind.
-
 52378135 style essentials 2 financials 3 piece powerpoint presentation diagram infographic slide
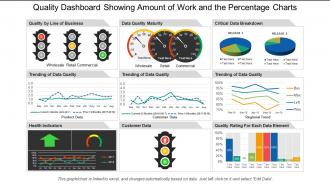
SlideTeam feels immense pleasure in presenting to you its 100% customizable and user-friendly quality dashboard snapshot showing customer data with data quality. The business slides can be viewed in widescreen display ratio of 16:9 or standard size display ratio of 4:3 after being downloaded. The PPT presentation lets you insert or remove any given feature from the redesigned set of slides. You can also save the slideshow in format of PDF or JPG and also it is compatible with Google Slides. So hit download, edit it and present it.
-
 51964122 style essentials 2 financials 2 piece powerpoint presentation diagram infographic slide
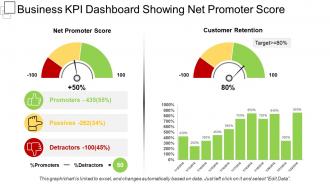
Presenting this set of slides with name - Business Kpi Dashboard Snapshot Showing Net Promoter Score. This is a two stage process. The stages in this process are Business Dashboard, Business Kpi, Business Performance.
-
 95393745 style division pie 4 piece powerpoint presentation diagram infographic slide
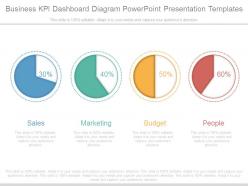
PPT icon is easy for proofing and editing. Presentation layout is a good blend of text and flash animation. Presentation slide supports new shape styles to keep away cliché appearance and helps capture the attention. PPT slide is compatible with Google slide. Beneficial for marketing, sales, business and financial sector growth. Offers high color resolution. The stages in this process are sales, marketing, budget, people.
-
 69651798 style essentials 2 dashboard 1 piece powerpoint presentation diagram infographic slide
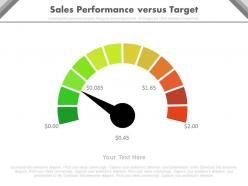
High resolution Dial Dashboard Diagram doesn’t pixel ate, while being projected on big screen. Easy to embed company logo/ trademark. Well compatible with Google slides. Quick and easy downloading process. Amendable font style, design and the content of the icons or the PPT Slides. Valuable for entrepreneurs, students, researchers and employees.
-
 16740054 style linear single 8 piece powerpoint presentation diagram infographic slide
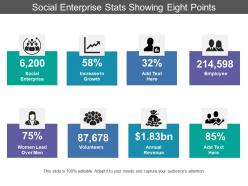
Presenting this set of slides with name - Social Enterprise Stats Showing Eight Points. This is a eight stage process. The stages in this process are Stats, Statistics, Data.
-
 83478184 style essentials 2 financials 4 piece powerpoint presentation diagram infographic slide
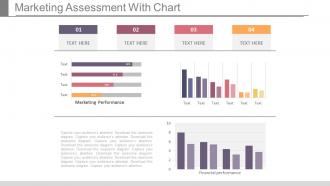
The PowerPoint presentation ensures proofing and editing with ease. Presentation slide is of utmost use to sales, marketing and business entrepreneurs, for financing and accounting purpose. Text and graphic can be put on show in the same PPT slide. PPT diagram supports recasting the color, size and orientation according to the requirement. High resolution in color and art shape is offered by PPT slide.The stages in this process are finance, business, marketing, strategy.
-
 66833420 style essentials 2 financials 1 piece powerpoint presentation diagram infographic slide
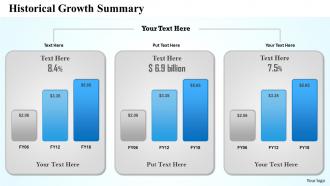
Convertible into numerous format options like JPEG, JPG or PDF. Provides a professional outlook to your PowerPoint presentation. Icons can also be added. Customization of each PowerPoint graphic and text according to your desire and want. Multiple display option such as standard and widescreen view. Freedom to customize it with company name and logo. Beneficial for business professionals, students, teachers, business analysts and strategists. Compatible with Google slides as well. Modifiable PPT slide with financial charts and graphs.
-
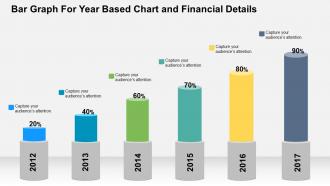 58817189 style concepts 1 growth 6 piece powerpoint presentation diagram infographic slide
Visually drawing PowerPoint presentation diagrams. Loaded with incomparable benefits. Can be utilized for displaying both simple and complex information. Instant download to save your time and effort. Runs effortlessly with all the software’s. Can be personalized by adding company trademark, logo, brand and symbols. Well-arranged patterns to avoid any confusion or doubt.
-
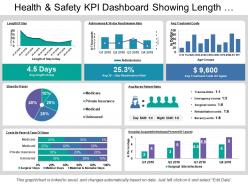 96914002 style essentials 2 financials 7 piece powerpoint presentation diagram infographic slide
Presenting this set of slides with name - Health And Safety Kpi Dashboard Showing Length Of Stay And Treatment Costs. This is a seven stage process. The stages in this process are Health And Safety, Health And Security, Health And Protection.
-
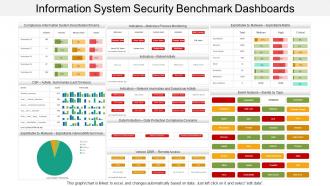 1840576 style division pie 3 piece powerpoint presentation diagram infographic slide
Presenting this set of slides with name - Information System Security Benchmark Dashboards. This is a three stage process. The stages in this process are Information Security Strategy, Information Security Plan, Information Protection Strategy.
-
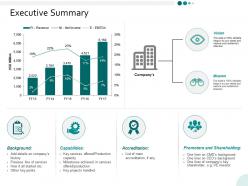 91010229 style essentials 2 financials 6 piece powerpoint presentation diagram infographic slide
Presenting this set of slides with name - Executive Summary Ppt Powerpoint Presentation Infographics Deck. This is a six stages process. The stages in this process are Finance, Marketing, Management, Investment, Analysis.
-
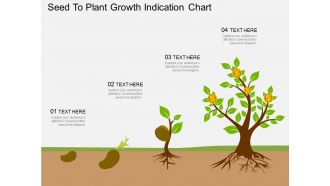 73283006 style concepts 1 growth 4 piece powerpoint presentation diagram infographic slide
Successfully passed the authenticity examination. Aims to provide an outstanding and extraordinary presentation experience to the audience as well as the organisation. Visually appealing PPT presentation diagrams. Can be updated at any point of time by any user without even having any specialised knowledge. Supports widescreen view for more clarity and vision.
-
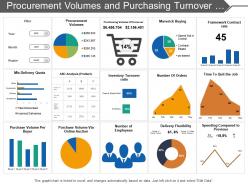 3667759 style essentials 2 financials 4 piece powerpoint presentation diagram infographic slide
Presenting this set of slides with name - Procurement Volumes And Purchasing Turnover Dashboard. This is a four stage process. The stages in this process are Purchase, Procurement, Buy.
-
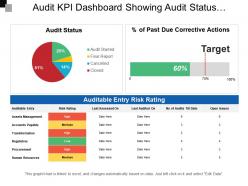 7447902 style essentials 2 financials 4 piece powerpoint presentation diagram infographic slide
Presenting this set of slides with name - Audit Kpi Dashboard Showing Audit Status Auditable Entry Risk Rating. This is a four stage process. The stages in this process are Audit, Examine, Survey.
-
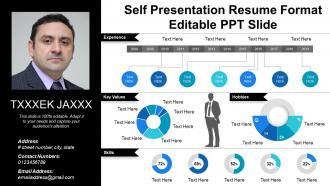 19875835 style essentials 2 financials 3 piece powerpoint presentation diagram infographic slide
Presenting self presentation resume format editable PPT slide which is thoroughly editable, data driven i.e. excel linked and fast to download. The presenter can customize and personalize this PPT slide it to meet his / her own specifications. This presentation has been designed by plethora of professional expertise. This PowerPoint shape is fully compatible with Google Slides, multiple software and format options. This slideshow can be saved as JPG and / or in PDF. For your kind assistance, editing instructions are also provided.
-
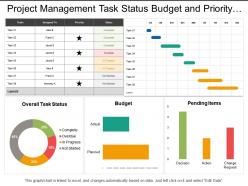 44848897 style essentials 2 financials 5 piece powerpoint presentation diagram infographic slide
Stunning project management task status budget and priority dashboard PowerPoint template. Choice to display PowerPoint template in standard and widescreen view. Presentation designs are well-suited with Google slides or MS Office PowerPoint programs. Can be transformed into JPG and PDF format. Trouble-free replacement of your company’s logo. Access to open on a big screen display. Perfect for business professionals, managers and industry leaders. Trustworthy and accurate PowerPoint slide show. Customize the fonts, colors, layout, etc.as per your requirements and business needs.
-
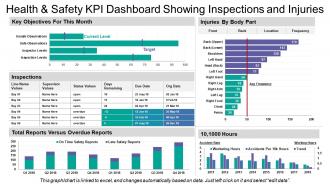 18379402 style essentials 2 financials 5 piece powerpoint presentation diagram infographic slide
Presenting this set of slides with name - Health And Safety Kpi Dashboard Showing Inspections And Injuries. This is a five stage process. The stages in this process are Health And Safety, Health And Security, Health And Protection.
-
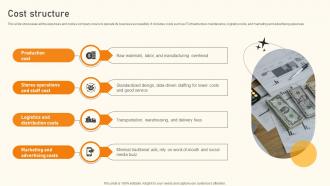 Cost Structure Clothing Store Business Model BMC SS V
This slide showcases all the expenses and costs a company incurs to operate its business successfully. It includes costs such as IT infrastructure maintenance, logistics costs, and marketing and advertising expenses. Increase audience engagement and knowledge by dispensing information using Cost Structure Clothing Store Business Model BMC SS V. This template helps you present information on four stages. You can also present information on Production Cost, Stores Operations And Staff Cost, Logistics And Distribution Costs using this PPT design. This layout is completely editable so personaize it now to meet your audiences expectations.
-
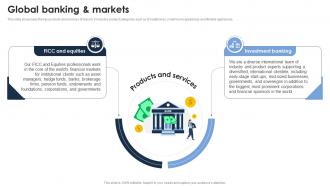 Global Banking And Markets Goldman Sach Company Profile CP SS
This slide showcases the key products and services of Xiaomi. It includes product categories such as Smartphones, smart home appliances and lifestyle appliances. Increase audience engagement and knowledge by dispensing information using Global Banking And Markets Goldman Sach Company Profile CP SS This template helps you present information on two stages. You can also present information on Investment Banking, FICC And Equities using this PPT design. This layout is completely editable so personaize it now to meet your audiences expectations.
-
 45331976 style essentials 2 financials 3 piece powerpoint presentation diagram infographic slide
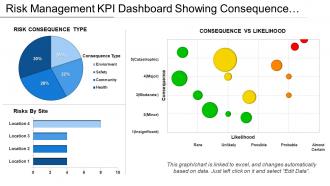
Presenting this set of slides with name - Risk Management Kpi Dashboard Showing Consequence Vs Likelihood. This is a three stage process. The stages in this process are Risk Management, Risk Assessment, Project Risk.
-
 41593055 style essentials 2 financials 6 piece powerpoint presentation diagram template slide
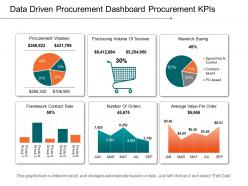
Pre-designed data driven procurement dashboard for Kpis presentation template. Can be used for statistical data analysis. High-resolution PowerPoint presentation backgrounds for better clarity of the information displayed. Offers wide variety of options and colors to alter the appearance. Allows adding of enterprise personal details such as brand name, logo and much more. Enough space available to enter text and its related points in the PPT table. This PPT Slide is available in both Standard and Widescreen slide size. Compatible with multiple formats like JPEG, PDF and Google slides.
-
 28781983 style essentials 2 financials 4 piece powerpoint presentation diagram infographic slide
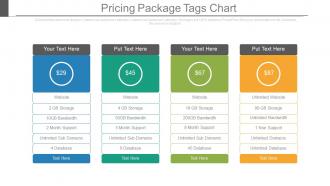
Compatible with Google slides. Total freedom to any sort of manual editing. User friendly and amendable PowerPoint templates. Fit in wide screen preview. Effortless conversion into PDF or JPG format. Easy insertion of company name or business logo. Beneficial for entrepreneurs, business owners, investors, business analysts, marketers and professional individuals. The stages in this process are marketing, strategy, management, business.
-
 59362929 style essentials 2 compare 2 piece powerpoint presentation diagram infographic slide
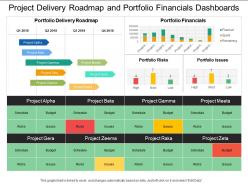
Highlighting project delivery roadmap and portfolio financials dashboards PowerPoint presentation. Offer 100% access to change the size and style of the slides once downloaded and saved in the desired format. Beneficial for the business managers, marketing professionals and the strategy designers. Access to convert the presentation design into JPG and PDF. High quality images and visuals used in the designing process. Choice to get presentation slide in standard or in widescreen view. Easy to convert in JPEG and PDF document.
-
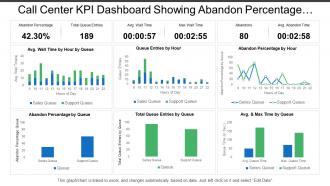 76760401 style essentials 2 financials 6 piece powerpoint presentation diagram infographic slide
PowerPoint shape easy to amend as color, text, font etc are amendable. Notable quality presentation template. Well-adjusted online software programs such as JPG and PDF. Extra-ordinary picture quality as pixels don’t break when viewed in widescreen view. PPT design goes well with Google slides. Matching designs available with different nodes and stages. Handy presentation design saves you valuable time. Show the PowerPoint diagram with your corporate sign and title. Easy to download and can be saved for future reference.
-
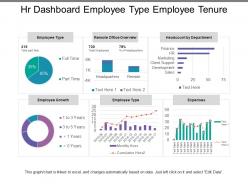 2797341 style essentials 2 financials 6 piece powerpoint presentation diagram infographic slide
Presenting this set of slides with name - Hr Dashboard Employee Type Employee Tenure. This is a six stage process. The stages in this process are Hr Dashboard, Human Resource Dashboard, Hr Kpi.
-
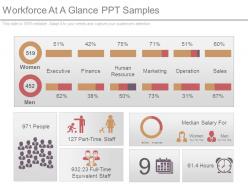 22113280 style essentials 2 financials 2 piece powerpoint presentation diagram infographic slide
Presenting workforce at a glance ppt samples. This is a workforce at a glance ppt samples. This is a two stage process. The stages in this process are women, men, executive, finance, human resource, marketing, operation, sales.
-
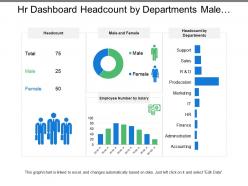 47708867 style division donut 3 piece powerpoint presentation diagram infographic slide
Presenting this set of slides with name - Hr Dashboard Headcount By Departments Male And Female. This is a three stage process. The stages in this process are Hr Dashboard, Human Resource Dashboard, Hr Kpi.
-
 54690711 style concepts 1 opportunity 5 piece powerpoint presentation diagram infographic slide
Presenting ppt financial idea sharing analysis diagram flat powerpoint design. Presenting ppt financial idea sharing analysis diagram flat powerpoint design. This Power Point template diagram has been crafted with graphic of dollar symbol and hands diagram. This PPT diagram contains the concept of financial idea sharing analysis. Use this PPT diagram for business and finance related presentations.
-
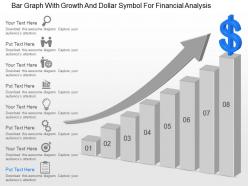 11318840 style concepts 1 growth 8 piece powerpoint presentation diagram infographic slide
Visually appealing PPT presentation slides. Possess the ability to easily grab the attention of the audience without putting much efforts. Creates a strong connection between the audience and the presentation. User-friendly PowerPoint backgrounds. Enables easy understanding and memorising of the contents displayed on these templates. Can be viewed on wide screens without the images and icons being pixelating.
-
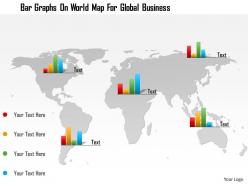 59667463 style essentials 1 location 1 piece powerpoint presentation diagram infographic slide
Presenting0115 bar graphs on world map for global business PowerPoint template. Simple data input like company logo, name or trademark. This PowerPoint theme is fully supported by Google slides. Picture quality of these slides does not change even when project on large screen. Fast downloading speed and formats can be easily changed to JPEG and PDF applications. This template is suitable for marketing, sales persons, business managers and entrepreneurs. Adjust PPT layout, font, text and color as per your necessity
-
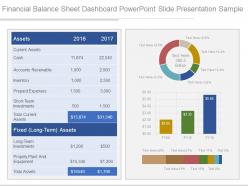 51766737 style essentials 2 financials 2 piece powerpoint presentation diagram infographic slide
Presenting financial balance sheet dashboard powerpoint slide presentation sample. This is a financial balance sheet dashboard powerpoint slide presentation sample. This is a two stage process. The stages in this process are assets, current assets, cash, accounts receivable, inventory, prepaid expenses, total current assets.
-
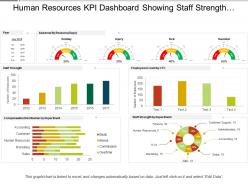 29565185 style essentials 2 financials 5 piece powerpoint presentation diagram infographic slide
SlideTeam presenting Human Resources Kpi Dashboard Showing Staff Strength Compensation Distribution PPT. It will not only help you in knowing the exact strength of the staff but also about actual staff required in the organization. This slideshow is entirely editable and you can edit it whenever you want. All the slides in this presentation are compatible with Google slides. You can enter thousands of relatable icons of your own choice. You can also change from 4:3 standard screen size to 16:9 widescreen size.
-
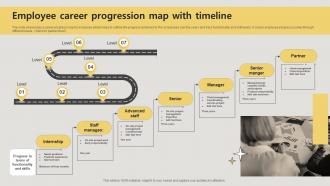 Employee Career Progression Map With Timeline
The slide showcases a career progress map for employee which helps to outline the progress achieved by the employees over the years and track functionality and skill levels. It covers employee progress journey through different levels intern to partner level. Introducing our premium set of slides with Employee Career Progression Map With Timeline Ellicudate the seven stages and present information using this PPT slide. This is a completely adaptable PowerPoint template design that can be used to interpret topics like Internship, Advanced Staff, Manager, Senior Manger . So download instantly and tailor it with your information.


