Financial Reviews and Accounting PPT Slides
-
 86559284 style essentials 2 financials 3 piece powerpoint presentation diagram infographic slide
Presenting Logistics Dashboard With Revenue Breakdown And Time To Market PPT slide. The revenue breakdown dashboard PowerPoint template designed by the professional team of SlideTeam to present the entire plan to clients as well as investors. The bar chart, pie charts, text and image in time to market dashboard slide are customizable in PowerPoint and can help you in sharing the market sale target. The logistics performance dashboard slide is compatible with Google Slide which makes easy for a presenter to present business financial statistics. A user may do changes in the font size, font type, color and dimensions of the charts to present the desired sales value.
-
 Deposit icon with dollar bill and arrows
Presenting this set of slides with name Deposit Icon With Dollar Bill And Arrows. This is a four stage process. The stages in this process are Deposit Icon With Dollar Bill And Arrows. This is a completely editable PowerPoint presentation and is available for immediate download. Download now and impress your audience.
-
 27237149 style concepts 1 opportunity 1 piece powerpoint presentation diagram infographic slide
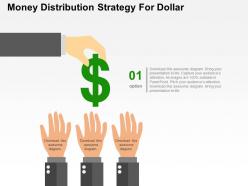
We are proud to present our money distribution strategy for dollar flat powerpoint design. Concept of money distribution and strategy has been used to design this power point template diagram. This PPT diagram contains the graphic of human hands and dollar symbol. Use this PPT diagram for business and finance related presentations.
-
 58212165 style essentials 1 agenda 3 piece powerpoint presentation diagram infographic slide
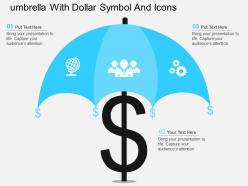
We are proud to present our umbrella with dollar symbol and icons flat powerpoint design. This power point template diagram has been crafted with graphic of umbrella and dollar symbols with icons. This PPT diagram contain the concept of financial safety. Use this PPT diagram for business and finance related presentations.
-
 95819463 style essentials 2 financials 5 piece powerpoint presentation diagram infographic slide
Presenting arrow upward and downward with percentage chart powerpoint slides. This Power Point template diagram has been crafted with graphic of arrow in upward and downward directions with percentage chart diagram. This PPT diagram contains the concept of financial process flow. Use this PPT diagram for business and finance related presentations.
-
 63831991 style essentials 2 financials 3 piece powerpoint presentation diagram infographic slide
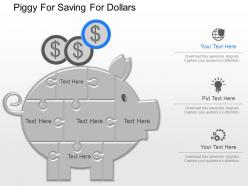
Presenting ppt piggy for saving for dollars powerpoint template. This Power Point template diagram has been crafted with graphic of piggy and dollars. This PPT diagram contains the concept of money saving and investment representation. Use this PPT diagram for business and finance related presentations.
-
 77121528 style essentials 2 financials 4 piece powerpoint presentation diagram template slide
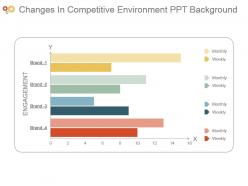
Presenting changes in competitive environment ppt background. Presenting changes in competitive environment ppt background. Presenting changes in competitive environment ppt background. This is a changes in competitive environment ppt background. This is four stage process. The stages in this process are engagement, monthly, brand, weekly.
-
 12958992 style essentials 2 financials 2 piece powerpoint presentation diagram infographic slide
Presenting the Gross Profit Margin With Financial Highlights PPT slideshow which is designed professionally for your convenience. Can be changed into formats like PDF, JPG, and PNG. The slide is readily available in both 4:3 and 16:9 aspect ratio. This template is compatible with Google Slides, which makes it accessible at once. You can alter the colors, fonts, font size, and font types of the template as per the requirements.
-
 77107895 style essentials 2 compare 2 piece powerpoint presentation diagram infographic slide
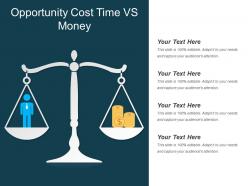
Presenting this Opportunity Cost Time Vs Money PowerPoint presentation. Add new components like charts and graphs for a better portrayal of important facts. The PPT also supports the standard(4:3) and widescreen(16:9) sizes for better comprehension. It is compatible with Google Slides. Convert this into popular images or document formats including JPEG, PNG or PDF. High-quality graphics ensure that quality does not deteriorate.
-
 88092671 style essentials 2 financials 4 piece powerpoint presentation diagram infographic slide
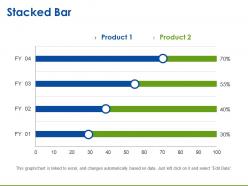
Presenting stacked bar powerpoint show. This is a stacked bar powerpoint show. This is a four stage process. The stages in this process are stacked bar, finance, marketing, strategy, business, analysis.
-
 2645950 style essentials 2 financials 3 piece powerpoint presentation diagram infographic slide
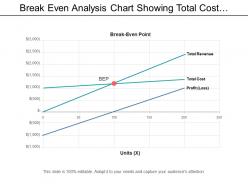
Presenting this set of slides with name - Break Even Analysis Chart Showing Total Cost And Revenue. This is a three stage process. The stages in this process are Break Even Analysis, Break Even Point, Break Even Level.
-
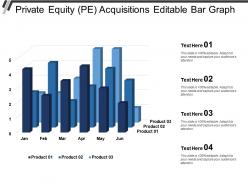 42299126 style essentials 2 financials 4 piece powerpoint presentation diagram infographic slide
Presenting this set of slides with name - Data Presentation Graphs. This is a four stage process. The stages in this process are Data Presentation, Content Presentation, Information Presentation.
-
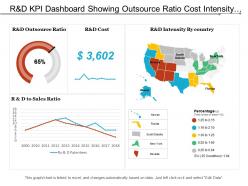 91455622 style essentials 2 financials 4 piece powerpoint presentation diagram infographic slide
Presenting this set of slides with name - R And D Kpi Dashboard Showing Outsource Ratio Cost Intensity By Country And R And D To Sales Ratio. This is a four stage process. The stages in this process are R And D, Research And Development, Research And Technological Development.
-
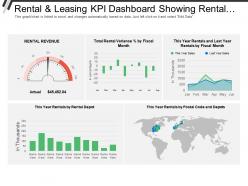 15077766 style essentials 2 financials 5 piece powerpoint presentation diagram infographic slide
Presenting this set of slides with name - Rental And Leasing Kpi Dashboard Showing Rental Revenue And Rental Variance Percentage. This is a five stage process. The stages in this process are Rental And Leasing, Dealing And Leasing, Rental And Engage.
-
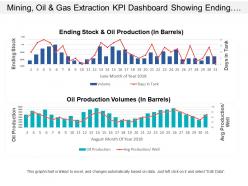 14644428 style essentials 2 financials 2 piece powerpoint presentation diagram infographic slide
Presenting this set of slides with name - Mining Oil And Gas Extraction Kpi Dashboard Showing Ending Stock And Oil Production Volumes. This is a two stage process. The stages in this process are Mining, Oil And Gas Extraction, Refinery, Natural Gas.
-
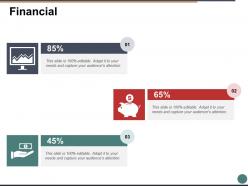 44078657 style essentials 2 financials 3 piece powerpoint presentation diagram infographic slide
This is a three satges process. The stages in this process are Finance, Marketing, Management, Investment, Analysis.
-
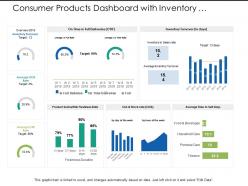 3505488 style essentials 2 financials 4 piece powerpoint presentation diagram infographic slide
Presenting this set of slides with name - Consumer Products Dashboard With Inventory Turnover Product Sold Rate. This is a four stage process. The stages in this process are Consumer Products, Business, Marketing.
-
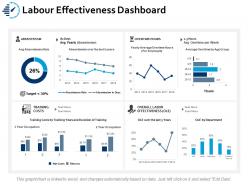 62325084 style essentials 2 financials 4 piece powerpoint presentation diagram infographic slide
Presenting this set of slides with name - Labour Effectiveness Dashboard Snapshot Ppt Portfolio Format. This is a four stage process. The stages in this process are Business, Management, Strategy, Sales, Marketing.
-
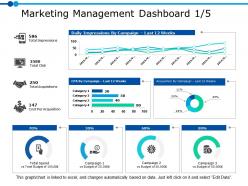 76921219 style essentials 2 financials 4 piece powerpoint presentation diagram infographic slide
Presenting this set of slides with name - Marketing Management Dashboard 1 5 Ppt Powerpoint Presentation Gallery Background Image. This is a four stage process. The stages in this process are Business, Management, Strategy, Analysis, Marketing.
-
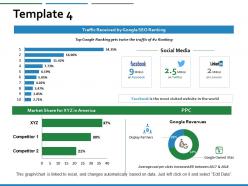 26953305 style essentials 2 financials 4 piece powerpoint presentation diagram infographic slide
Presenting this set of slides with name - Market Share Revenue Ppt Powerpoint Presentation Inspiration Professional. This is a four stages process. The stages in this process are Bar Graph, Finance, Marketing, Business, Analysis.
-
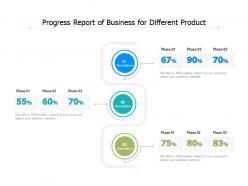 Progress report of business for different product
Presenting this set of slides with name Progress Report Of Business For Different Product. This is a three stage process. The stages in this process are Progress Report Of Business For Different Product. This is a completely editable PowerPoint presentation and is available for immediate download. Download now and impress your audience
-
 Money bag with calculator icon
Presenting this set of slides with name Money Bag With Calculator Icon. This is a three stage process. The stages in this process are Money Bag With Calculator Icon. This is a completely editable PowerPoint presentation and is available for immediate download. Download now and impress your audience.
-
 Kpi metrics and dashboard a1223 ppt powerpoint presentation gallery files
Presenting this set of slides with name KPI Metrics And Dashboard A1223 Ppt Powerpoint Presentation Gallery Files. This is a one stage process. The stages in this process are KPI Metrics And Dashboard. This is a completely editable PowerPoint presentation and is available for immediate download. Download now and impress your audience.
-
 Audit report summary with key findings and recommendations
Presenting this set of slides with name Audit Report Summary With Key Findings And Recommendations. This is a three stage process. The stages in this process are Audit Report Summary With Key Findings And Recommendations. This is a completely editable PowerPoint presentation and is available for immediate download. Download now and impress your audience.
-
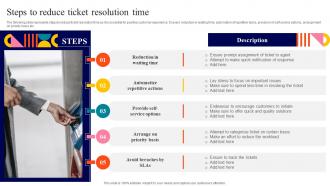 Steps To Reduce Ticket Resolution Time
The following slide represents steps to reduce ticket resolution time as it is essential for positive customer experience. It covers reduction in waiting time, automation of repetitive tasks, provision of self service options, arrangement on priority basis etc. Presenting our set of slides with Steps To Reduce Ticket Resolution Time. This exhibits information on five stages of the process. This is an easy to edit and innovatively designed PowerPoint template. So download immediately and highlight information on Automatize Repetitive Actions, Arrange On Priority Basis, Provide Self Service Options.
-
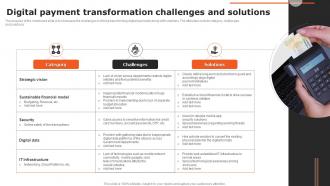 Digital Payment Transformation Challenges And Solutions
The purpose of the mentioned slide is to showcase the challenges in driving transforming digital payments along with solutions. The attributes include category, challenges, and solutions Introducing our premium set of slides with Digital Payment Transformation Challenges And Solutions Ellicudate the three stages and present information using this PPT slide. This is a completely adaptable PowerPoint template design that can be used to interpret topics like Category, Challenges, Solutions So download instantly and tailor it with your information.
-
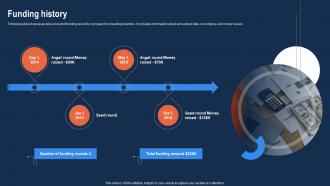 Funding History Business Marketing Apps Investor Funding Elevator Pitch Deck
Following slide showcases total amount of funding raised by company from leading inventors. It provides information about announced date, round types and money raised. Introducing Funding History Business Marketing Apps Investor Funding Elevator Pitch Deck to increase your presentation threshold. Encompassed with four stages, this template is a great option to educate and entice your audience. Dispence information on Angel Round Money, Funding Amount, Funding History, using this template. Grab it now to reap its full benefits.
-
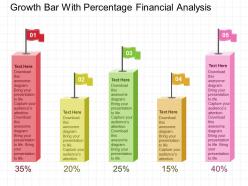 65460165 style concepts 1 growth 5 piece powerpoint presentation diagram infographic slide
We are proud to present our growth bar with percentage financial analysis flat powerpoint design. This power point template diagram has been designed with graphic of growth bar and percentage symbols. This PPT diagram contains the concept of financial analysis. Use this PPT diagram for business and finance related presentations.
-
 18828926 style essentials 2 financials 3 piece powerpoint presentation diagram infographic slide
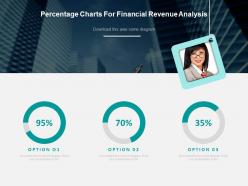
Presenting percentage charts for financial revenue analysis powerpoint slides. This is a percentage charts for financial revenue analysis powerpoint slides. This is a three stage process. The stages in this process are financials.
-
 4520388 style essentials 1 our vision 2 piece powerpoint presentation diagram infographic slide
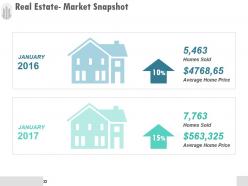
Presenting real estate market snapshot powerpoint shapes. This is a real estate market snapshot powerpoint shapes. This is a two stage process. The stages in this process are business, marketing, management, finance, sale.
-
 74781745 style essentials 2 financials 7 piece powerpoint presentation diagram template slide
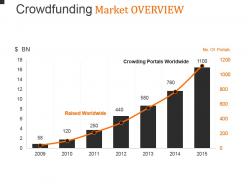
Presenting crowdfunding market overview powerpoint guide. This is a crowdfunding market overview powerpoint guide. This is a seven stage process. The stages in this process are raised worldwide, crowding portals worldwide.
-
 94228110 style essentials 2 financials 4 piece powerpoint presentation diagram infographic slide
Presenting Market Forecast Study PowerPoint Slides. This template is easy to download. This slide can be customized according to the requirement. The template is available in both standard and widescreen formats. You can easily change the color, texts, fonts and other features as per your needs. You can save it in formats like PDF, JPG and PNG. This template is also adaptable to Google Slides.
-
 71036528 style essentials 2 financials 2 piece powerpoint presentation diagram template slide
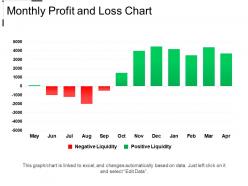
Presenting Monthly Profit And Loss Chart Example Of PPT. Get this customizable PPT slide and make amendments in this template to match it with your presentation theme. Alter the colors, background, font size, and font type. Transform and save in various formats. Its adaptability with the Google Slides and the other major Microsoft versions makes it accessible at once. Get this high-resolution graphics template in standard screen size and widescreen size.
-
 37965350 style essentials 2 financials 3 piece powerpoint presentation diagram infographic slide
Presenting this set of slides with name - Import Export Trade Bunkers Image. This is a three stage process. The stages in this process are Trade Secret, Confidential Information, Secrecy.
-
 48158422 style essentials 2 financials 3 piece powerpoint presentation diagram infographic slide
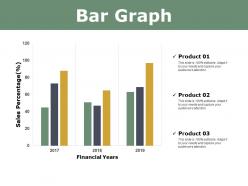
Presenting this set of slides with name - Bar Graph Ppt Powerpoint Presentation Diagram Images. This is a three stage process. The stages in this process are Percentage, Product, Business, Management, Marketing.
-
 58937117 style essentials 2 financials 4 piece powerpoint presentation diagram infographic slide
Presenting this set of slides with name - Employee Engagement Dashboard Ppt Summary Infographic Template. This is a four stage process. The stages in this process are Business, Management, Marketing.
-
 33785115 style essentials 2 financials 3 piece powerpoint presentation diagram infographic slide
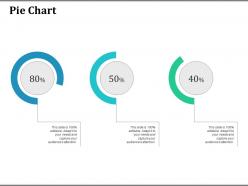
Presenting this set of slides with name - Pie Chart Ppt Professional Background Designs. This is a three stage process. The stages in this process are Percentage, Product, Management.
-
 58914253 style essentials 2 financials 5 piece powerpoint presentation diagram infographic slide
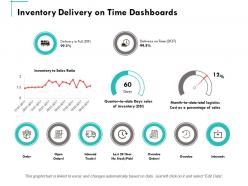
Presenting this set of slides with name - Inventory Delivery On Time Dashboards Ppt Powerpoint Presentation Summary Clipart. This is a five stages process. The stages in this process are Finance, Marketing, Management, Investment, Analysis.
-
 Icon of qa status dashboard report for project prioritization
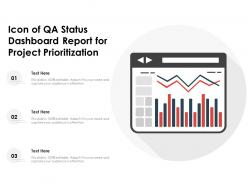
Presenting our Icon Of QA Status Dashboard Report For Project Prioritization PowerPoint Presentation Slide. This PPT template is your go-to option for presenting your business needs and requirements. You can customize this PPT layout to suit your content. This PPT theme is compatible with Google Slides making it highly accessible. Also, download and save this PPT template under different file extensions such as PNG, JPEG, etc. This PPT template is available in both standard and widescreen ratios.
-
 Price cut discount icon for affordable deal
Presenting this set of slides with name Price Cut Discount Icon For Affordable Deal. This is a three stage process. The stages in this process are Price Cut Discount Icon For Affordable Deal. This is a completely editable PowerPoint presentation and is available for immediate download. Download now and impress your audience.
-
 Cash on delivery for ecommerce shipment couriers icon
Presenting this set of slides with name Cash On Delivery For Ecommerce Shipment Couriers Icon. This is a two stage process. The stages in this process are Cash On Delivery For Ecommerce Shipment Couriers Icon. This is a completely editable PowerPoint presentation and is available for immediate download. Download now and impress your audience.
-
 Company expenses budget sheet icon
Introducing our premium set of slides with Company Expenses Budget Sheet Icon. Elucidate the three stages and present information using this PPT slide. This is a completely adaptable PowerPoint template design that can be used to interpret topics like Company Expenses Budget Sheet Icon. So download instantly and tailor it with your information.
-
 Revenue stream icon with dollar sign
Introducing our premium set of slides with Revenue Stream Icon With Dollar Sign. Ellicudate the four stages and present information using this PPT slide. This is a completely adaptable PowerPoint template design that can be used to interpret topics like Revenue Stream Icon With Dollar Sign. So download instantly and tailor it with your information.
-
 Project Cost Control Techniques Icon
Introducing our premium set of slides with Project Cost Control Techniques Icon. Ellicudate the three stages and present information using this PPT slide. This is a completely adaptable PowerPoint template design that can be used to interpret topics like Project Cost Control Techniques Icon. So download instantly and tailor it with your information.
-
 Bar Chart Icon For Data Comparison
Introducing our premium set of slides with Bar Chart Icon For Data Comparison. Elucidate the three stages and present information using this PPT slide. This is a completely adaptable PowerPoint template design that can be used to interpret topics like Bar Chart, Icon, Data Comparison. So download instantly and tailor it with your information.
-
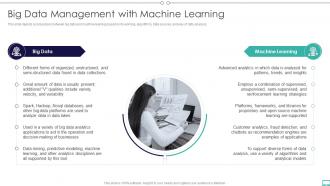 Big Data And Its Types Big Data Management With Machine Learning
This slide depicts a comparison between big data and machine learning based on its working, algorithms, data sources, and way of data analysis. Introducing Big Data And Its Types Big Data Management With Machine Learning to increase your presentation threshold. Encompassed with two stages, this template is a great option to educate and entice your audience. Dispence information on Big Data, Machine Learning, Data Collections, using this template. Grab it now to reap its full benefits.
-
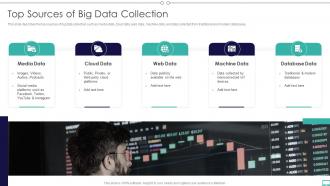 Top Sources Of Big Data Collection Big Data And Its Types Ppt Slises Master Slide
This slide describes the top sources of big data collection such as media data, cloud data, web data, machine data, and data collected from traditional and modern databases. Increase audience engagement and knowledge by dispensing information using Top Sources Of Big Data Collection Big Data And Its Types Ppt Slises Master Slide. This template helps you present information on five stages. You can also present information on Media Data, Cloud Data, Web Data, Machine Data using this PPT design. This layout is completely editable so personaize it now to meet your audiences expectations.
-
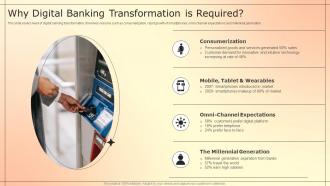 Why Digital Banking Transformation Is Required
This slide covers need of digital banking transformation. It involves reasons such as consumerization, rapid growth of smartphones, omni channel expectations and millennial generation. Introducing our premium set of slides with Why Digital Banking Transformation Is Required. Elucidate the four stages and present information using this PPT slide. This is a completely adaptable PowerPoint template design that can be used to interpret topics like Consumerization, Mobile, Tablet And Wearables, Omni Channel Expectations, The Millennial Generation. So download instantly and tailor it with your information.
-
 42339012 style essentials 2 financials 7 piece powerpoint presentation diagram infographic slide
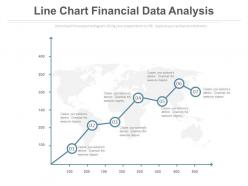
Perfect PPT slide for marketing and sales people, business analysts, market researchers. Completely editable content including fonts, text, colors, etc. Useful illustration of numerical figures using editable excel linked chart. Compatible with number of software options. Personalize the presentation with individual company name and logo. Excellence in picture quality even on wide screen output. Easy and quick downloading process. Flexible option for conversion in PDF or JPG formats. Compatible with Google slides.
-
 65042209 style essentials 2 financials 4 piece powerpoint presentation diagram template slide
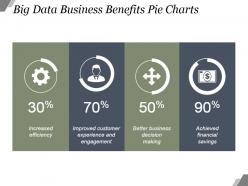
Presenting big data business benefits pie charts sample of ppt presentation. This is a big data business benefits pie charts sample of ppt presentation. This is a four stage process. The stages in this process are increased efficiency, improved customer experience and engagement, better business decision making, achieved financial savings.
-
 90334853 style division pie 2 piece powerpoint presentation diagram infographic slide
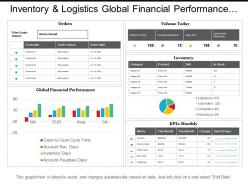
Presenting this set of slides with name - Inventory And Logistics Global Financial Performance Dashboards. This is a two stage process. The stages in this process are Inventory And Logistics, Inventory Management, Warehousing And Inventory Management.
-
 Return on investment roi expense ppt powerpoint presentation visual aids model
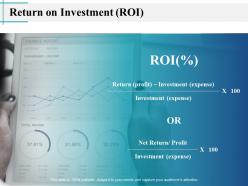
Presenting this set of slides with name Return On Investment ROI Expense Ppt Powerpoint Presentation Visual Aids Model. This is a one stage process. The stages in this process are Return On Investment, Finance, Marketing, Strategy, Analysis. This is a completely editable PowerPoint presentation and is available for immediate download. Download now and impress your audience.
-
 Person holding dollar bag icon
Presenting this set of slides with name Person Holding Dollar Bag Icon. This is a three stage process. The stages in this process are Person Holding Dollar Bag Icon. This is a completely editable PowerPoint presentation and is available for immediate download. Download now and impress your audience.
-
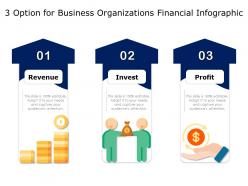 3 option for business organizations financial infographic
Presenting this set of slides with name 3 Option For Business Organizations Financial Infographic. This is a three stage process. The stages in this process are Revenue, Invest, Profit. This is a completely editable PowerPoint presentation and is available for immediate download. Download now and impress your audience.
-
 Business value added services icon with dollar sign
Presenting this set of slides with name Business Value Added Services Icon With Dollar Sign. This is a three stage process. The stages in this process are Business Value Added Services Icon With Dollar Sign. This is a completely editable PowerPoint presentation and is available for immediate download. Download now and impress your audience.
-
 Audit icon depicting accounting and finance investment
Introducing our premium set of slides with Audit Icon Depicting Accounting And Finance Investment. Elucidate the three stages and present information using this PPT slide. This is a completely adaptable PowerPoint template design that can be used to interpret topics like Audit Icon, Depicting Accounting, Finance Investment. So download instantly and tailor it with your information.
-
 Payroll Recording Calculation Icon With Spreadsheet
Introducing our premium set of slides with Payroll Recording Calculation Icon With Spreadsheet. Ellicudate the one stages and present information using this PPT slide. This is a completely adaptable PowerPoint template design that can be used to interpret topics like Payroll Recording, Calculation Icon, Spreadsheet. So download instantly and tailor it with your information.
-
 Six Steps Digital Merchant Onboarding
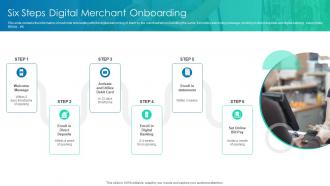
This slide contains the information of customer onboarding with the digital welcoming of them by the merchant who is handling the same. It includes welcoming message, enrolling in direct deposits and digital banking, setup online bill pay, etc. Presenting our set of slides with Six Steps Digital Merchant Onboarding. This exhibits information on six stages of the process. This is an easy to edit and innovatively designed PowerPoint template. So download immediately and highlight information on Welcome Message, Enroll Statements, Set Online, Bill Pay.
-
 Quarterly Company Revenue Summary With Key Updates
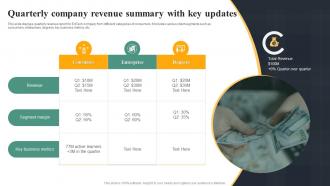
This slide displays quarterly revenue report for EdTech company from different categories of consumers. It includes various client segments such as consumers, enterprises, degrees, key business metrics, etc. Introducing our premium set of slides with name Quarterly Company Revenue Summary With Key Updates. Ellicudate the three stages and present information using this PPT slide. This is a completely adaptable PowerPoint template design that can be used to interpret topics like Revenue, Segment Margin, Key Business Metrics. So download instantly and tailor it with your information.
-
 Ways To Review Quarterly Business Performance
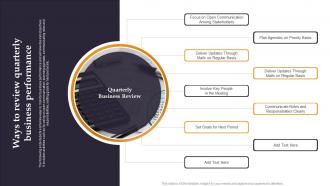
The following slide depicts some key ways to monitor business performance and achieve desired objectives. It includes activities such as focusing on open communication, planning agendas, communicating roles and responsibilities, setting goals for next period etc. Presenting our set of slides with Ways To Review Quarterly Business Performance. This exhibits information on one stages of the process. This is an easy to edit and innovatively designed PowerPoint template. So download immediately and highlight information on Communication Among Stakeholders, Communicate Role, Responsibilities Clearly.


