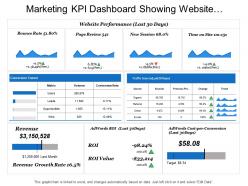
Financial Reviews and Accounting PPT Slides
-
 Marketing Management Planning For Financial Services Icon
Introducing our premium set of slides with Marketing Management Planning For Financial Services Icon. Ellicudate the three stages and present information using this PPT slide. This is a completely adaptable PowerPoint template design that can be used to interpret topics like Marketing Management Planning, Financial Services Icon.So download instantly and tailor it with your information.
-
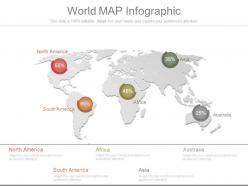 84007390 style essentials 1 location 5 piece powerpoint presentation diagram infographic slide
High resolution PPT example. Easy to edit and customize PPT graphics. Compatible with all software and can be saved in any format (JPEG/JPG/PDF). Useful tool for students, business analysts and professionals of any and every industry. Precise and easy to comprehend information on PPT sample. Freedom to personalize the content with company name and logo. Hassle free addition and deletion of content as per need. The stages in this process are north america, south america, africa, australia, asia.
-
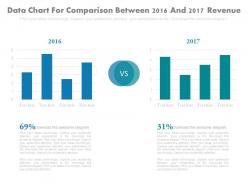 6722575 style essentials 2 financials 2 piece powerpoint presentation diagram infographic slide
PPT slides are simple to download. Highly compatible with Google slides and PowerPoint versions. High quality PowerPoint template illustrations. Customizable layout content, pictures, textual style shading and font. Convertible into PDF or JPG groups. Highly impactful PowerPoint template. Simply include organization logo, trademark or name in any PowerPoint slide. Perfect for business, innovation, ventures, experts, IT organizations, advertisers and so forth. The stages in this process are financials.
-
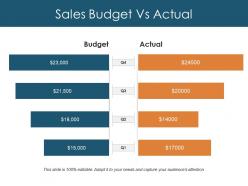 9700200 style essentials 2 financials 4 piece powerpoint presentation diagram infographic slide
Presenting this set of slides with name - Sales Budget Vs Actual Ppt Design Templates. This is a four stage process. The stages in this process are Business, Budget, Actual, Marketing, Graph.
-
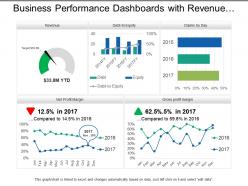 46870140 style essentials 2 dashboard 5 piece powerpoint presentation diagram infographic slide
Presenting, our business performance dashboards with revenue and ratios PPT deck. Pre-designed chart sheet directed PowerPoint Presentation template. Administration of high-resolution images, graphs, and comparison diagrams. Filled with methods and effects to create an impact. Can be quickly converted into JPEG/JPG or PDF formats as per the requirements. Congenial with Google Slides for ease. Project to widescreen without cringing about pixelating, after downloading explore these characteristics.
-
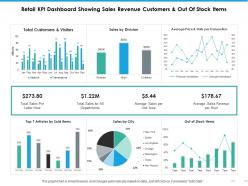 96954373 style essentials 2 financials 6 piece powerpoint presentation diagram infographic slide
Presenting this set of slides with name - Retail Kpi Dashboard Showing Sales Revenue Customers And Out Of Stock Items. This is a six stage process. The stages in this process are Percentage, Product, Management, Marketing, Business.
-
 86057273 style essentials 1 our vision 6 piece powerpoint presentation diagram infographic slide
High determination PPT visuals don't pixelate even after customization. All the PPT symbols, content, foundation and charts can be altered to coordinate your need. It can further be spared in any organization of your decision (JPG/JPEG/PDF). Compatible with various arrangement choices. Compatible with numerous product alternatives accessible both on the web and disconnected. Personalize it with organization name and logo of your own. It's a helpful PowerPoint slide plan for entrepreneurs, operations troughs, advertising official, educators and understudies.
-
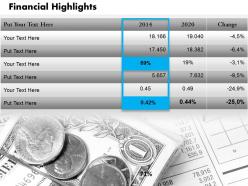 51470283 style essentials 2 financials 1 piece powerpoint presentation diagram infographic slide
Tremendous resolution PPT templates for better visual experience and for the use of financial experts and specialists from diverse fields, Fully editable features such as text, layout designs etc of the Presentation designs, Alluring Presentation graphics for the potential audiences to download easily, Space adequacy with all Presentation diagrams to add subsequent caption or subheading, Flexible option to convert in to various file layouts as PDF or JPG, Adaptable with all Google slides and other operating software’s.
-
 76103958 style layered vertical 5 piece powerpoint presentation diagram template slide
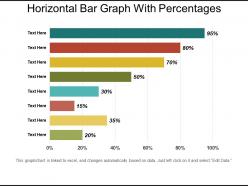
Presenting Horizontal Bar Graph With Percentages PowerPoint slide. This PowerPoint slide is completely editable so you can modify, font type, font color, shape and image according to your requirements. This Google Slides compatible PPT is available in 4:3 and 16:9 aspect ratios. Easy to download PPT layout and can be saved in different formats like JPG, PDF, and PNG.
-
 75448330 style concepts 1 growth 4 piece powerpoint presentation diagram infographic slide
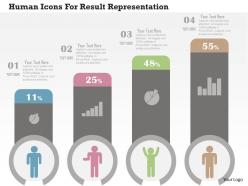
We are proud to present our human icons for result representation flat powerpoint design. This power point template diagram has been crafted with graphic of human icon. This PPT diagram contains the concept of result representation. Use this PPT diagram can be used for business and management related presentations.
-
 12724240 style essentials 2 financials 7 piece powerpoint presentation diagram infographic slide
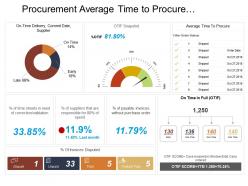
Presenting this set of slides with name - Procurement Average Time To Procure Dashboard. This is a seven stage process. The stages in this process are Purchase, Procurement, Buy.
-
 71368595 style concepts 1 growth 5 piece powerpoint presentation diagram infographic slide
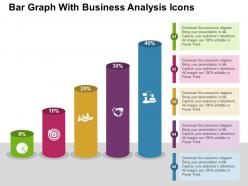
Proofing and editing can be done with ease in PPT design. Presentation slide is of utmost use to management professionals, big or small organizations and business startups. Smooth functioning is ensured by the presentation slide show on all software’s. When projected on the wide screen the PPT layout does not sacrifice on pixels or color resolution.
-
 1346526 style essentials 2 financials 4 piece powerpoint presentation diagram infographic slide
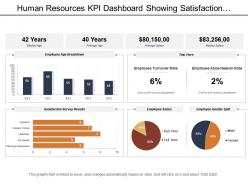
Presenting human resources KPI dashboard showing satisfaction survey result age breakdown data driven PowerPoint slide. Fit to be used with the Google slides. Replace the visuals, text and the content in the slide design. Change the size, style and orientation of the slides. Use your company’s name or brand name to make it your own presentation template. Beneficial for managers, professors, marketers, etc. Flexible option for conversion in PDF or JPG formats. Available in Widescreen format also. Useful for making business plan and strategies.
-
 79732641 style essentials 2 financials 4 piece powerpoint presentation diagram infographic slide
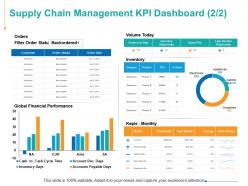
Presenting this set of slides with name - Supply Chain Management KPI Dashboard Finance Ppt Powerpoint Presentation Files. This is a four stage process. The stages in this process are Customer, Inventory, Marketing, Strategy, Planning.
-
 66854364 style essentials 2 financials 3 piece powerpoint presentation diagram infographic slide
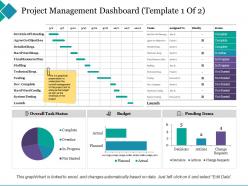
Presenting this set of slides with name - Project Management Dashboard Agree On Objectives. This is a three stage process. The stages in this process are Final Resource Plan, Agree On Objectives, System Testing.
-
 49697889 style essentials 2 financials 4 piece powerpoint presentation diagram infographic slide
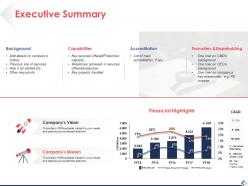
Presenting this set of slides with name - Executive Summary Background Ppt Pictures Slide Download. This is a four stage process. The stages in this process are Background, Capabilities, Accreditation, Promoters, Shareholding.
-
 2541773 style essentials 2 financials 1 piece powerpoint presentation diagram infographic slide
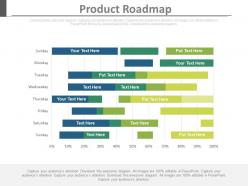
100% editable presentation slide. Compatible with Microsoft 2010 and 2013 versions. PPT visual offers high color resolution. Technology friendly diagram with amendable font size. 100% compatible with Google slide. Useful for product managers, company owners, sales and marketing support team. Freely edit the color, theme, size and orientation according to requirements. PPT diagram can be viewed in 4: 3 standard screen size or 16:9 wide screen size.
-
 27630691 style essentials 2 financials 5 piece powerpoint presentation diagram infographic slide
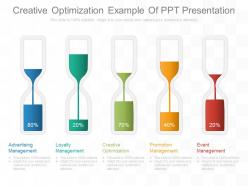
Compatibility with Google slides. Compatibility with various other formats and software options. High resolution visuals. Hassle free projection on wide screen, without getting any blurred image. Ease of modification. Execute the desired changes in the text, color, orientation and fonts. Assistance for executing changes in form of pictorial guidelines. Widely accessed by team of brand managers, advertisers, marketing teams and entrepreneurs to boost up their market presence and revenue.The stages in this process are advertising management, loyalty management, creative optimization, promotion management, event management.
-
 94541290 style linear single 6 piece powerpoint presentation diagram infographic slide
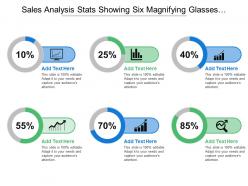
Presenting this set of slides with name - Sales Analysis Stats Showing Six Magnifying Glasses And Percentages. This is a six stage process. The stages in this process are Stats, Statistics, Data.
-
 24565545 style essentials 2 financials 4 piece powerpoint presentation diagram infographic slide
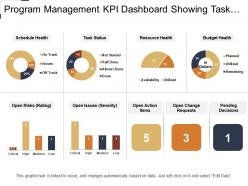
Presenting Program Management KPI Dashboard Showing Task Status And Budget Health PPT slide. The task status dashboard PowerPoint template designed professionally by the team of SlideTeam to present the current status of the project. The different icons such as pie chart, semi-circle, square box, line chart and many other which include text in the Budget health dashboard slide are customizable in PowerPoint. A user can populate the pie chart and line chart values by editing the excel table and it is also compatible with Google Slide. A user can alter the font size, font type, color and dimensions of the line chart and pie chart to show the desired values.
-
 98452619 style essentials 2 financials 5 piece powerpoint presentation diagram infographic slide
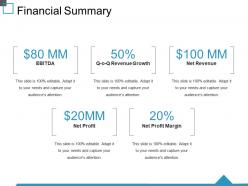
Presenting this set of slides with name - Financial Summary Ppt Deck. This is a five stage process. The stages in this process are Ebitda, Net Profit, Net Profit Margin, Net Revenue, Revenue Growth.
-
 77709887 style essentials 2 financials 2 piece powerpoint presentation diagram infographic slide
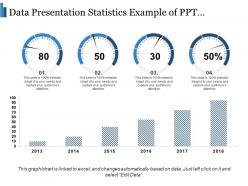
Presenting this set of slides with name - Data Presentation Statistics Example Of Ppt Presentation. This is a two stage process. The stages in this process are Data Presentation, Content Presentation, Information Presentation.
-
 6070909 style essentials 2 financials 5 piece powerpoint presentation diagram infographic slide
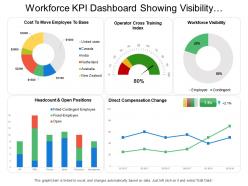
Presenting this set of slides with name - Workforce Kpi Dashboard Showing Visibility Headcount And Direct Compensation Change. This is a five stage process. The stages in this process are Staff, Personnel, Workforce.
-
 75062245 style essentials 2 financials 3 piece powerpoint presentation diagram infographic slide
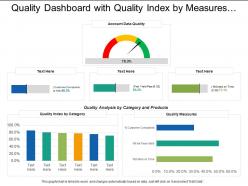
Presenting this set of slides with name - Quality Dashboard With Quality Index By Measures And Quality Index. This is a three stage process. The stages in this process are Quality Dashboard, Quality Kpi, Quality Metircs.
-
 1316560 style essentials 2 financials 6 piece powerpoint presentation diagram infographic slide
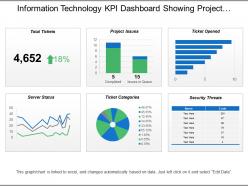
Presenting this set of slides with name - Information Technology Kpi Dashboard Showing Project Issues Server Status. This is a six stage process. The stages in this process are Information Technology, It, Iot.
-
 56424059 style essentials 2 financials 4 piece powerpoint presentation diagram infographic slide
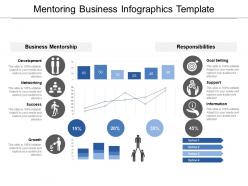
Presenting this set of slides with name - Mentoring Business Infographics Template. This is a four stage process. The stages in this process are Mentoring, Advise, Trainee.
-
 93177794 style essentials 2 financials 7 piece powerpoint presentation diagram infographic slide
This PowerPoint presentation can be used to display your business and finance related presentations. The elements used in this PPT slide can easily be edited by means of the change in color or editing the text or size. You can change the icons to your liking. PPT slides are compatible with Google slides and can be edited in any PowerPoint software.
-
 18697346 style concepts 1 growth 2 piece powerpoint presentation diagram infographic slide
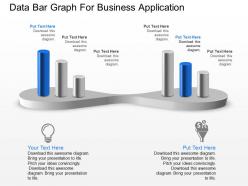
Presenting, data bar graph for business application PowerPoint template slide. Modifiable PPT Slide, edit the bar colors shown and personalize the text with your data. Convertible into various format options like JPEG, JPG or PDF. Display option available such as standard and widescreen view, available in 4:3 standard and full screen version 16:9. Liberty to customize it with company name and logo. Helpful for business professionals, students, teachers, business analysts and strategists. Compatible with google slides as well.
-
 2989873 style concepts 1 growth 7 piece powerpoint presentation diagram template slide
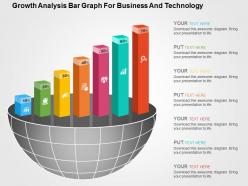
High resolution Presentation slide comes with great picture quality. Download is fast which saves time as well as effort. Customize it by inserting corporation name and logo. Display in both Standard and Widescreen format. Totally responsive and works well with Google slides. Download PPT design to insert text and share. PowerPoint template comes with creative and professional approach. Presentation graphic comes with great pixel quality which ensures better experience for the audience.
-
 77288941 style essentials 2 financials 3 piece powerpoint presentation diagram infographic slide
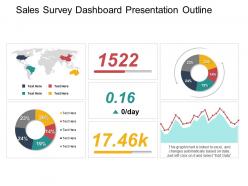
Presenting sales survey dashboard snapshot presentation outline. The slideshow is fully flexible. You can incorporate them into any PowerPoint without worrying about compatibilities. It is fully compatible with Google Slides and Microsoft PowerPoint. Except this, you will get full versatility. PPT can be downloaded into JPEG and PDF formats. You can modify and personalize the design the way you want. All the design elements are 100% editable.
-
 48295751 style essentials 2 financials 2 piece powerpoint presentation diagram infographic slide
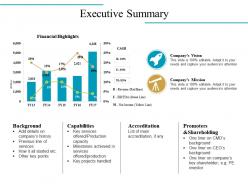
Presenting this set of slides with name - Executive Summary Powerpoint Slides Design. This is a two stage process. The stages in this process are Background, Capabilities, Accreditation, Promoters And Shareholding, Financial Highlights.
-
 Wealth Management Various Client Obligations In Wealth Management Fin SS
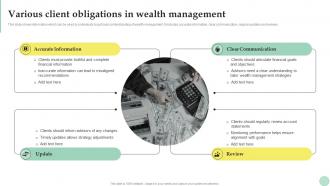
This slide shows information which can be used by individuals to get basic understanding of wealth management. It includes accurate information, clear communication, regular updates and reviews. Introducing Wealth Management Various Client Obligations In Wealth Management Fin SS to increase your presentation threshold. Encompassed with Four stages, this template is a great option to educate and entice your audience. Dispence information on Accurate Information, Update, Review using this template. Grab it now to reap its full benefits.
-
 75757132 style essentials 2 dashboard 4 piece powerpoint presentation diagram infographic slide
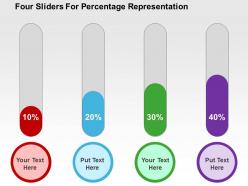
We are proud to present our four sliders for percentage representation flat powerpoint design. This power point template diagram has been crafted with graphic of four sliders and percentage. This PPT diagram contains the concept of financial analysis. Use this PPT diagram for business and finance related presentations.
-
 53688882 style essentials 2 financials 6 piece powerpoint presentation diagram infographic slide
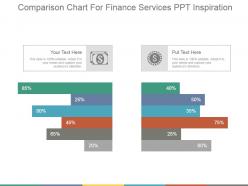
Presenting comparison chart for finance services ppt inspiration. This is a comparison chart for finance services ppt inspiration. This is a six stage process. The stages in this process are comparison, finance, percentage, analysis, service.
-
 96728049 style essentials 2 financials 1 piece powerpoint presentation diagram infographic slide
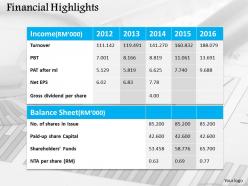
PowerPoint visual exhibited in both standard and widescreen display view options. Totally modifiable PPT template as editing allowed with fonts, text and color. Presentation slides are easy-going with Google slides. Similar designs accessible with different nodes and stages. Accessibility to convert the presentation graphic by accumulating business emblem and picture. Smooth download and adapt into JPEG and PDF document.
-
 71908706 style essentials 2 financials 3 piece powerpoint presentation diagram infographic slide
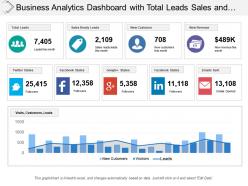
This is a three stage process. The stages in this process are Business Analytics, BA, Organizations Data.
-
 38066548 style essentials 2 financials 4 piece powerpoint presentation diagram infographic slide
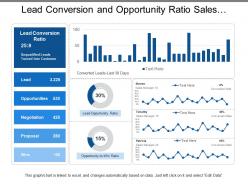
Presenting this set of slides with name - Lead Conversion And Opportunity Ratio Sales Dashboards. This is a four stage process. The stages in this process are Sales Dashboard, Sales Kpis, Sales Performance.
-
 39009934 style essentials 2 financials 1 piece powerpoint presentation diagram infographic slide
Presenting financial data table for analysis powerpoint slides. This Power Point template slide has been crafted with graphic of data table. This PPT slide contains the concept of financial data analysis. Use this PPT slide for business and finance related presentations.
-
 18224459 style essentials 2 financials 3 piece powerpoint presentation diagram infographic slide
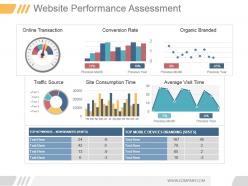
Presenting website performance assessment powerpoint ideas. This is a website performance assessment powerpoint ideas. This is a three stage process. The stages in this process are online transaction, conversion rate, organic branded, traffic, source, site consumption time, average visit time, previous month, previous year, top keywords non branded visits, top mobile devices branding visits.
-
 52575297 style essentials 2 financials 6 piece powerpoint presentation diagram infographic slide
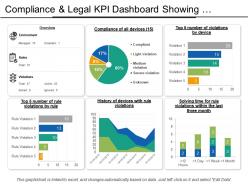
Presenting this set of slides with name - Compliance And Legal Kpi Dashboard Showing Violations By Devices. This is a six stage process. The stages in this process are Compliance And Legal, Legal Governance, Risk Management.
-
 77431059 style essentials 2 financials 5 piece powerpoint presentation diagram infographic slide
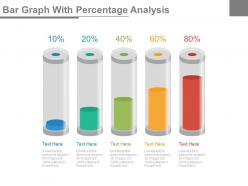
Presenting bar graph with percentage analysis powerpoint slides. This is a bar graph with percentage analysis powerpoint slides. This is a five stage process. The stages in this process are financials.
-
 11778184 style essentials 2 financials 1 piece powerpoint presentation diagram infographic slide
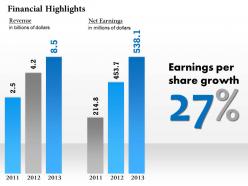
All images are 100% editable in the presentation design. Good quality images can be used to compliment message. Works well in Windows 7, 8, 10, XP, Vista and Citrix. Editing in presentation slide show can be done from anywhere by any device. Students, teachers, businessmen or industrial managers can put to use the PPT layout as per their requirement. Compatibility with Google slides.
-
 54959374 style division donut 7 piece powerpoint presentation diagram infographic slide
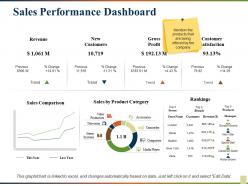
Presenting this set of slides with name - Sales Performance Dashboard. This is a seven stage process. The stages in this process are Revenue, New Customers, Gross Profit, Customer Satisfaction, Rankings .
-
 90426821 style essentials 2 dashboard 3 piece powerpoint presentation diagram template slide
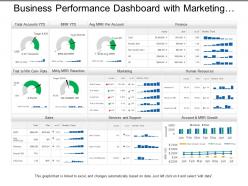
Presenting, business performance dashboard with marketing human resource and sales PPT deck. This PPT deck focuses on one of the aspects of business marketing with content broadly researched by our business research team. Quickly editable color combinations, layout, text boxes, and font. Alluring graphs for illustration with relatable images to explain the concept. Transform into PDF and JPG format at ease. Predesigned content is adaptable and can be projected to widescreen for business meetings.
-
 12396883 style essentials 2 financials 3 piece powerpoint presentation diagram infographic slide
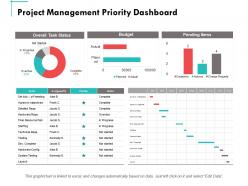
Presenting this set of slides with name - Project Management Priority Dashboard Ppt Powerpoint Presentation Summary Slide Download. This is a two stages process. The stages in this process are Finance, Marketing, Management, Investment, Analysis.
-
 89945690 style essentials 2 financials 4 piece powerpoint presentation diagram infographic slide
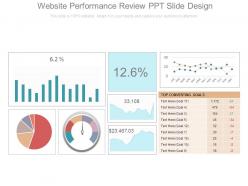
Presenting website performance review ppt slide design. This is a website performance review ppt slide design. This is a four stage process. The stages in this process are business, strategy, finance, management, marketing.
-
 23855746 style essentials 2 financials 1 piece powerpoint presentation diagram infographic slide
Presenting this set of slides with name - Project Management Dashboard Budget By Employee. This is a one stage process. The stages in this process are Percentage, Product, Marketing, Management, Business.
-
 44784490 style essentials 2 financials 6 piece powerpoint presentation diagram infographic slide
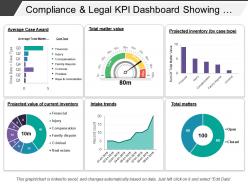
Presenting this set of slides with name - Compliance And Legal Kpi Dashboard Showing Total Matter Value. This is a six stage process. The stages in this process are Compliance And Legal, Legal Governance, Risk Management.
-
 93415343 style essentials 2 financials 4 piece powerpoint presentation diagram infographic slide
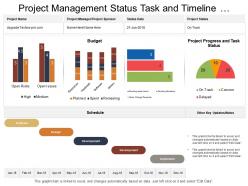
PPT design comes with access to include or exclude content as per the business need. Presentation template is available in both standard as well as in widescreen slide. PowerPoint slide provides a professional perspective to presentation. Harmonious with various formats like JPEG and PDF as well as with Google slides. Entirely editable and personalization of PPT graphic is enabled for your use. Matching PowerPoint slides are available with different nodes and stages.
-
 38249005 style division pie 3 piece powerpoint presentation diagram infographic slide
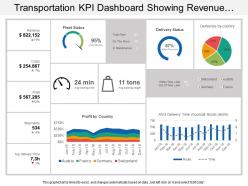
Presenting KPI dashboard snapshot showing revenue costs profit fleet status slideshow. Change PowerPoint structure, font, text, color and design as per your requirements. Easy to input data with excel linked charts, just right to click to input data. This presentation theme is totally attuned with Google slides. Easy conversion to other software’s like JPG and PDF formats. Image quality of these PPT diagram remains the unchanged even when you resize the image or portray on large screens.
-
 63031800 style essentials 2 financials 3 piece powerpoint presentation diagram infographic slide
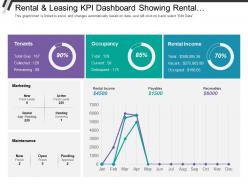
As this PPT presentation is fully editable you change the size, orientation and color of the various graphical illustrations used in the pre-designed slides. You can edit the font size, font color and even the font style of the text used here. After you download the slideshow you can view it in standard size display ratio of 4:3 or widescreen display ratio of 16:9 conveniently. Any changes that you need to make can be made following instructions given in the sample slides.
-
 60984909 style essentials 2 financials 1 piece powerpoint presentation diagram infographic slide
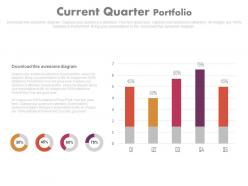
This PPT slide can be used by anyone looking to project their business process through a flow chart. This PowerPoint template is 100% editable, which means text, color, and shapes of the given elements can be altered according to your liking and you can choose icons among the thousands of options available. These slides are also compatible with Google slides.
-
 31289859 style concepts 1 growth 4 piece powerpoint presentation diagram infographic slide
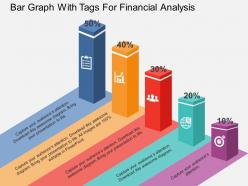
Skillfully crafted bar graph with financial analysis PowerPoint slide. Amendable color, text, layout as per the preference and industry requirement. PPT illustration accessible in standard and widescreen display view. Quick download and easy to alter into other formats available such as JPG and PDF. Access to add business information i.e. name, sign, logo etc.
-
 24151957 style essentials 2 financials 5 piece powerpoint presentation diagram infographic slide
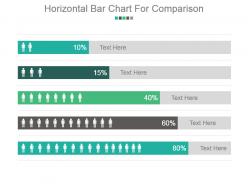
Presenting horizontal bar chart for comparison PPT slide. This presentation graph chart is fully editable in PowerPoint. You can customize the font type, font size, colors of the chart and background color as per your requirement. The slide is fully compatible with Google slides and can be saved in JPG or PDF format without any hassle. High quality graphics and icons ensure that there is no deteriorating in quality on enlarging their size. Have the tendency to boost the overall impression of your presentation.
-
 95747808 style essentials 2 financials 4 piece powerpoint presentation diagram infographic slide
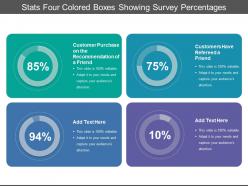
Presenting this set of slides with name - Stats Four Colored Boxes Showing Survey Percentages. This is a four stage process. The stages in this process are Stats, Statistics, Data.
-
 App metrics dashboard active users ppt powerpoint presentation outline visuals
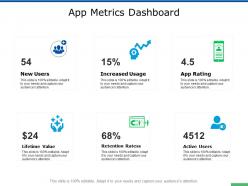
Presenting this set of slides with name App Metrics Dashboard Active Users Ppt Powerpoint Presentation Outline Visuals. This is a six stage process. The stages in this process are Finance, Analysis, Business, Investment, Marketing. This is a completely editable PowerPoint presentation and is available for immediate download. Download now and impress your audience.
-
 7989963 style essentials 2 financials 1 piece powerpoint presentation diagram infographic slide
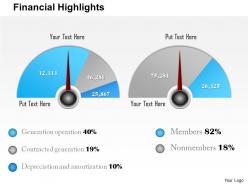
All images are 100% editable in the presentation design. Good quality images can be used to compliment message. Works well in Windows 7, 8, 10, XP, Vista and Citrix. Editing in presentation slide show can be done from anywhere by any device. Students, teachers, businessmen or industrial managers can put to use the PPT layout as per their requirement. PPT graphic offers font size which can be read from a distance.
-
 67177481 style concepts 1 growth 5 piece powerpoint presentation diagram infographic slide
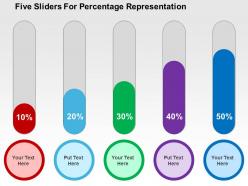
Business oriented PowerPoint presentation slides. Easy and convenient downloading by following simple steps. No concession with the quality once opened on wide screen. Editable visuals, colors and text. Modify and personalize the presentation by including the company name and logo. Guidance for executing the changes has been provided for assistance. Useful for sales leaders, marketers, business professionals, analysts, strategists, students, teachers, etc.
-
 22156387 style division donut 4 piece powerpoint presentation diagram infographic slide
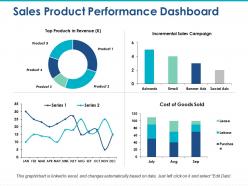
Providing sales product performance dashboard incremental sales campaign presentation template with editing preference as images, icons, colors, text and layout can be edit as required. PowerPoint design can be downloaded and save into JPG and PDF format. High resolution ensures no pixel break. PPT diagram downloadable in standard and widescreen view. Fully adjustable slide as works well with Google slides. Easy to adjust and present when required. Quick to share message effectively.


