82472216 style essentials 2 financials 2 piece powerpoint presentation diagram infographic slide
Ensure folks don't get hurt by the jig with our Warehouse Kpi Dashboard Powerpoint Ideas. Introduce the desired degree of caution.
Ensure folks don't get hurt by the jig with our Warehouse Kpi Dashboard Powerpoint Ideas. Introduce the desired degree of ..
- Google Slides is a new FREE Presentation software from Google.
- All our content is 100% compatible with Google Slides.
- Just download our designs, and upload them to Google Slides and they will work automatically.
- Amaze your audience with SlideTeam and Google Slides.
-
Want Changes to This PPT Slide? Check out our Presentation Design Services
- WideScreen Aspect ratio is becoming a very popular format. When you download this product, the downloaded ZIP will contain this product in both standard and widescreen format.
-

- Some older products that we have may only be in standard format, but they can easily be converted to widescreen.
- To do this, please open the SlideTeam product in Powerpoint, and go to
- Design ( On the top bar) -> Page Setup -> and select "On-screen Show (16:9)” in the drop down for "Slides Sized for".
- The slide or theme will change to widescreen, and all graphics will adjust automatically. You can similarly convert our content to any other desired screen aspect ratio.
Compatible With Google Slides

Get This In WideScreen
You must be logged in to download this presentation.
PowerPoint presentation slides
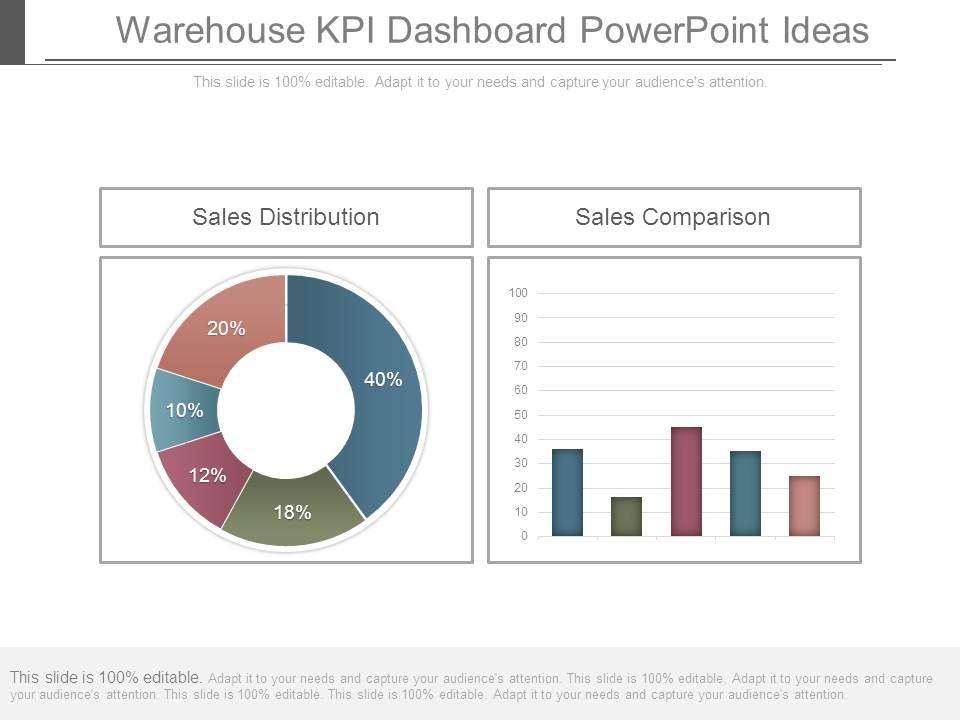
Presenting warehouse kpi dashboard powerpoint ideas. This is a warehouse kpi dashboard powerpoint ideas. This is a two stage process. The stages in this process are sales distribution, sales comparison.
Content of this Powerpoint Presentation
Description:
The image showcases a PowerPoint slide titled "Warehouse KPI Dashboard PowerPoint Ideas," featuring two graphs comparing different sales metrics. On the left is a "Sales Distribution" pie chart, illustrating segments representing various values: 40%, 20%, 18%, 12%, and 10%. On the right is a "Sales Comparison" bar graph, with multiple bars indicating a comparison between different periods or categories in sales. Notably, the axes and specific data points are unlabeled, suggesting flexibility in customization.
Below the graphs, a statement underscores that the slide is "100% editable," indicating its adaptability to suit the presenter's needs and capture the audience's attention. This implies that the charts can be tailored to specific data sets and presentation requirements.
Use Cases:
The slide's focus on sales distribution and comparison makes it suitable for industries where monitoring sales performance and distribution is paramount. Here are seven industries where these slides can be effectively utilized:
1. Retail:
Use: Tracking product category sales
Presenter: Store manager
Audience: Retail staff
2. Manufacturing:
Use: Visualizing product line performance
Presenter: Operations manager
Audience: Production team
3. E-commerce:
Use: Analyzing online sales trends
Presenter: Marketing analyst
Audience: E-commerce team
4. Pharmaceuticals:
Use: Comparing sales of different drug categories
Presenter: Sales director
Audience: Pharmaceutical sales representatives
5. Automotive:
Use: Displaying sales distribution by model or region
Presenter: Regional sales manager
Audience: Dealership owners
6. Technology:
Use: Presenting software or service sales data
Presenter: Business development manager
Audience: Sales and marketing teams
7. Consumer Goods:
Use: Reviewing market share across product lines
Presenter: Brand manager
Audience: Management and stakeholder group
82472216 style essentials 2 financials 2 piece powerpoint presentation diagram infographic slide with all 4 slides:
Shake hands with destiny with our Warehouse Kpi Dashboard Powerpoint Ideas. They allow you to get a firm grip.
-
Perfect template with attractive color combination.
-
Content of slide is easy to understand and edit.


