Easy-to-Edit 5-step All Essential Financial Presentation Diagram
-
 64576991 style essentials 2 financials 5 piece powerpoint presentation diagram infographic slide
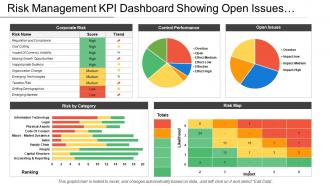
Presenting this set of slides with name - Risk Management Kpi Dashboard Showing Open Issues And Control Performance. This is a five stage process. The stages in this process are Risk Management, Risk Assessment, Project Risk.
-
 35237686 style essentials 2 financials 5 piece powerpoint presentation diagram infographic slide
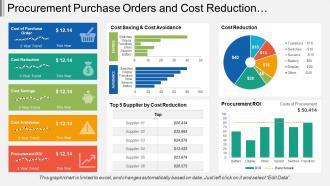
Presenting this set of slides with name - Procurement Purchase Orders And Cost Reduction Dashboard. This is a five stage process. The stages in this process are Purchase, Procurement, Buy.
-
 60025955 style essentials 2 financials 5 piece powerpoint presentation diagram infographic slide
Presenting key metrics powerpoint slide. This is a key metrics powerpoint slide. This is a five stage process. The stages in this process are new customers per month, customer satisfaction, customer retention rate, on time delivery.
-
 62107827 style essentials 2 financials 5 piece powerpoint presentation diagram infographic slide
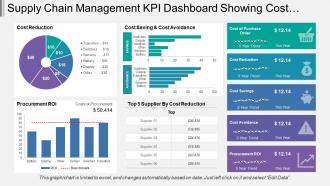
Presenting this set of slides with name - Supply Chain Management Kpi Dashboard Showing Cost Reduction And Procurement Roi. This is a five stage process. The stages in this process are Demand Forecasting, Predicting Future Demand, Supply Chain Management.
-
 3956742 style essentials 2 financials 5 piece powerpoint presentation diagram infographic slide
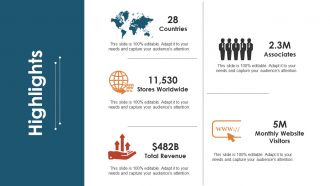
Presenting this set of slides with name - Highlights Ppt Graphics. This is a five stage process. The stages in this process are Stores Worldwide, Total Revenue, Monthly Website Visitors, Associates, Countries.
-
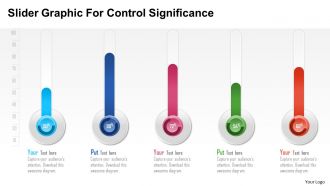 225702 style essentials 2 dashboard 5 piece powerpoint presentation diagram infographic slide
We are proud to present our slider graphic for control significance powerpoint template. Graphic of slider has been used to craft this power point template. This PPT diagram contains the concept of control. Use this PPT diagram for business and marketing related presentations.
-
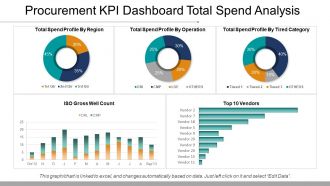 66265408 style essentials 2 financials 5 piece powerpoint presentation diagram infographic slide
Presenting procurement kpi dashboard total spend analysis ppt samples. This is a procurement kpi dashboard total spend analysis ppt samples. This is a five stage process. The stages in this process are business, strategy, growth, finance, chart and graph.
-
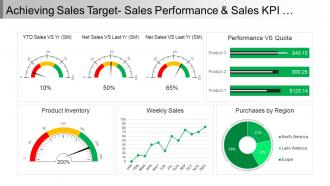 86455950 style essentials 2 financials 5 piece powerpoint presentation diagram infographic slide
Presenting Achieving Sales Target Sales Performance and Sales KPI Dashboard Snapshot PPT Icon. This presentation includes five stage processes with all the instructions to customize as per your needs and preferences. The stages in this process are sales objectives, sales goal, achieving sales target. You can add your brand’s name, logo or label for that extra impact. The Complete information and Enhanced Visuals are the strongest points of this Sales KPI Dashboard PPT.
-
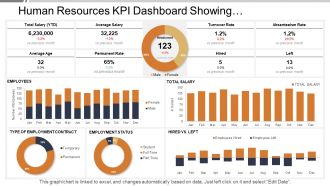 27024422 style essentials 2 financials 5 piece powerpoint presentation diagram infographic slide
SlideTeam presents the Human Resources Kpi Dashboard Showing Employment Status Turnover Rate PPT which will help you keep a track of the human capital working under you. All the slides in the slideshow are 100 percent editable and you can make all the desired changes in the presentation. You can also add or delete the slides All the slides are fully compatible with Google slides as well. Your audience will be amazed by Google slides. You can even view the document in 16:9 widescreen size.
-
 32758047 style essentials 2 financials 5 piece powerpoint presentation diagram infographic slide
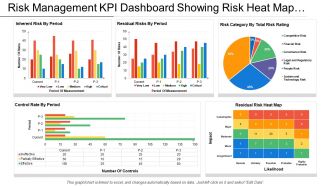
Presenting this set of slides with name - Risk Management Kpi Dashboard Showing Risk Heat Map And Control Rate By Period. This is a five stage process. The stages in this process are Risk Management, Risk Assessment, Project Risk.
-
 46459822 style essentials 2 financials 5 piece powerpoint presentation diagram infographic slide
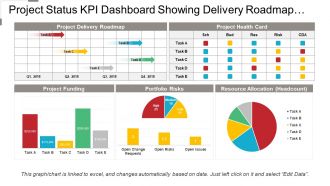
Presenting project status KPI dashboard snapshot showing delivery roadmap and resource allocation. Simple data input with linked Excel chart, just right click to input values. This PowerPoint theme is fully supported by Google slides. Picture quality of these slides does not change even when project on large screen. Fast downloading speed and formats can be easily changed to JPEG and PDF applications. This template is suitable for marketing, sales persons, business managers and entrepreneurs. Adjust PPT layout, font, text and color as per your necessity.
-
 83204842 style essentials 2 financials 5 piece powerpoint presentation diagram infographic slide
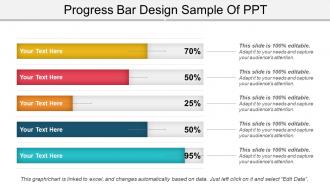
Presenting a PowerPoint slide named Progress Bar Design Sample of PPT. Use this completely customizable and easy-to-edit PPT slide to communicate your ideas in the presentation. You can format the font size, color and style of the slide. Add your desired content anywhere in the slide. Its compatibility with Google Slides makes it readily accessible. You can save it in PDF, JPEG or JPG formats. This PPT slide is Excel-linked. You can avail it in a widescreen size as well a standard size screen.
-
 36987347 style essentials 2 financials 5 piece powerpoint presentation diagram infographic slide
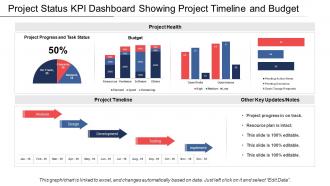
Presenting this set of slides with name - Project Status Kpi Dashboard Showing Project Timeline And Budget. This is a five stage process. The stages in this process are Project Health Card, Project Performance, Project Status.
-
 54724502 style essentials 2 financials 5 piece powerpoint presentation diagram infographic slide
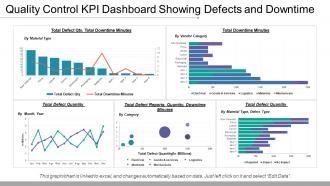
Presenting this set of slides with name - Quality Control Kpi Dashboard Showing Defects And Downtime. This is a five stage process. The stages in this process are Quality Management, Quality Control, Quality Assurance.
-
 38203634 style essentials 2 financials 5 piece powerpoint presentation diagram infographic slide
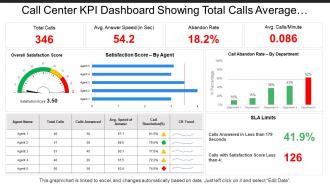
Presenting this set of slides with name - Call Center Kpi Dashboard Showing Total Calls Average Answer Speed Abandon Rate. This is a five stage process. The stages in this process are Call Center Agent, Customer Care, Client Support.
-
 75506128 style essentials 2 financials 5 piece powerpoint presentation diagram infographic slide
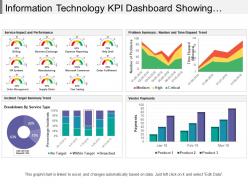
Presenting this set of slides with name - Information Technology Kpi Dashboard Showing Incident Target Summary Trend. This is a five stage process. The stages in this process are Information Technology, It, Iot.
-
 42986457 style essentials 2 financials 5 piece powerpoint presentation diagram infographic slide
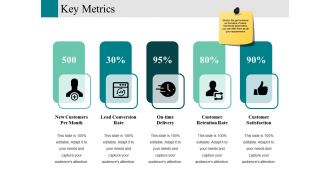
Presenting this set of slides with name - Key Metrics Ppt Design. This is a five stage process. The stages in this process are New Customers Per Month, Lead Conversion Rate, On Time Delivery, Customer Retention Rate, Customer Satisfaction.
-
 70238124 style essentials 2 financials 5 piece powerpoint presentation diagram infographic slide
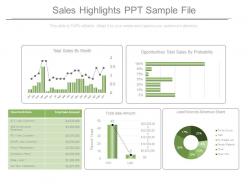
Presenting sales highlights ppt sample file. This is a sales highlights ppt sample file. This is a five stage process. The stages in this process are total sales by month, opportunities total sales by probability, opportunity name amount, total sale amount, lead sources revenue share.
-
 38673194 style essentials 2 financials 5 piece powerpoint presentation diagram infographic slide
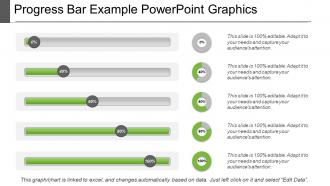
We brings to you the progress bar example PowerPoint graphics. You can download this PPT completely free of cost. You just have to edit the data in a pre-designed format and present it. You can insert pictures and new slides to this ready-made deck of slides. All these slides are fully compatible with Google Slides. This presentation can be downloaded in JPG and PDF formats. It can be viewed in the 16:9 ratio widescreen size and the ratio of 4:3 standard screen size.
-
 47173408 style essentials 2 financials 5 piece powerpoint presentation diagram infographic slide
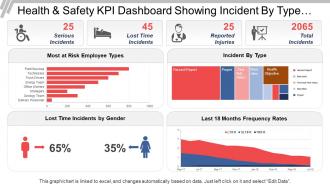
Presenting the dashboard presentation slide. This KPI dashboard is fully editable and is designed by professionals looking for professional presentation design. You can edit the objects in the slide like font size and font color easily. This presentation slide is fully compatible with Google Slide and can be saved in JPG or PDF file format without any hassle. Click on the download button below.
-
 55091760 style essentials 2 financials 5 piece powerpoint presentation diagram infographic slide
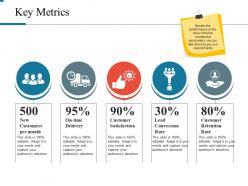
Presenting key metrics powerpoint slide background designs. This is a key metrics powerpoint slide background designs. This is a five stage process. The stages in this process are new customers per month, on time delivery, customer satisfaction, lead conversion rate, customer retention rate.
-
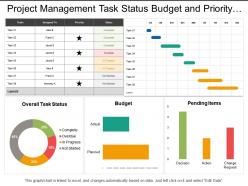 44848897 style essentials 2 financials 5 piece powerpoint presentation diagram infographic slide
Stunning project management task status budget and priority dashboard PowerPoint template. Choice to display PowerPoint template in standard and widescreen view. Presentation designs are well-suited with Google slides or MS Office PowerPoint programs. Can be transformed into JPG and PDF format. Trouble-free replacement of your company’s logo. Access to open on a big screen display. Perfect for business professionals, managers and industry leaders. Trustworthy and accurate PowerPoint slide show. Customize the fonts, colors, layout, etc.as per your requirements and business needs.
-
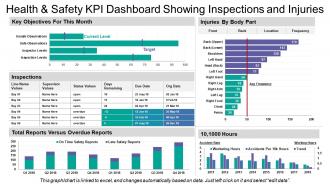 18379402 style essentials 2 financials 5 piece powerpoint presentation diagram infographic slide
Presenting this set of slides with name - Health And Safety Kpi Dashboard Showing Inspections And Injuries. This is a five stage process. The stages in this process are Health And Safety, Health And Security, Health And Protection.
-
 54690711 style concepts 1 opportunity 5 piece powerpoint presentation diagram infographic slide
Presenting ppt financial idea sharing analysis diagram flat powerpoint design. Presenting ppt financial idea sharing analysis diagram flat powerpoint design. This Power Point template diagram has been crafted with graphic of dollar symbol and hands diagram. This PPT diagram contains the concept of financial idea sharing analysis. Use this PPT diagram for business and finance related presentations.
-
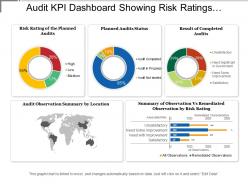 22344256 style essentials 2 financials 5 piece powerpoint presentation diagram infographic slide
Presenting this set of slides with name - Audit Kpi Dashboard Showing Risk Ratings Planned Audit Status. This is a five stage process. The stages in this process are Audit, Examine, Survey.
-
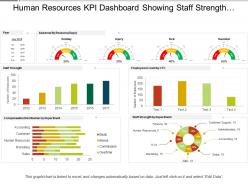 29565185 style essentials 2 financials 5 piece powerpoint presentation diagram infographic slide
SlideTeam presenting Human Resources Kpi Dashboard Showing Staff Strength Compensation Distribution PPT. It will not only help you in knowing the exact strength of the staff but also about actual staff required in the organization. This slideshow is entirely editable and you can edit it whenever you want. All the slides in this presentation are compatible with Google slides. You can enter thousands of relatable icons of your own choice. You can also change from 4:3 standard screen size to 16:9 widescreen size.
-
 13780812 style essentials 2 financials 5 piece powerpoint presentation diagram infographic slide
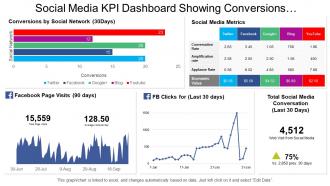
Presenting this set of slides with name - Social Media Kpi Dashboard Showing Conversions By Social Network And Metrics. This is a five stage process. The stages in this process are Social Media, Digital Marketing, Social Marketing.
-
 74178600 style essentials 2 financials 5 piece powerpoint presentation diagram infographic slide
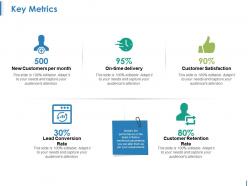
Presenting this set of slides with name - Key Metrics Ppt Design Templates. This is a five stage process. The stages in this process are New Customers Per Month, On Time Delivery, Customer Satisfaction, Lead Conversion Rate, Customer Retention Rate.
-
 33483861 style essentials 2 financials 5 piece powerpoint presentation diagram infographic slide
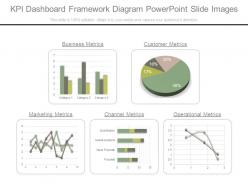
PowerPoint template easy to modify as color, text, font etc are amendable. Notable quality presentation image. Well-adjusted online software programs such as JPG and PDF. Extra-ordinary picture quality as pixels don’t break when viewed in widescreen view. PPT design goes well with Google slides. Matching designs available with different nodes and stages. Handy presentation design saves you valuable time. Show the PowerPoint diagram with your corporate sign and title. Easy to download and can be saved for future reference.
-
 2453731 style division donut 5 piece powerpoint presentation diagram template slide
Presenting business development statistics results slide powerpoint templates. This is a business development statistics results slide powerpoint templates. This is a five stage process. The stages in this process are results, output, deliverables, goals.
-
 34879238 style essentials 2 financials 5 piece powerpoint presentation diagram infographic slide
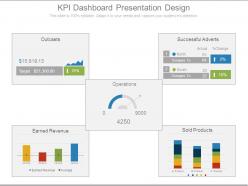
Presenting kpi dashboard presentation design. This is a kpi dashboard presentation design. This is a five stage process. The stages in this process are outcasts, operations, successful adverts, earned revenue, sold products.
-
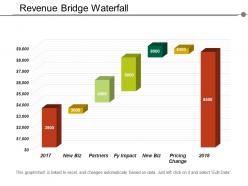 70284488 style essentials 2 financials 5 piece powerpoint presentation diagram infographic slide
Presenting the waterfall presentation template for PowerPoint. This PPT template is fully modifiable and is professionally designed. You can personalize the objects in the slide like font color and font size without any hassle. This PPT slide is 100% compatible with Google Slide and can be saved in JPG or PDF file format easily. Click on the download button below.
-
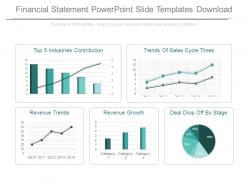 44966581 style essentials 2 financials 5 piece powerpoint presentation diagram infographic slide
Presenting financial statement powerpoint slide templates download. This is a financial statement powerpoint slide templates download. This is a five stage process. The stages in this process are top 5 industries contribution, trends of sales cycle times, revenue trends, revenue growth, deal drop off by stage.
-
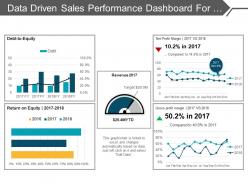 12592497 style essentials 2 financials 5 piece powerpoint presentation diagram infographic slide
Presenting a PPT slide named Data driven sales performance dashboard for achieving sales target PPT slides. This PPT slide is Excel driven and easily customizable. The font style, the font color and the font size can be easily edited by a mere click. Access this presentation easily anywhere as it is compatible with Google slides. You can convert and save this slide in PDF or JPG formats. Add or delete content from the given slide as per your convenience. You can add icons to make it more impressive. You can choose from thousands of high quality icons. Download and enjoy the professionally designed PPT slide.
-
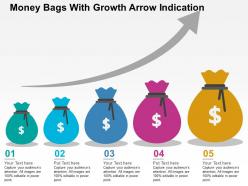 44703304 style concepts 1 growth 5 piece powerpoint presentation diagram infographic slide
Beautifully crafted and professionally equipped PowerPoint template. Choice to edit the PPT slide as changes can be done with color, text and shape. Direction to modify the presentation design as per the business requirement. Customization is possible as can add commerce image, symbol etc. PPT diagram compatible with Google slides. Alternate to share in standard as well as in widescreen view. Availability to download with different nodes and stages.
-
 56370307 style essentials 2 financials 5 piece powerpoint presentation diagram infographic slide
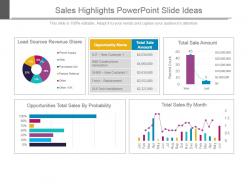
Presenting sales highlights powerpoint slide ideas. This is a sales highlights powerpoint slide ideas. This is a five stage process. The stages in this process are lead sources revenue share, opportunity name, total sale amount, total sale amount, opportunities total sales by probability, total sales by month.
-
 58325568 style essentials 2 financials 5 piece powerpoint presentation diagram infographic slide
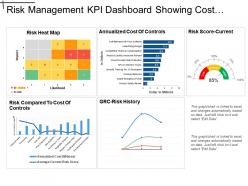
Presenting this set of slides with name - Risk Management Kpi Dashboard Showing Cost Of Control And Risk Score. This is a five stage process. The stages in this process are Risk Management, Risk Assessment, Project Risk.
-
 75339470 style essentials 2 financials 5 piece powerpoint presentation diagram infographic slide
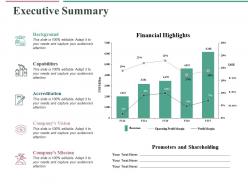
Presenting this set of slides with name - Executive Summary Ppt Professional Display. This is a five stage process. The stages in this process are Bar Chart, Marketing, Strategy, Planning, Finance.
-
 92569839 style concepts 1 growth 5 piece powerpoint presentation diagram infographic slide
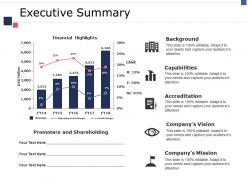
Presenting this set of slides with name - Executive Summary Ppt Pictures Icon. This is a five stage process. The stages in this process are Financial Highlights, Background, Capabilities, Accreditation, Usd Million.
-
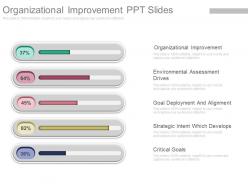 54935531 style essentials 2 financials 5 piece powerpoint presentation diagram infographic slide
High quality of images and icons. Strikingly beautiful Presentation slide. Easily amendable PowerPoint design as can be edited smoothly. Access to demonstrate the PPT template in widescreen view. Adaptable designs as compatible with Google slides. Downloading is easy and can be altered into JPEG and PDF. Suitable for business presenters, management and the entrepreneurs.The stages in this process are organizational improvement, environmental assessment drives and much more.
-
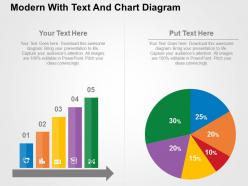 41280404 style concepts 1 growth 5 piece powerpoint presentation diagram infographic slide
PowerPoint slides effortlessly coordinate with Google slides. Vertical bars and pie chart can have customised colors according to liking. High resolution PPT graphics leave no scope for pixilation on bigger and wider screens. Useful for data analysts, students and consumer-based companies. Amendable PPT layouts gives pin point control to the user. Supporting variety of software's, presentation design can be transformed into JPG and PDF easily.
-
 37948702 style essentials 2 financials 5 piece powerpoint presentation diagram infographic slide
Presenting Progress Bar Template Powerpoint Slide.The designs are 100% editable in this PowerPoint template. The font size, font color, graphic colors, and slide background can be customized without any hassle. The users can add or remove the text according to their needs. This template includes a progress bar template which is designed by keeping compatibility with Google Slides in mind. It is available in both standard and widescreen size.
-
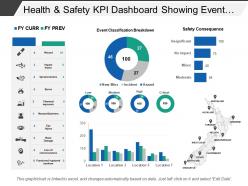 56250124 style essentials 2 financials 5 piece powerpoint presentation diagram infographic slide
Presenting the modern dashboard PPT template. This dashboard PPT design is 100% editable and is created by professionals. You can bring changes to the objects in the template like font size and font color very easily. This presentation slide is fully compatible with Google Slide and can be saved in JPG or PDF file format without any hassle. Fast download this at the click of the button.
-
 70094834 style essentials 2 financials 5 piece powerpoint presentation diagram infographic slide
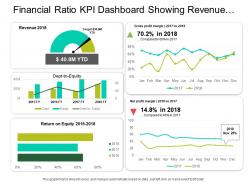
Presenting this set of slides with name - Financial Ratio Kpi Dashboard Showing Revenue Net Profit Margin And Debt To Equity. This is a five stage process. The stages in this process are Accounting Ratio, Financial Statement, Financial Ratio.
-
 54317861 style essentials 2 financials 5 piece powerpoint presentation diagram template slide
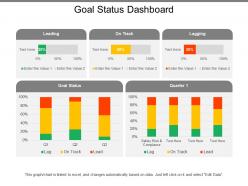
Presenting this set of slides with name - Goal Status Dashboard. This is a five stage process. The stages in this process are Goal Status, Objective Status, Aim Status.
-
 64093373 style essentials 2 financials 5 piece powerpoint presentation diagram infographic slide
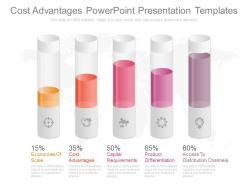
The PowerPoint images as used are all vector based. No hassle of blurred image when projected on wide screen. High resolution. Compatibility with multiple software options both online and offline. Compatibility with numerous format options like JPEG, PDF, PNG, etc. Compatible with Google slides. Ease of personalization and customization. Add or delete the content as per one’s own need and situation. Used by the managers, company head, account managers, students and teachers.The stages in this process are economies of scale, cost advantages, capital requirements, product differentiation, access to distribution channels.
-
 27163987 style essentials 2 financials 5 piece powerpoint presentation diagram infographic slide
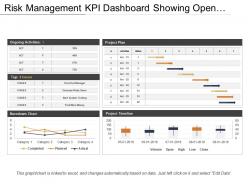
Presenting status KPI dashboard showing project plan and burndown chart PowerPoint slides. This layout is Compatible with Google slides. Easy to put in company logo, trademark or name; accommodate words to support the key points. Images do no blur out even when they are projected on large screen.PPT template can be utilized by sales and marketing teams and business managers. Instantly downloadable slide and supports formats like JPEG and PDF. Adjust colors, text and fonts as per your business requirements.
-
 37183820 style division donut 5 piece powerpoint presentation diagram infographic slide
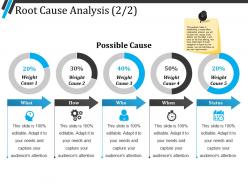
Presenting Root Cause Analysis PPT Summary which is designed professionally for your convenience. You can change the color, fonts, font size, and font types of the template as per the requirements. The slide is readily available in both 4:3 and 16:9 aspect ratio. It is adaptable with Google Slides which makes it accessible at once. Can be converted into formats like PDF, JPG, and PNG.
-
 49564262 style essentials 2 financials 5 piece powerpoint presentation diagram infographic slide
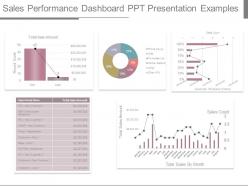
Presenting sales performance dashboard ppt presentation examples. This is a sales performance dashboard ppt presentation examples. This is a five stage process. The stages in this process are total sale amount, total sales amount, sales count, total sales by month, record count.
-
 35265073 style essentials 2 financials 5 piece powerpoint presentation diagram infographic slide
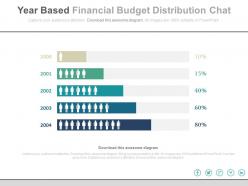
Completely modifiable slide for financial budget distribution chart. Editable images, colors and text. Presentable and easy to comprehend info graphic format. The presentation template can be downloaded and saved in any desired format. Privilege of insertion of logo and trademarks for more personalization. Adaptable to wide screen view without the problem of pixilation. Beneficial and productive insight for industry professionals, teachers, students, strategists and management planners. Can be used with google slides.
-
 84007390 style essentials 1 location 5 piece powerpoint presentation diagram infographic slide
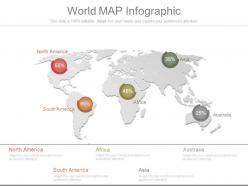
High resolution PPT example. Easy to edit and customize PPT graphics. Compatible with all software and can be saved in any format (JPEG/JPG/PDF). Useful tool for students, business analysts and professionals of any and every industry. Precise and easy to comprehend information on PPT sample. Freedom to personalize the content with company name and logo. Hassle free addition and deletion of content as per need. The stages in this process are north america, south america, africa, australia, asia.
-
 46870140 style essentials 2 dashboard 5 piece powerpoint presentation diagram infographic slide
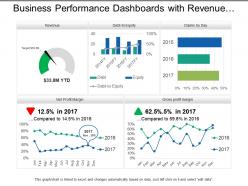
Presenting, our business performance dashboards with revenue and ratios PPT deck. Pre-designed chart sheet directed PowerPoint Presentation template. Administration of high-resolution images, graphs, and comparison diagrams. Filled with methods and effects to create an impact. Can be quickly converted into JPEG/JPG or PDF formats as per the requirements. Congenial with Google Slides for ease. Project to widescreen without cringing about pixelating, after downloading explore these characteristics.
-
 Credit Cards Overview Guide To Use And Manage Credit Cards Effectively Fin SS
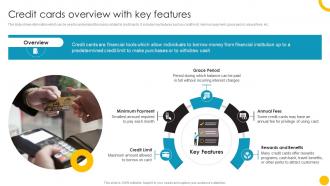
This slide shows information which can be used to understand the basics related to credit cards. It includes key features such as credit limit, minimum payment, grace period, annual fees, etc. Increase audience engagement and knowledge by dispensing information using Credit Cards Overview Guide To Use And Manage Credit Cards Effectively Fin SS. This template helps you present information on five stages. You can also present information on Overview, Grace Period, Rewards And Benefits using this PPT design. This layout is completely editable so personaize it now to meet your audiences expectations.
-
 71368595 style concepts 1 growth 5 piece powerpoint presentation diagram infographic slide
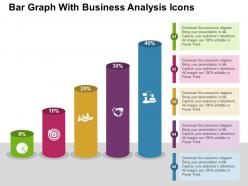
Proofing and editing can be done with ease in PPT design. Presentation slide is of utmost use to management professionals, big or small organizations and business startups. Smooth functioning is ensured by the presentation slide show on all software’s. When projected on the wide screen the PPT layout does not sacrifice on pixels or color resolution.
-
 27630691 style essentials 2 financials 5 piece powerpoint presentation diagram infographic slide
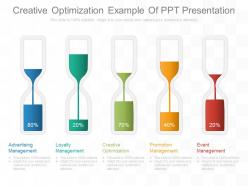
Compatibility with Google slides. Compatibility with various other formats and software options. High resolution visuals. Hassle free projection on wide screen, without getting any blurred image. Ease of modification. Execute the desired changes in the text, color, orientation and fonts. Assistance for executing changes in form of pictorial guidelines. Widely accessed by team of brand managers, advertisers, marketing teams and entrepreneurs to boost up their market presence and revenue.The stages in this process are advertising management, loyalty management, creative optimization, promotion management, event management.
-
 98452619 style essentials 2 financials 5 piece powerpoint presentation diagram infographic slide
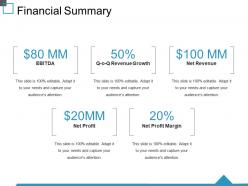
Presenting this set of slides with name - Financial Summary Ppt Deck. This is a five stage process. The stages in this process are Ebitda, Net Profit, Net Profit Margin, Net Revenue, Revenue Growth.
-
 6070909 style essentials 2 financials 5 piece powerpoint presentation diagram infographic slide
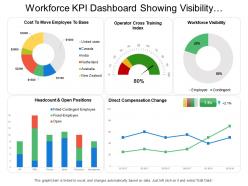
Presenting this set of slides with name - Workforce Kpi Dashboard Showing Visibility Headcount And Direct Compensation Change. This is a five stage process. The stages in this process are Staff, Personnel, Workforce.
-
 77431059 style essentials 2 financials 5 piece powerpoint presentation diagram infographic slide
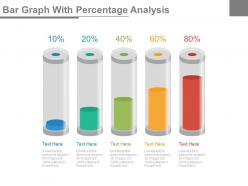
Presenting bar graph with percentage analysis powerpoint slides. This is a bar graph with percentage analysis powerpoint slides. This is a five stage process. The stages in this process are financials.
-
 24151957 style essentials 2 financials 5 piece powerpoint presentation diagram infographic slide
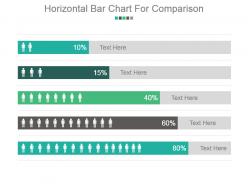
Presenting horizontal bar chart for comparison PPT slide. This presentation graph chart is fully editable in PowerPoint. You can customize the font type, font size, colors of the chart and background color as per your requirement. The slide is fully compatible with Google slides and can be saved in JPG or PDF format without any hassle. High quality graphics and icons ensure that there is no deteriorating in quality on enlarging their size. Have the tendency to boost the overall impression of your presentation.
-
 67177481 style concepts 1 growth 5 piece powerpoint presentation diagram infographic slide
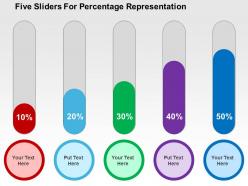
Business oriented PowerPoint presentation slides. Easy and convenient downloading by following simple steps. No concession with the quality once opened on wide screen. Editable visuals, colors and text. Modify and personalize the presentation by including the company name and logo. Guidance for executing the changes has been provided for assistance. Useful for sales leaders, marketers, business professionals, analysts, strategists, students, teachers, etc.


