75000700 style puzzles linear 3 piece powerpoint presentation diagram infographic slide
Our Data Integration Showing Data Extraction Transformation Cleansing And Loading find challenges exciting. They enjoy a good contest.
- Google Slides is a new FREE Presentation software from Google.
- All our content is 100% compatible with Google Slides.
- Just download our designs, and upload them to Google Slides and they will work automatically.
- Amaze your audience with SlideTeam and Google Slides.
-
Want Changes to This PPT Slide? Check out our Presentation Design Services
- WideScreen Aspect ratio is becoming a very popular format. When you download this product, the downloaded ZIP will contain this product in both standard and widescreen format.
-

- Some older products that we have may only be in standard format, but they can easily be converted to widescreen.
- To do this, please open the SlideTeam product in Powerpoint, and go to
- Design ( On the top bar) -> Page Setup -> and select "On-screen Show (16:9)” in the drop down for "Slides Sized for".
- The slide or theme will change to widescreen, and all graphics will adjust automatically. You can similarly convert our content to any other desired screen aspect ratio.
Compatible With Google Slides

Get This In WideScreen
You must be logged in to download this presentation.
PowerPoint presentation slides
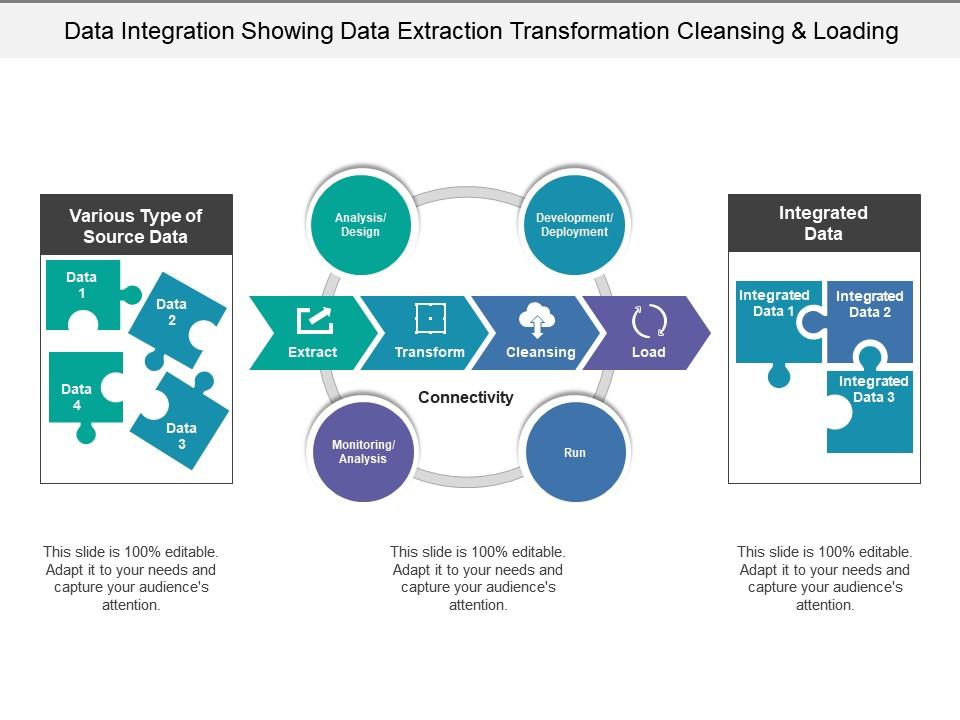
Presenting this set of slides with name - Data Integration Showing Data Extraction Transformation Cleansing And Loading. This is a three stage process. The stages in this process are Data Integration, Data Management, Data Analysis.
Content of this Powerpoint Presentation
Description:
The image is a PowerPoint slide titled "Data Integration Showing Data Extraction Transformation Cleansing & Loading." The slide visually represents the process of data integration, which is essential in transforming raw data into meaningful and valuable information. It is divided into stages that form part of the ETL (Extract, Transform, Load) process:
1. Various Types of Source Data:
This section probably includes different data sources, indicating the diverse nature of raw data that can be processed.
2. Extract:
The first step in the ETL process, where data is extracted from the original sources.
3. Transform:
The stage where extracted data is transformed into a format suitable for analysis and business intelligence.
4. Cleansing:
Data is cleaned to ensure accuracy and consistency.
5. Load:
The final stage where cleansed and transformed data is loaded into a target system for use.
The slide also includes elements for "Analysis/Design," "Connectivity," and "Monitoring/Analysis," suggesting ongoing processes of optimizing and ensuring the data integration process meets business requirements.
Use Cases:
Here are seven industries where this slide could be effectively used:
1. Healthcare:
Use: Integrating patient records from various departments.
Presenter: Data Manager.
Audience: Healthcare IT staff, administrators.
2. Retail:
Use: Consolidating customer data from multiple sales channels.
Presenter: Business Analyst.
Audience: Marketing team, sales managers.
3. Finance:
Use: Aggregating financial transactions from different systems.
Presenter: Financial Data Analyst.
Audience: Financial planners, risk management teams.
4. Manufacturing:
Use: Merging production data from various factory sensors and systems.
Presenter: Operations Analyst.
Audience: Production managers, quality assurance teams.
5. Telecommunications:
Use: Combining usage and network data for customer service improvement.
Presenter: Network Data Scientist.
Audience: Network operations center staff, customer service teams.
6. E-commerce:
Use: Unifying customer interaction data across web and mobile platforms.
Presenter: E-commerce Specialist.
Audience: E-commerce strategy team, UX designers.
7. Government:
Use: Integrating data across different public service departments.
Presenter: Public Sector Analyst.
Audience: Policy makers, IT governance committees.
75000700 style puzzles linear 3 piece powerpoint presentation diagram infographic slide with all 5 slides:
Fill our Data Integration Showing Data Extraction Transformation Cleansing And Loading as you feel fit. They are like a bearer cheque.
-
Unique design & color.
-
Awesomely designed templates, Easy to understand.


