56448446 style hierarchy flowchart 3 piece powerpoint presentation diagram infographic slide
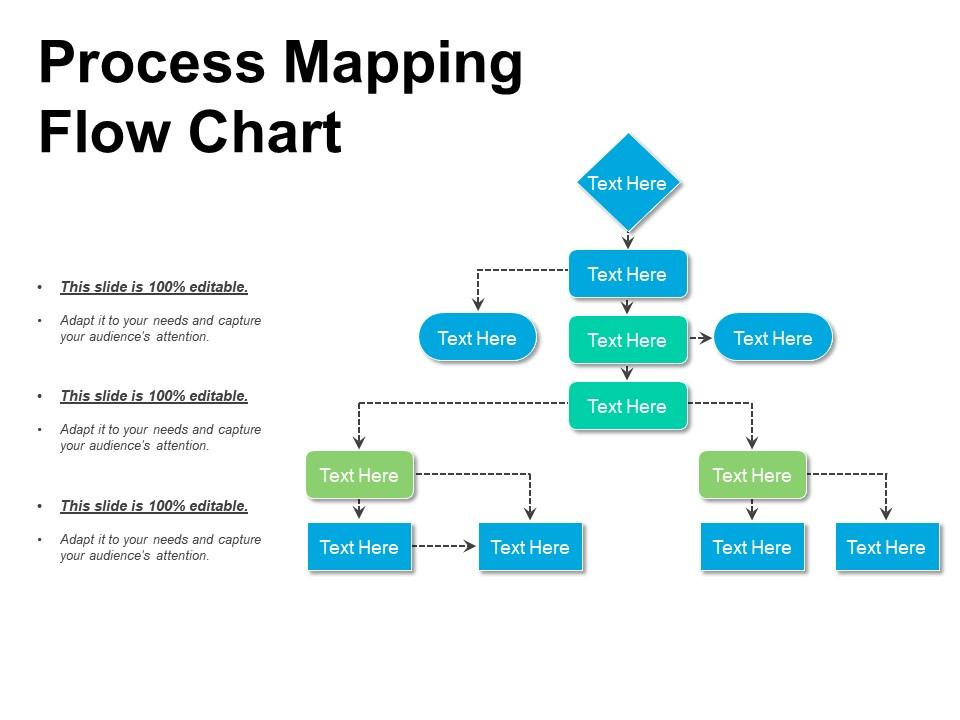
Project the steps of your process with this Process Mapping Flow Chart Presentation Design. Make it easy for your team members to assess the work process. With a workflow PPT diagram, segregate the tasks and display them effortlessly. Devise effective strategies for efficient process management. Help your employees to follow and execute the project with precision. Business process mapping will aid in the smooth functioning of the organization. Describe how the business functions on a regular basis with the help of business process mapping tools. This editable process flowchart PPT diagram is readily available and professionally designed by our designers at SlideTeam. Give a clear and brief PowerPoint presentation on your well-organized business process. With high-quality graphics and content used in this PPT slide, impress your audience. Invest less time to create a business presentation, which is both attractive and comprehensive.
- Google Slides is a new FREE Presentation software from Google.
- All our content is 100% compatible with Google Slides.
- Just download our designs, and upload them to Google Slides and they will work automatically.
- Amaze your audience with SlideTeam and Google Slides.
-
Want Changes to This PPT Slide? Check out our Presentation Design Services
- WideScreen Aspect ratio is becoming a very popular format. When you download this product, the downloaded ZIP will contain this product in both standard and widescreen format.
-

- Some older products that we have may only be in standard format, but they can easily be converted to widescreen.
- To do this, please open the SlideTeam product in Powerpoint, and go to
- Design ( On the top bar) -> Page Setup -> and select "On-screen Show (16:9)” in the drop down for "Slides Sized for".
- The slide or theme will change to widescreen, and all graphics will adjust automatically. You can similarly convert our content to any other desired screen aspect ratio.
Compatible With Google Slides

Get This In WideScreen
You must be logged in to download this presentation.
PowerPoint presentation slides
Presenting a PPT slide named Process Mapping Flow Chart Presentation Design. A readymade, completely editable slide is easy to use. Add the desired content anywhere in the slide. This PPT slide is available in both wide and standard screen sizes. Customize the font style, font color, and font size according to the requirement. The template is compatible with Google Slides. You can convert and save the slide to PDF and JPG formats.
Content of this Powerpoint Presentation
Description:
The image is a visual representation of a process mapping flow chart. This type of flow chart is a diagram that illustrates the steps of a process, showing how individual tasks or actions flow from one to another and their outcomes or decisions required at each step.
The chart is organized with a starting point, followed by sequences of actions denoted by various shapes like diamonds and rectangles, which are standard flowchart symbols. Diamonds typically represent decision points that can lead the process in different directions based on yes/no questions or other binary criteria. Rectangles are used to show process steps or actions.
The arrows indicate the direction of workflow, guiding the viewer through the process from start to finish. Dashed arrows may indicate that the process flow is conditional or less direct than the solid arrows.
This slide also includes text placeholders labeled "Text Here," which suggest that the slide is a template to be customized. It is noted as "100% editable," meaning the presenter can adapt it to fit the specifics of their process and tailor it to capture the audience's attention effectively.
Use Cases:
Process mapping flow charts are essential for simplifying complex operations, enhancing communication, and identifying improvement areas across diverse sectors.
1. Healthcare:
Use: Streamlining patient journey and treatment processes
Presenter: Quality Assurance Coordinator
Audience: Healthcare Providers, Administrative Staff
2. Automotive:
Use: Optimizing manufacturing and assembly line efficiency
Presenter: Production Engineer
Audience: Assembly Line Workers, Plant Supervisors
3. Information Technology:
Use: Managing software development and deployment cycles
Presenter: IT Project Manager
Audience: Development Team, Stakeholders
4. Finance:
Use: Enhancing banking transaction workflows and compliance checks
Presenter: Compliance Officer
Audience: Bank Employees, Auditors
5. Education:
Use: Organizing administrative and educational program development
Presenter: School Administrator
Audience: Teaching Staff, Educational Planners
6. Hospitality:
Use: Improving guest services and operational management
Presenter: Hotel Manager
Audience: Service Staff, Department Heads
7. Supply Chain and Logistics:
Use: Refining delivery routes and inventory management
Presenter: Logistics Analyst
Audience: Warehouse Managers, Distribution Personnel
56448446 style hierarchy flowchart 3 piece powerpoint presentation diagram infographic slide with all 5 slides:
Give a clear career breakdown with our Process Mapping Flow Chart Presentation Design. They will get an idea of what to expect.
-
Thanks for all your great templates they have saved me lots of time and accelerate my presentations. Great product, keep them up!
-
Attractive design and informative presentation.


