39089877 style hierarchy matrix 6 piece powerpoint presentation diagram infographic slide
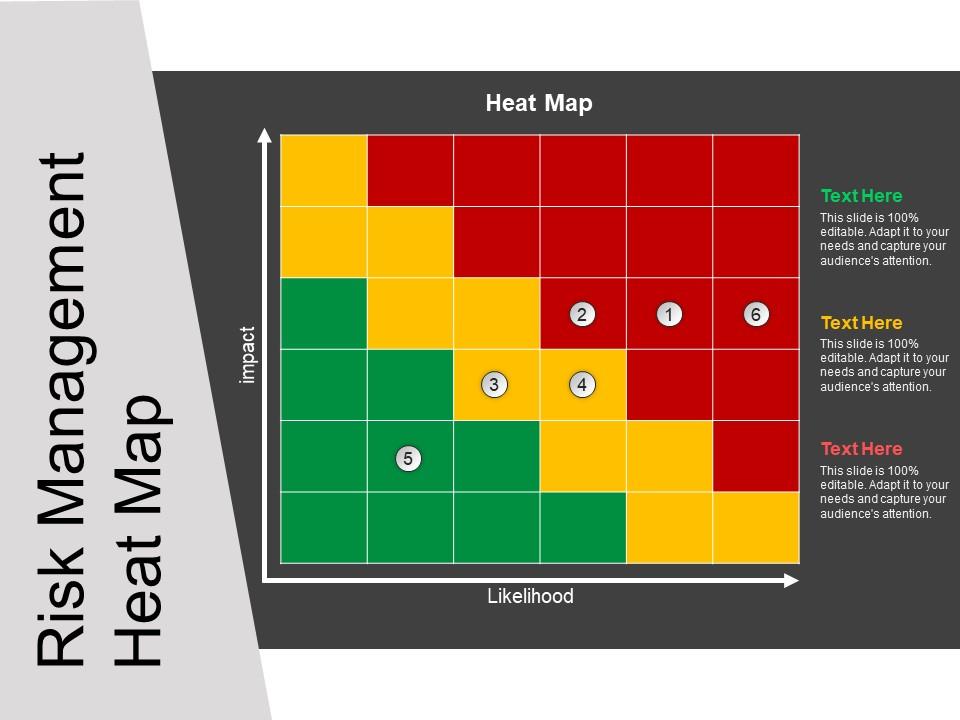
SlideTeam offers you it’s one of the most innovative risk management heat map PPT example. Whether you are planning to introduce a new product to your audience or graphically represent the risks associated with your existing project, you can be sure to find the right template for your business. This risk assessment heat map template has been drafted by professional PPT designers, provides you a perfect way to demonstrate possible combination of risk concepts. The design layout simply uses a multicolored diagram to highlight key risks to your project, where red color indicates highest likelihood, yellow for moderate and green for the lowest risk likelihood. This combination is just a perfect way to visualize risks using a risk map. Business professionals, fraud and risk managers, quality assurance engineers use this design template for risk assessment and management related presentations. If all the risks are demonstrated in a well organized manner, then it will be easy for you to manage risks for every program or project. So, download this risk assessment heat map template and use it for enterprise risk management and emerging risks. Chances always get better with our Risk Management Heat Map Ppt Example. Be confident of gaining the advantage.
- Google Slides is a new FREE Presentation software from Google.
- All our content is 100% compatible with Google Slides.
- Just download our designs, and upload them to Google Slides and they will work automatically.
- Amaze your audience with SlideTeam and Google Slides.
-
Want Changes to This PPT Slide? Check out our Presentation Design Services
- WideScreen Aspect ratio is becoming a very popular format. When you download this product, the downloaded ZIP will contain this product in both standard and widescreen format.
-

- Some older products that we have may only be in standard format, but they can easily be converted to widescreen.
- To do this, please open the SlideTeam product in Powerpoint, and go to
- Design ( On the top bar) -> Page Setup -> and select "On-screen Show (16:9)” in the drop down for "Slides Sized for".
- The slide or theme will change to widescreen, and all graphics will adjust automatically. You can similarly convert our content to any other desired screen aspect ratio.
Compatible With Google Slides

Get This In WideScreen
You must be logged in to download this presentation.
PowerPoint presentation slides
Presenting risk management heat map PPT example. PPT template can easily be updated by anyone. Just follow the simple instructions provided by our PPT designers. You can open and edit PPT design with Google Slides and Microsoft PowerPoint. All the design elements e.g. font type, color, size, shape, style, background, graphics are completely editable. PPT design can be downloaded into JPEG and PDF formats.
Content of this Powerpoint Presentation
Description:
This image presents a risk management heat map, which is a visual tool used to illustrate the level of risk associated with various events or conditions, combining the impact (vertical axis) and the likelihood (horizontal axis) of those risks. In this particular heat map, color coding is utilized to signify the severity of risk: red indicates high risk, yellow indicates moderate risk, and green indicates low risk. Each color band contains numbered placeholders (1 to 6), which are meant to mark specific risks after assessment.
The text elements on the right side of the heat map provide placeholders with the caption "Text Here" and a note stating "This slide is 100% editable. Adapt it to your needs and capture your audience's attention." These sections are intended for users to insert descriptions of the specific risks corresponding to each numbered position on the heat map, or possibly to outline risk management strategies or other relevant commentary.
Use Cases:
Given the flexibility and importance of visualizing risk in various organizational processes, heat maps such as this one can be applied in numerous industries:
1. Financial Services:
Use: Assessing and communicating financial risks.
Presenter: Risk Manager.
Audience: Executives and Stakeholders.
2. Healthcare:
Use: Visualization of patient safety and compliance risks.
Presenter: Quality Assurance Manager.
Audience: Hospital Management and Staff.
3. Manufacturing:
Use: Identifying production and supply chain vulnerabilities.
Presenter: Operations Manager.
Audience: Production Team.
4. Information Technology:
Use: Mapping cybersecurity threats and their potential impacts.
Presenter: Chief Information Security Officer.
Audience: IT Department.
5. Energy:
Use: Evaluating risks related to energy production and market fluctuations.
Presenter: Energy Analyst.
Audience: Investors and Policy Makers.
6. Construction:
Use: Analyzing safety and project completion risks.
Presenter: Project Manager.
Audience: Construction Workers and Contractors.
7. Transportation:
Use: Highlighting logistic and regulatory risks.
Presenter: Logistics Coordinator.
Audience: Supply Chain Partners and Regulatory Bodies.
39089877 style hierarchy matrix 6 piece powerpoint presentation diagram infographic slide with all 5 slides:
Add a bit of jazz with our Risk Management Heat Map Ppt Example. Increase the degree of elation felt.
-
Unique design & color.
-
The content is very helpful from business point of view.


