-
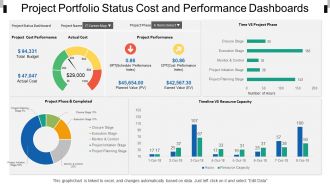 Project portfolio status cost and performance dashboards snapshot
Presenting, project portfolio status cost and performance dashboards snapshot. This is an appealing design for project portfolio status cost and performance focused PowerPoint presentation. This PPT template can be used by experts from various backgrounds to present their ideas in a contemporary way. This slide is cooperative with google slides and after downloading you can use it in full version and insert your company's logo for your best practice. Unique thinking to mesmerize your audience. Fully editable PowerPoint colors, orientation, text, and graphics.
-
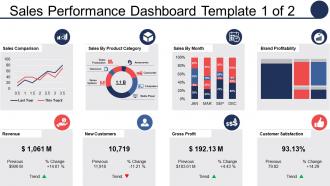 Sales performance dashboard sales comparison sales by product category
Introducing sales performance dashboard sales comparison sales by product category PPT design. Tailor the design with trade name, icon and even tagline. Fast download and easy to convert into JPG and PDF. Alternative to share presentation diagram in standard and widescreen display view. High quality PowerPoint slide comes with editable options as color, text and font can be edited at any stage. PowerPoint graphic is available with different nodes and stages.
-
 Four key metrics donut chart with percentage
This key performance indicator presentation slide can easily be downloaded from our web page. The design is 100% editable; you can modify and customize the design according to your business needs. All the design elements such as font, type, color, size, images, shape, style, background is completely editable. Design is fully supported on standard and full screen view; no compromise with design quality on full screen view.
-
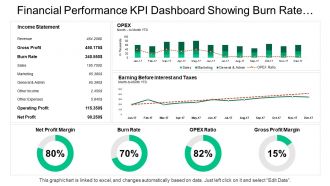 Financial performance kpi dashboard showing burn rate opex ratio gross profit
Presenting this set of slides with name - Financial Performance Kpi Dashboard Showing Burn Rate Opex Ratio Gross Profit. This is a four stage process. The stages in this process are Financial Performance, Financial Report, Financial Review.
-
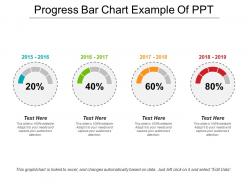 Progress bar chart example of ppt
SlideTeam presents to you Progress Bar Chart Example Of PPT. This PowerPoint presentation can be saved in either PDF or JPG format easily. You can also view the slideshow in standard size display ratio of 4:3 or widescreen display ratio of 16:9. You can make any changes to the pre-designed PPT template, as it is highly customizable. You can also edit the font size, font color and the font style of the text used in the presentation. The slides are also compatible with Google slides.
-
 Project name status schedule and management dashboard
Presenting project name status schedule and management dashboard PowerPoint template. Presentation slides are compatible with Google slides. Download is quick and can be easily shared. Conveys a sense of change over time. Suitable for corporate leaders and business associates. Flexible PPT slide as can be used whenever required. PowerPoint design can be shared in Standard and Widescreen view. High quality graphics and visuals used in the PPT. Option to include business content i.e. name, logo and text. Effortless conversion into PDF/ JPG format.
-
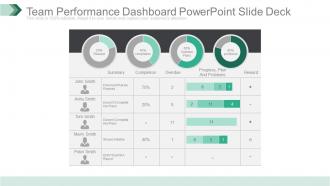 Team performance dashboard powerpoint slide deck
Presenting team performance dashboard powerpoint slide deck. This is a team performance dashboard powerpoint slide deck. This is a four stage process. The stages in this process are completion, overdue plans, problems, summary, completion, overdue, progress, plan and problems, reward.
-
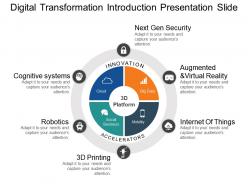 Digital transformation introduction presentation slide
Presenting digital transformation introduction presentation slide. This is a digital transformation introduction presentation slide. This is a four stage process. The stages in this process are digital transformation.
-
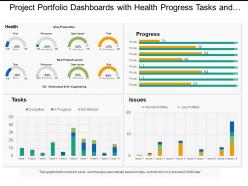 Project portfolio dashboards snapshot with health progress tasks and issues
Presenting, project portfolio dashboards snapshot with health progress tasks and issues. This PPT Template can be used by specialists for designing their project portfolio dashboards and health progress matters for data analysis. You can change the color of the components shown in the figure and also edit the text to write a short brief about your company's financial affairs. This PowerPoint template is also compatible with google slides and can be projected to a widescreen for business meetings without pixelating.
-
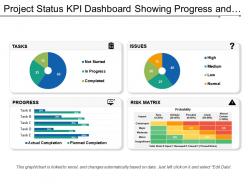 Project status kpi dashboard snapshot showing progress and risk matrix
Presenting project status KPI dashboard snapshot showing progress and risk matrix PowerPoint template. Simple data input like company logo, name or trademark. This PowerPoint theme is fully supported by Google slides. Picture quality of these slides does not change even when projected on large screen. This formats can be easily changed to JPEG and PDF applications. This template is suitable for marketing, sales persons, business managers and entrepreneurs. Adjust PPT layout, font, text and color as per your necessity
-
 Global data protection circle diagram flat powerpoint design
We are proud to present our global data protection circle diagram flat powerpoint design. Concept of global data protection has been displayed in this power point template diagram. To show this concept we have used graphic of circles. Use this PPT diagram for business and data related presentations.
-
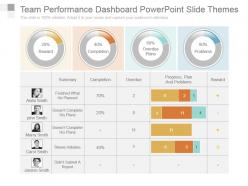 Team performance dashboard powerpoint slide themes
Presenting team performance dashboard powerpoint slide themes. This is a team performance dashboard powerpoint slide themes. This is a four stage process. The stages in this process are summary, completion, overdue, progress, plan and problems, reward, finished what he planned, doesnt complete his plans, doesnt complete his plans, shows initiative, didnt submit a report.
-
 Process improvement journey
Presenting Process Improvement Journey PPT theme which is completely editable. It is readily available in both 4:3 and 16:9 aspect ratio. This template is compatible with Google Slides which makes it easily accessible at once. You can open and save your presentation in various formats like PDF, JPG and PNG. Change the colors, fonts, font size, and font types as per your requirement.
-
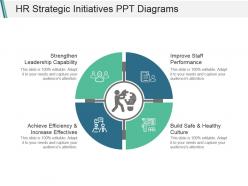 Hr strategic initiatives ppt diagrams
Introducing Hr Strategic Initiatives PowerPoint template diagram with four stages. Effortlessly changeable PowerPoint template as shading, content and textual style is alterable. This PowerPoint template is hundred percent compatible with Google Slides. You can easily download the template and save into JPEG and PDF format. The designer has used the best quality images, graphics, color, and icons. Easy to incorporate the company signature and logo. Picture quality does not get blur when displayed on widescreen.
-
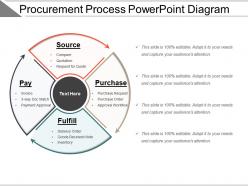 Procurement process powerpoint diagram
Presenting procurement process powerpoint diagram. This is a procurement process powerpoint diagram. This is a four stage process. The stages in this process are procurement, purchasing, ?bidding.
-
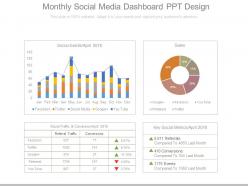 Monthly social media dashboard snapshot ppt design
Presenting monthly social media dashboard snapshot ppt design. This is a monthly social media dashboard ppt design. This is a four stage process. The stages in this process are social events, sales, social traffic and conversion, key social metrics, referrals, conversions, events.
-
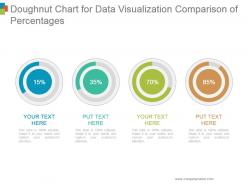 Doughnut chart for data visualization comparison of percentages powerpoint slides design
Presenting doughnut chart for data visualization comparison of percentages powerpoint slides design. This is a doughnut chart for data visualization comparison of percentages powerpoint slides design. This is a four stage process. The stages in this process are business, marketing, financial, percentage, increase.
-
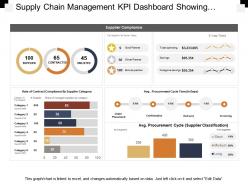 Supply chain management kpi dashboard showing supplier compliance stats
Presenting this set of slides with name - Supply Chain Management Kpi Dashboard Showing Supplier Compliance Stats. This is a four stage process. The stages in this process are Demand Forecasting, Predicting Future Demand, Supply Chain Management.
-
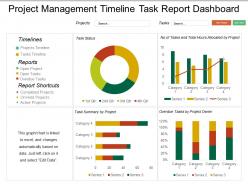 Project management timeline task report dashboard snapshot
Introducing project management timeline task report dashboard snapshot PPT template. An easy access to make the desired changes or edit it anyways. Wide screen view of the slides. Easy conversion into Jpeg or Pdf format. The PPT images offer compatibility with Google Slides. High resolution icons for clear message delivery. Unique and informational content. Valuable for business professionals, sales representatives, marketing professionals, students and selling investigators. High quality charts and visuals used in the designing process. They enhance the performance of the presentation.
-
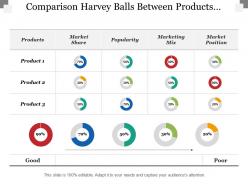 Comparison harvey balls between products market share popularity
Presenting this set of slides with name - Comparison Harvey Balls Between Products Market Share Popularity. This is a four stage process. The stages in this process are Differentiation, Comparison, Compare.
-
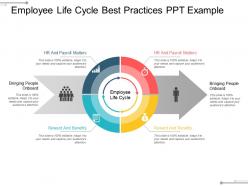 Employee life cycle best practices ppt example
Presenting employee life cycle best practices ppt example. This is a employee life cycle best practices ppt example. This is a four stage process. The stages in this process are employee relationship management, employee life cycle, employee relations.
-
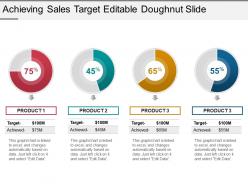 Achieving sales target editable doughnut slide powerpoint slides
The biggest advantage of downloading this sales target achievement doughnut PPT diagram is the use of excel linked chart. Include your business related statistics over linked excel sheet and get it directly updated in the PPT design. Design allows full editing. PPT can be quickly downloaded into JPEG and PDF formats. You can open the design with Google Slides and Microsoft PowerPoint software.
-
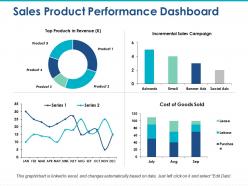 Sales product performance dashboard incremental sales campaign
Providing sales product performance dashboard incremental sales campaign presentation template with editing preference as images, icons, colors, text and layout can be edit as required. PowerPoint design can be downloaded and save into JPG and PDF format. High resolution ensures no pixel break. PPT diagram downloadable in standard and widescreen view. Fully adjustable slide as works well with Google slides. Easy to adjust and present when required. Quick to share message effectively.
-
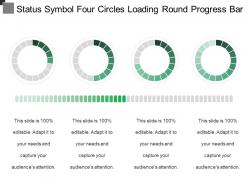 Status symbol four circles loading round progress bar 1
Presenting status symbol four circles loading round progress bar 1. This is a status symbol four circles loading round progress bar 1. This is a four stage process. The stages in this process are status symbol, status icon.
-
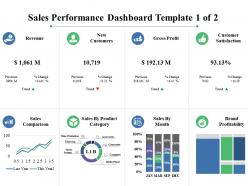 Sales performance dashboard revenue new customers
Providing sales performance dashboard revenue new customers PowerPoint template. PPT graphic can be shared in standard and widescreen view. High resolution picture quality ensures no pixel break up even when shared with large set of audience. Presentation slide is adaptable with Google slides. Magnificent to share business communication effectively. PPT slide is available with different nodes and stages. PowerPoint design can be edited as needed and change into JPG and PDF format.
-
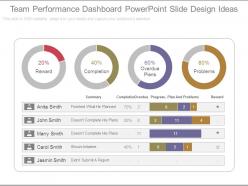 Team performance dashboard powerpoint slide design ideas
Presenting team performance dashboard powerpoint slide design ideas. This is a team performance dashboard powerpoint slide design ideas. This is a four stage process. The stages in this process are reward, completion, overdue plans, problems, summary, completion, overdue, progress, plan and problems, reward.
-
 Business management dashboard diagram power point graphics
Presenting business management dashboard diagram power point graphics. This is a business management dashboard diagram power point graphics. This is a four stage process. The stages in this process are property system, crm system, asset system, finance system.
-
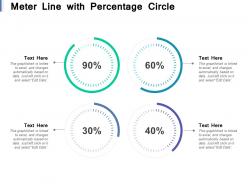 Meter line with percentage circle
Presenting this set of slides with name - Meter Line With Percentage Circle. This is a four stage process. The stages in this process are Percentage Circle, Percentage Round, Pie Chart.
-
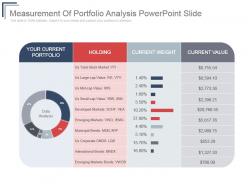 Measurement of portfolio analysis powerpoint slide
Presenting measurement of portfolio analysis PowerPoint slide. This layout is Compatible with Google slides. Easy to put in company logo, trademark or name; accommodate words to support the key points. Images do no blur out even when they are projected on large screen.PPT template can be utilized by sales and marketing teams and business managers. Instantly downloadable slide and supports formats like JPEG and PDF. Adjust colors, text and fonts as per your business requirements.
-
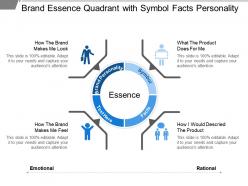 Brand essence quadrant with symbol facts personality
Presenting this set of slides with name - Brand Essence Quadrant With Symbol Facts Personality. This is a four stage process. The stages in this process are Brand Essence, Brand Equity, Competitive Analysis.
-
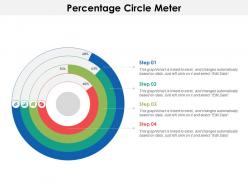 Percentage circle meter
Presenting this set of slides with name - Percentage Circle Meter. This is a four stage process. The stages in this process are Percentage Circle, Percentage Round, Pie Chart.
-
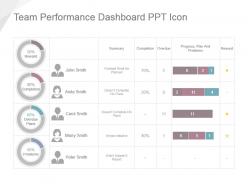 Team performance dashboard snapshot ppt icon
Presenting team performance dashboard ppt icon. This is a team performance dashboard snapshot ppt icon. This is a four stage. The Stages in this process are john smith, anita smith, carol smith, marry smith, peter smith, reward, completion, overdue plans, problems, summary, finished what he planned, doesn?t complete his plans, doesnt complete his plans, shows initiative, didnt submit a report, completion, overdue, progress, plan and problems, reward.
-
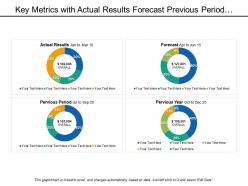 Key metrics with actual results forecast previous period and year
Presenting this set of slides with name - Key Metrics With Actual Results Forecast Previous Period And Year. This is a four stage process. The stages in this process are Key Metrics, Key Performance Indicator, Kpi.
-
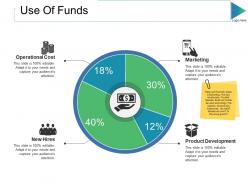 Use of funds ppt slides clipart
Presenting this set of slides with name - Use Of Funds Ppt Slides Clipart. This is a four stage process. The stages in this process are Operational Cost, New Hires, Product Development, Marketing, Business.
-
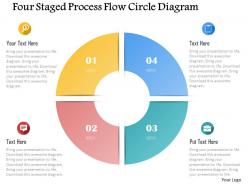 0115 four staged process flow circle diagram powerpoint template
We are proud to present our 0115 four staged process flow circle diagram powerpoint template. Four staged process flows has been used to design this power point template. This PPT diagram contains the concept of data flow. Use this PPT for business and marketing data related topics in any presentation.
-
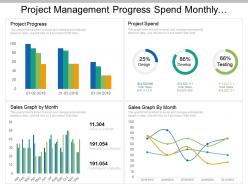 Project management progress spend monthly growth dashboard
Presentation design is easy download and can be changed into other software programs such as JPEG and PDF. Personalize the PowerPoint template with brand name, logo and image. Presentation slide is available with choice to download with different nodes and stages. Completely editable PPT slide can be edited as colors, icons, and text. Easy to present amongst large set of audience as accessible in widescreen view option. PowerPoint graphic can be merged with Google slides as fully compatible with them.
-
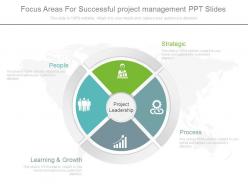 Apt focus areas for successful project management ppt slides
Presenting apt focus areas for successful project management ppt slides. This is a focus areas for successful project management ppt slides. This is four stage process. The stages in this proces are strategic, process, learning and growth, people.
-
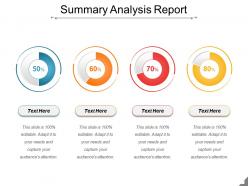 Summary analysis report presentation powerpoint example
Presenting Summary Analysis Report Presentation PowerPoint Example. It is fully editable in PowerPoint and the slide can be modified as per your requirements. Edit the fonts, colors and slide background. When you download the presentation, you get the PPT files in both widescreen (16:9) and standard screen (4:3) aspect ratio. Our presentation is compatible with Google Slides and can be saved in JPG or PDF format. Get this template with high resolution graphics and deliver presentations in no time.
-
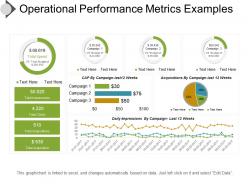 Operational performance metrics examples presentation ideas
Presenting operational performance metrics PPT image layout. This is competently constructed and readily useable PowerPoint template. Amend able subject matter, PowerPoint image, types, fonts etc. Prompt content with flexible option to insert company logo, trademark, or name. High resolution PPT template. Well served with all Google Slides. Projected on wide screen with high quality PPT graphic. Beneficial for the business managers and other professionals.
-
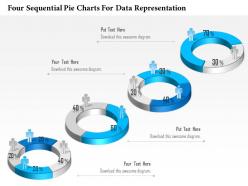 1114 four sequential pie charts for data representation presentation template
Easy proofing and editing is added on feature of presentation visual. Presentation slide is useful in business marketing, management and recourse disbursement. Basic theme yet it can modified with respect to font, color and layout. Attractive color scheme gives a professional look to PPT layout. Conversion into PDF or JPG formats is very easy and handy. PPT graphic offers font size which can be read from a distance.
-
 3d circular process templates 1
This template is skillfully designed and is completely editable to suit all the needs and requirements of the user. The color of the font, its size, style, and all other elements can be customized according to the user's desire The text in the PPT placeholder can be replaced with the desired information making this template highly flexible and adaptable as well. This template is also compatible with various Microsoft versions and formats like Google Slides, JPG, PDF, etc so the user will face no issue in saving it in the format of his choice.
-
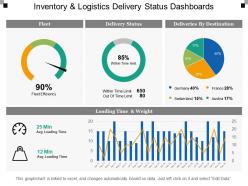 Inventory and logistics delivery status dashboards
Presenting this set of slides with name - Inventory And Logistics Delivery Status Dashboards. This is a four stage process. The stages in this process are Inventory And Logistics, Inventory Management, Warehousing And Inventory Management.
-
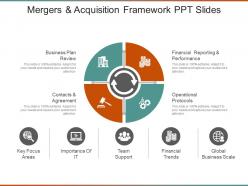 Mergers and acquisition framework ppt slides
Presenting mergers and acquisition framework ppt slides. This is a mergers and acquisition framework ppt slides. This is a four stage process. The stages in this process are business plan review, financial reporting and performance, contacts and agreement, operational protocols.
-
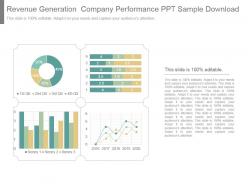 Revenue generation company performance ppt sample download
Presenting revenue generation company performance ppt sample download. This is a revenue generation company performance ppt sample download. This is a four stage process. The stages in this process are business, management, analysis, strategy, success.
-
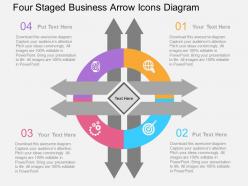 Four staged business arrow icons diagram flat powerpoint design
Proofing and editing can be done with ease in PPT design. Presentation slide is of utmost use to management professionals, big or small organizations and business startups. Smooth functioning is ensured by the presentation slide show on all software’s. When projected on the wide screen the PPT layout does not sacrifice on pixels or color resolution.
-
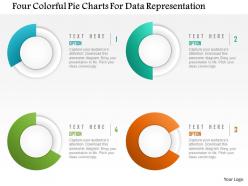 0115 four colorful pie charts for data representation powerpoint template
The template is stuffed with innumerable features of easy customization, high-resolution image quality, easy download facility in various file formats etc. Play the template in Google Slides for a convenient showcase. Experience the absolute ease in alteration with its user-friendly interface. No space constraints involved in writing the content section.
-
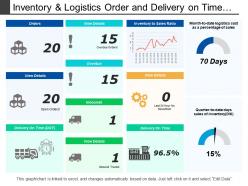 Inventory and logistics order and delivery on time dashboards
Presenting this set of slides with name - Inventory And Logistics Order And Delivery On Time Dashboards. This is a four stage process. The stages in this process are Inventory And Logistics, Inventory Management, Warehousing And Inventory Management.
-
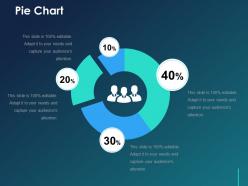 Pie chart ppt slide
Presenting our Pie Chart PPT Slide. The template is fully editable in PowerPoint and compatible with Google Slides as well. You can adapt the slideshow according to your unique business requirements. Add your text, image, or icon with ease. The template can be converted into different formats such as JPG, PDF, etc. without any hassle. High-quality graphics ensure an attention-grabbing presentation. Additionally, it is available in both 4:3 and 16:9 aspect ratios.
-
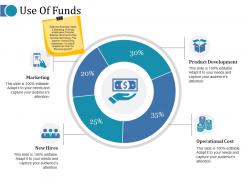 Use of funds ppt layouts slide download
Presenting this set of slides with name - Use Of Funds Ppt Layouts Slide Download. This is a four stage process. The stages in this process are Marketing, New Hires, Operational Cost, Product Development.
-
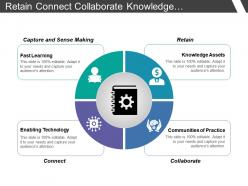 Retain connect collaborate knowledge management quadrant with icons
Presenting this set of slides with name - Retain Connect Collaborate Knowledge Management Quadrant With Icons. This is a four stage process. The stages in this process are Knowledge Management, Learning Organization, Training Organization.
-
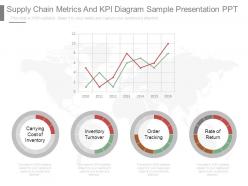 Supply chain metrics and kpi diagram sample presentation ppt
Presenting supply chain metrics and kpi diagram sample presentation ppt. This is a supply chain metrics and kpi diagram sample presentation ppt. This is a four stage process. The stages in this process are carrying cost of inventory, inventory turnover, order tracking, rate of return.
-
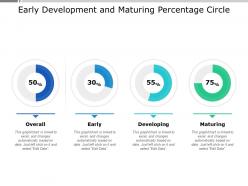 Early development and maturing percentage circle
Presenting this set of slides with name - Early Development And Maturing Percentage Circle. This is a four stage process. The stages in this process are Percentage Circle, Percentage Round, Pie Chart.
-
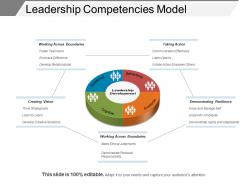 Leadership competencies model
Presenting Leadership Competencies Model PowerPoint slide. This PPT presentation is Google Slides compatible hence it is easily accessible. You can download and save this PowerPoint layout in different formats like PDF, PNG, and JPG. This PPT theme is available in both 4:3 and 16:9 aspect ratios. As this PowerPoint template is 100% editable, you can modify color, font size, font type, and shapes as per your requirements.
-
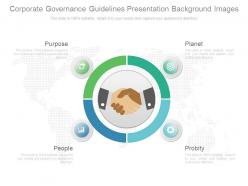 Corporate governance guidelines presentation background images
Presenting corporate governance guidelines presentation background images. This is a corporate governance guidelines presentation background images. This is a four stage process. The stages in this process are purpose, people, probity, planet.
-
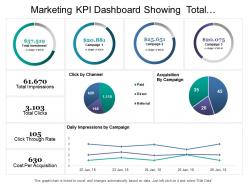 Marketing kpi dashboard showing total investment impressions click cost per acquisition
Presenting marketing KPI dashboard showing total investment impressions click cost per acquisition PPT slide. This layout is fully compatible with Google slides and data driven. User can edit the data in linked excel sheet and graphs and charts gets customized accordingly. Easy to put in company logo, trademark or name; accommodate words to support the key points. Images do no distort out even when they are projected on large screen. Adjust colors, text and fonts as per your business requirements
-
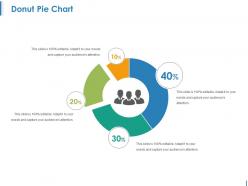 Donut pie chart ppt examples
Presenting this set of slides with name - Donut Pie Chart Ppt Examples. This is a four stage process. The stages in this process are Donut Pie Chart, Finance, Marketing, Strategy, Analysis.
-
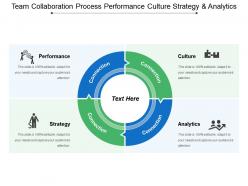 Team collaboration process performance culture strategy and analytics
Presenting this set of slides with name - Team Collaboration Process Performance Culture Strategy And Analytics. This is a four stage process. The stages in this process are Change Plans, Change Strategies, Change Of Plan.
-
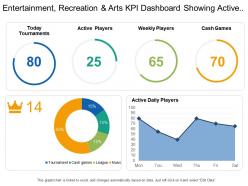 Entertainment recreation and arts kpi dashboard showing active daily players and today tournaments
Presenting this set of slides with name - Entertainment Recreation And Arts Kpi Dashboard Showing Active Daily Players And Today Tournaments. This is a four stage process. The stages in this process are Entertainment, Recreation And Arts, Attractions, Culture, Entertainment.
-
 Comparison powerpoint slide rules
Presenting comparison PowerPoint slide rules. The comparison chart template designed by professional team of SlideTeam to compare different things. The comparison analysis PowerPoint temple is completely editable in PowerPoint. The comparison chart in excel PPT slide is compatible with Google Slide and the comparison slide gets linked with Excel data sheet. You can make changes in the font size, font type, color as well as dimensions of the circular icons in the comparison chart circles diagram slide as per the requirement.
-
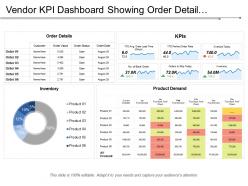 Vendor kpi dashboard showing order detail inventory and orders to ship today
Presenting this set of slides with name - Vendor Kpi Dashboard Showing Order Detail Inventory And Orders To Ship Today. This is a four stage process. The stages in this process are Vendor, Supplier, Retailer.
Toggle Nav

Skip to Content

Search
5
Notifications 5
-
 SlideTeam added 352 new products (e.g. Completely Researched Decks, Documents, Slide Bundles, etc), which included 6336 slides in total in the past 24 hours.
16 minutes ago
-
 SlideTeam has published a new blog titled "Top 7 Center of Excellence PPT Templates with Samples and Examples".
14 hours ago
-
 SlideTeam has published a new blog titled "Top 7 Methodology Chart Templates with Examples and Samples".
14 hours ago
-
 SlideTeam has published a new blog titled "Top 10 Statistical Analysis Templates with Samples and Examples".
14 hours ago
-
 SlideTeam has published a new blog titled "Os 5 principais modelos de orçamento logístico com exemplos e amostras".
14 hours ago


