-
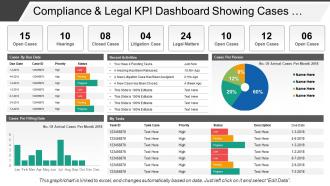 Compliance And Legal Kpi Dashboard Showing Cases By Due Date
Presenting this set of slides with name - Compliance And Legal Kpi Dashboard Showing Cases By Due Date. This is a four stage process. The stages in this process are Compliance And Legal, Legal Governance, Risk Management.
-
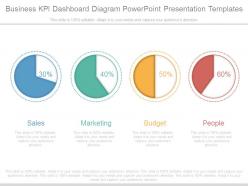 Business kpi dashboard diagram powerpoint presentation templates
PPT icon is easy for proofing and editing. Presentation layout is a good blend of text and flash animation. Presentation slide supports new shape styles to keep away cliché appearance and helps capture the attention. PPT slide is compatible with Google slide. Beneficial for marketing, sales, business and financial sector growth. Offers high color resolution. The stages in this process are sales, marketing, budget, people.
-
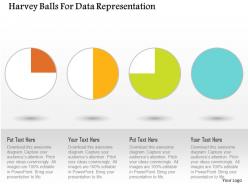 Harvey balls for data representation flat powerpoint design
Basic theme yet it can modified with respect to font, color and layout. Attractive and professional color scheme. PPT graphic offers font size which can be read from a distance. High resolution is offered by the presentation visual. Easy to download and instant use of pre designed PPT layout adds to its advantage.
-
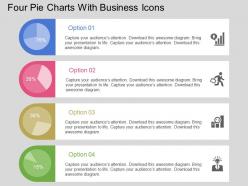 Four Pie Charts With Business Icons Flat Powerpoint Design
Presenting four pie charts with business icons flat PowerPoint template. Slides can be viewed in wide screens for more clear vision. PowerPoint slides are well-matched with Google slides. Fully editable PPT template as can be edited as required. Download is quick and saving is possible. Easy to convert into Jpeg and Pdf document. Perfect for business professionals and managers. They propose the information precisely without any confusions. They can be converted to different formats. They are result and technology oriented.
-
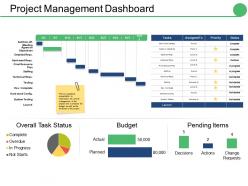 Project management dashboard snapshot ppt show graphics
Presenting this set of slides with name - Project Management Dashboard Snapshot Ppt Show Graphics. This is a four stage process. The stages in this process are Actual, Planned, Budget, Pending Items, Overdue.
-
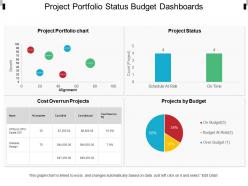 Project portfolio status budget dashboards
Presenting, project portfolio status budget dashboards. This PPT slide believes in delivering a pleasant and great experience to the customers and can be picked by professionals for a great experience. The color of the pie chart sections and text areas can easily be edited according to your need. This PPT slide is also agreeable with google slides and accessible in Fullscreen version. Offhand conversion into PDF/ JPG format. Simple insertion of company trade name/logo.
-
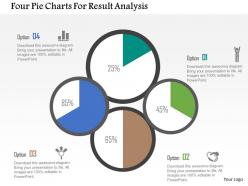 Four Pie Charts For Result Analysis Flat Powerpoint Design
High quality visuals with splendid resolution. 100 percent editable PPT slide templates. Aesthetically designed and professionally proficient. Include or exclude the slide content at your ease and requirement. Compatible with several software options. Harmonious with numerous format options life JPEG, JPG or PDF. Ease of personalization with your company specific name, logo and or trademark.
-
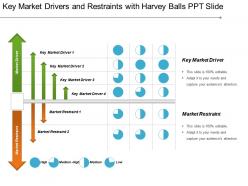 Key market drivers and restraints with harvey balls ppt slide
Presenting key market drivers and restraints with harvey balls PPT slide which is completely editable. This presentation is data driven, it can be customized and personalized. It is compatible with Google Slides and numerous format options. The graphics and icons used in this PPT slides are of high quality, definition and the visuals do not pixelate when projected on a wide screen and the editing instructions are also provided for your kind assistance.
-
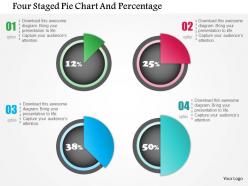 0115 four staged pie chart and percentage powerpoint template
We are proud to present our 0115 four staged pie chart and percentage powerpoint template. Four staged pie chart and percentage values has been used to design this power point template. This PPT contains the concept of financial result analysis. Use this PPT for business and marketing related presentations.
-
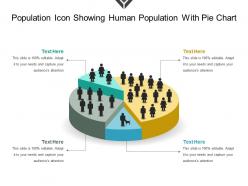 Population icon showing human population with pie chart
Presenting population icon showing human population with pie chart. This is a population icon showing human population with pie chart. This is a four stage process. The stages in this process are population icon, demographics icon, people growth icon.
-
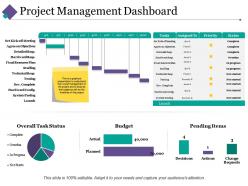 Project management dashboard snapshot ppt pictures infographic template
Displaying project management dashboard snapshot PPT picture infographic template. Alter the design with trade components like name and picture. Presentation slide is well-harmonized with Google slides. Colors and text can be replaced as the PowerPoint graphic comes with easy editing options. Rapid and easy download with saving options. PPT diagram can be viewed in both standard and widescreen display view. Flexible with other software options such as PDF or JPG formats.
-
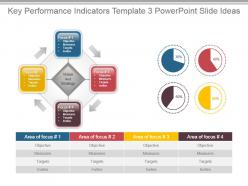 Key performance indicators template 3 powerpoint slide ideas
Presenting key performance indicators template 3 powerpoint slide ideas. Presenting key performance indicators template 3 powerpoint slide ideas. Presenting key performance indicators template 3 powerpoint slide ideas. This is a key performance indicators template 3 powerpoint slide ideas. This is four stage process. The stages in this process are objective, measures, targets, invites, area of focus, vision and strategy.
-
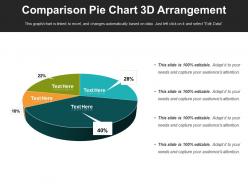 Comparison pie chart 3d arrangement
Presenting Comparison Pie Chart 3D Arrangement slide which is fully editable. You can alter the colors, fonts, font size, and font types of the slide as per the requirements. It can be converted into formats like PDF, JPG, and PNG. The template is available in both 4:3 and 16:9 aspect ratio. It is adaptable with Google Slides, which makes it accessible at once.
-
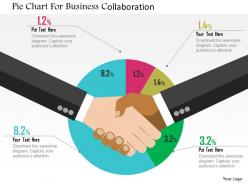 Pie chart for business collaboration flat powerpoint design
We are proud to present our pie chart for business collaboration flat powerpoint design. Graphic of pie chart has been used to craft this power point template diagram. This PPT diagram contains the concept of business collaboration. Use this PPT diagram for business presentations.
-
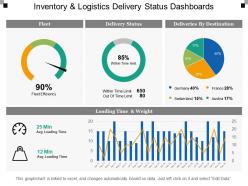 Inventory and logistics delivery status dashboards
Presenting this set of slides with name - Inventory And Logistics Delivery Status Dashboards. This is a four stage process. The stages in this process are Inventory And Logistics, Inventory Management, Warehousing And Inventory Management.
-
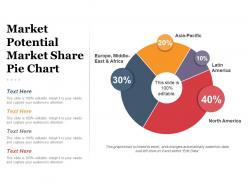 Market potential market share pie chart presentation deck
Presenting market potential market share pie chart presentation deck. This is a market potential market share pie chart presentation deck. This is a four stage process. The stages in this process are business, marketing, finance, strategy, success, pie chart.
-
 Pie chart powerpoint slide ideas
Presenting pie chart powerpoint slide ideas. This is a pie chart powerpoint slide ideas. This is a four stage process. The stages in this process are pie chart, finance, marketing, strategy, finance, business.
-
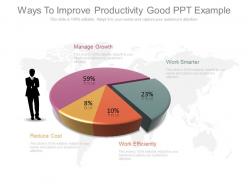 Ppt ways to improve productivity good ppt example
Can be viewed in 4: 3 standard screen size or 16:9 wide screen size. PPT design has many supporting actions like write, erase, correct, clean and select. Internet based click facilities like online image search and others can be added with ease which. Enables to give a professional look to the PPT slide. Enables real time edition or collaboration with auto saving options.The stages in this process are manage growth, work smarter, reduce cost, work smarter.
-
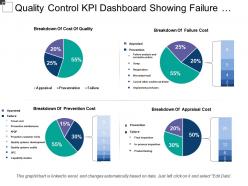 Quality control kpi dashboard showing failure and prevention cost
Presenting this set of slides with name - Quality Control Kpi Dashboard Showing Failure And Prevention Cost. This is a four stage process. The stages in this process are Quality Management, Quality Control, Quality Assurance.
-
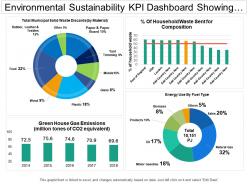 Environmental sustainability kpi dashboard showing municipal solid waste discard
Presenting this set of slides with name - Environmental Sustainability Kpi Dashboard Showing Municipal Solid Waste Discard. This is a four stage process. The stages in this process are Environment Sustainability, Environment Continual, Environment Feasibility.
-
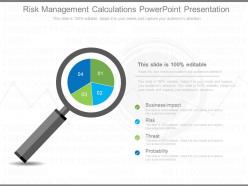 Risk Management Calculations Powerpoint Presentation
Promptly conformable PPT designs which saves time, An accumulated visuals Presentation graphics for providing 100% veracity also , Reinstate able PPT images ,Restyle able subject matter, designs, context etc., Versant with Google slides and other applications, Swift download available, Perfectly standardized PowerPoint templates quite handy for the trade specialists from diverse areas.The stages in this process are business impact, risk, threat, probability.
-
 Pie chart powerpoint slides
Presenting Pie Chart PowerPoint Slides. This PPT theme is available in both 4:3 and 16:9 aspect ratios. This PowerPoint template is customizable so you can modify the font size, font type, color and shapes as per your requirements. This PPT presentation is Google Slides compatible hence it is easily accessible. You can download and save this PowerPoint layout in different formats like PDF, PNG, and JPG.
-
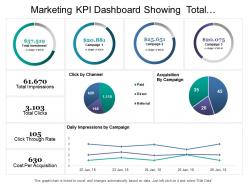 Marketing kpi dashboard showing total investment impressions click cost per acquisition
Presenting marketing KPI dashboard showing total investment impressions click cost per acquisition PPT slide. This layout is fully compatible with Google slides and data driven. User can edit the data in linked excel sheet and graphs and charts gets customized accordingly. Easy to put in company logo, trademark or name; accommodate words to support the key points. Images do no distort out even when they are projected on large screen. Adjust colors, text and fonts as per your business requirements
-
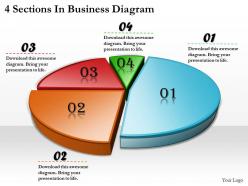 1113 business ppt diagram 4 sections in business diagram powerpoint template
We are proud to present our 1113 business ppt diagram 4 sections in business diagram powerpoint template. Our Finance Powerpoint Templates offer you the needful to organize your thoughts. Use them to list out your views in a logical sequence. Our Marketing Powerpoint Templates are created by a hardworking bunch of busy bees. Always flitting around with solutions guaranteed to please.
-
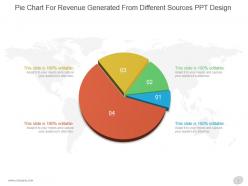 Pie chart for revenue generated from different sources ppt design
Presenting pie chart for revenue generated from different sources ppt design. This is a pie chart for revenue generated from different sources ppt design. This is a four stage process. The stages in this process are business, marketing, pie, circle, piece.
-
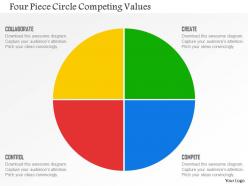 Four piece circle competing values flat powerpoint design
We are proud to present our four piece circle competing values flat powerpoint design. Four piece circle diagram has been used to craft this power point template diagram. This PPT diagram contains the concept of competing values. Use this PPT diagram for finance and business related presentation.
-
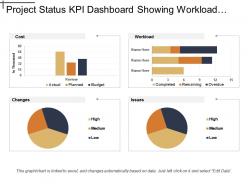 Project status kpi dashboard showing workload cost and issues
Presenting this set of slides with name - Project Status Kpi Dashboard Showing Workload Cost And Issues. This is a four stage process. The stages in this process are Project Health Card, Project Performance, Project Status.
-
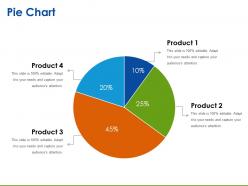 Pie chart ppt sample download
Presenting pie chart ppt sample download. This is a pie chart ppt sample download. This is a four stage process. The stages in this process are pie chart, finance, analysis, marketing, strategy, business.
-
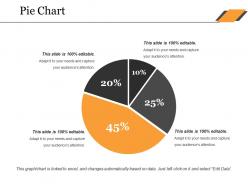 Pie chart ppt microsoft
Presenting Pie Chart PPT Microsoft that has been designed according to your needs and convenience. This template can be saved into various formats like PDF, JPG, and PNG. These PPT slides are completely customizable and editable. You can change the colors, fonts, font size, and font types of the presentation as per your needs. It is also compatible with Google Slides making it an even more suitable option for you. This template also supports the standard (4:3) and widescreen (16:9) sizes.
-
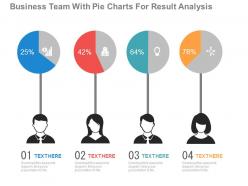 New business team with pie charts for result analysis flat powerpoint design
Presenting new business team with pie charts for result analysis flat powerpoint design. This Power Point template diagram has been crafted with graphic of business team and pie charts diagram. This PPT diagram contains the concept of business result analysis. Use this PPT diagram for business and sales related presentations.
-
 Key statistics powerpoint slide templates
Presenting this set of slides with name - Key Statistics Powerpoint Slide Templates. This is a four stage process. The stages in this process are Pie Chart, Marketing, Analysis, Strategy, Business.
-
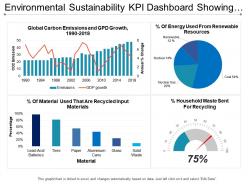 Environmental sustainability kpi dashboard showing global carbon emission and gdp growth
Presenting this set of slides with name - Environmental Sustainability Kpi Dashboard Showing Global Carbon Emission And Gdp Growth. This is a four stage process. The stages in this process are Environment Sustainability, Environment Continual, Environment Feasibility.
-
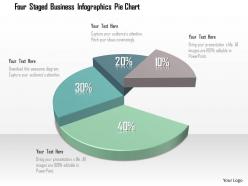 0115 four staged business infographics pie chart powerpoint template
We are proud to present our 0115 four staged business infographics pie chart powerpoint template. This power point template has been designed with graphic of pie chart and four staged info graphics. This PPT contains the concept of data analysis and data representation. Use this PPT for your data and result analysis related presentation.
-
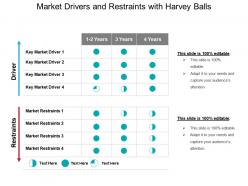 Market drivers and restraints with harvey balls powerpoint slide designs
Presenting market drivers and restraints with harvey balls PPT Slide which is 100% editable. This slideshow is data driven chart and the shapes of the graphics adjust automatically according to your data. Easy to customize and personalize this PowerPoint template and its high resolution visuals are easy to modify as per your need. This PowerPoint theme is compatible with Google Slides , multiple software and format options. This PPT is used by business analysts and professionals belongs to sales and marketing.
-
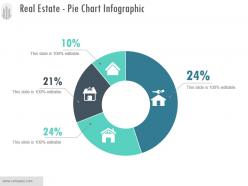 Real estate pie chart infographic sample of ppt presentation
Presenting real estate pie chart infographic sample of ppt presentation. This is a real estate pie chart infographic sample of ppt presentation. This is a four stage process. The stages in this process are icons, strategy, percentage, finance, business.
-
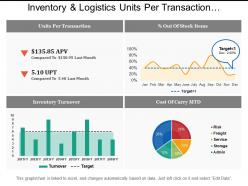 Inventory and logistics units per transaction dashboards
Spectacular inventory and logistics units per transaction dashboards PPT template. Top quality and creative PowerPoint slide design. Adjustable presentation graphic as compatible with Google slides. Perfect for sales executives, marketers, business professionals, analysts, strategists, students, teachers, etc. Information on making the changes has been provided for your provision. Download is rapid and can be displayed in widescreen view mode also. 100% editable PPT designs as completely modifiable such as icons, text, colors, etc. Effortlessly convertible into JPEG and PDF file formats.
-
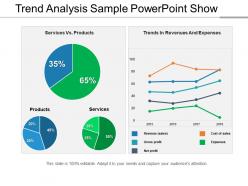 Trend analysis sample powerpoint show
Presenting a PowerPoint slide named Trend Analysis Sample PowerPoint Show. Create a compelling presentation with this PPT diagram, which is both professional and editable. Customize colors, choose font styles, and size. You can choose from a wide variety of icons. Resize and scale the images to fit any content. The PPT slide is compatible with Google Slides and can be fetched at once. You can save it as both PDF and JPG format. This PPT slide is data-driven and linked to the Excel sheet.
-
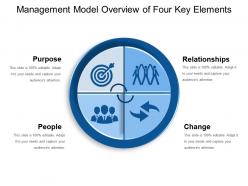 Management model overview of four key elements
Presenting this set of slides with name - Management Model Overview Of Four Key Elements. This is a four stage process. The stages in this process are Management Model, Management Framework, Management Structure.
-
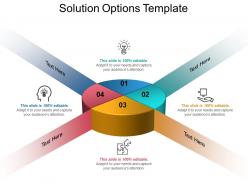 Solution options template ppt samples download
Presenting solution options template ppt samples download. This is a solution options template ppt samples download. This is a four stage process. The stages in this process are solution options, solution architecture, enterprise architecture.
-
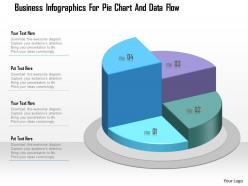 1214 business infographics for pie chart and data flow powerpoint template
We are proud to present our 1214 business infographics for pie chart and data flow powerpoint template. Graphic of business info graphics and pie chart has been used to craft this power point template. This PPT contains the concept of data flow. Use this PPT for your business and marketing related presentations.
-
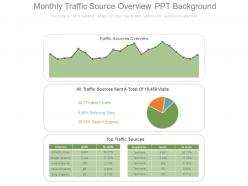 Monthly traffic source overview ppt background
Presenting monthly traffic source overview ppt background. This is a monthly traffic source overview ppt background. This is a four stage process. The stages in this process are traffic sources overview, direct traffic, referring sites, search engines.
-
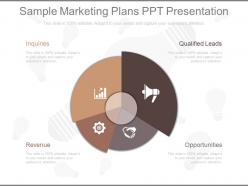 Sample marketing plans ppt presentation
Perfect for creating marketing plans for your new product or service. Completely compatible with Google slides. Matching Presentation designs available with different nodes and stages. Icon, Image and logo can be added or replaced as per industry requirement. Editable PowerPoint templates to provide you customize options. Simple to download and insert in the ongoing presentation. The stages in this process are inquiries, revenue, qualified leads, opportunities.
-
 3d pie shape icon
Presenting this set of slides with name - 3d Pie Shape Icon. This is a four stage process. The stages in this process are Pie Charts, Marketing, Business.
-
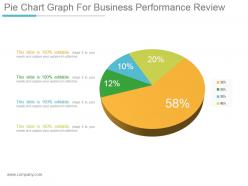 Pie chart graph for business performance review ppt design templates
Presenting pie chart graph for business performance review ppt design templates. This is a pie chart graph for business performance review ppt design templates. This is a four stage process. The stages in this process are pie, percentage, business, finance, marketing.
-
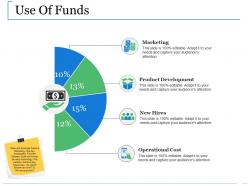 Use of funds ppt slides gallery
Presenting this set of slides with name - Use Of Funds Ppt Slides Gallery. This is a four stage process. The stages in this process are Business, Operational Cost, New Hires, Product Development, Marketing.
-
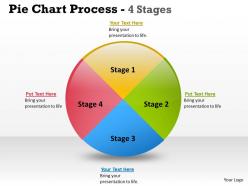 Pie chart process 4 stages 7
This template is skillfully designed and is completely editable to suit all the needs and requirements of the user. The color of the font, its size, style, and all other elements can be customized according to the user's desire The text in the PPT placeholder can be replaced with the desired information making this template highly flexible and adaptable as well. This template is also compatible with various Microsoft versions and formats like Google Slides, JPG, PDF, etc so the user will face no issue in saving it in the format of his choice.
-
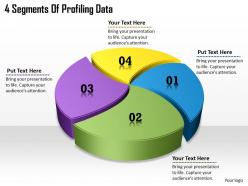 1113 business ppt diagram 4 segments of profiling data powerpoint template
We are proud to present our 1113 business ppt diagram 4 segments of profiling data powerpoint template. Clear and concise is the credo of our Strategy Powerpoint Templates. Use them and dispel any doubts your team may have. Effective communication is what our Marketing Powerpoint Templates ensure. They help you put across your views with precision and clarity.
-
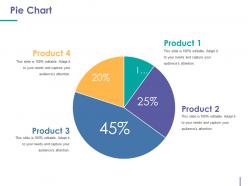 Pie chart powerpoint templates download
Presenting Pie Chart PowerPoint Templates Download. This PPT theme is available in both 4:3 and 16:9 aspect ratios. This PowerPoint template is customizable so you can modify the font size, font type, color and shapes as per your requirements. This PPT presentation is Google Slides compatible hence it is easily accessible. You can download and save this PowerPoint layout in different formats like PDF, PNG, and JPG.
-
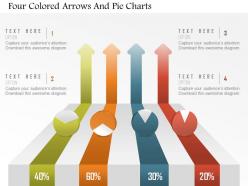 Am four colored arrows and pie charts powerpoint template
We are proud to present our am four colored arrows and pie charts powerpoint template. Graphic of four colored arrows and pie chart has been used to craft this PPT diagram. This PPT diagram contains the concept of financial analysis. Use this PPT and build an exclusive presentation for finance and marketing related topics.
-
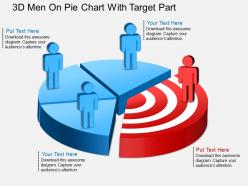 Ec 3d men on pie chart with target part powerpoint template
Presenting ec 3d men on pie chart with target part powerpoint template. This Power Point template diagram has been crafted with graphic of 3d man on pie chart. This PPT diagram contains the concept of target achievement. Use this PPT diagram for business and marketing related presentations.
-
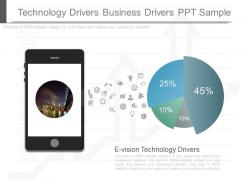 See technology drivers business drivers ppt sample
They will have an eye-opening impact on the audience by their astounding looks. They can be converted into different formats. They are result and technology oriented. They can be customised by changing the size and shape of icons and also by adding logos and images. They are compatible with google. The stages in this process are e vision, technology drivers, finance, marketing.
-
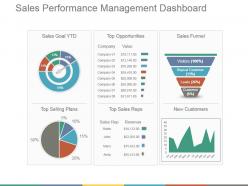 Sales performance management dashboard snapshot ppt background images
Presenting sales performance management dashboard ppt background images. This is a sales performance management dashboard snapshot ppt background images. This is a four stage process. The stages in this process are sales goal ytd, top opportunities, sales funnel, top selling plans, top sales reps, new customers.
-
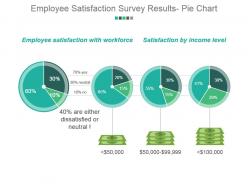 Employee satisfaction survey results pie chart powerpoint presentation examples
Presenting employee satisfaction survey results pie chart powerpoint presentation examples. This is a employee satisfaction survey results pie chart powerpoint presentation examples. This is a four stage process. The stages in this process are employee satisfaction with workforce, satisfaction by income level.
-
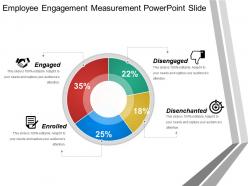 Employee engagement measurement powerpoint slide
Presenting employee engagement measurement PowerPoint slide. This layout is fully compatible with Google slides and data driven. User can edit the data in linked excel sheet and graphs and charts gets customized accordingly. Easy to put in company logo, trademark or name; accommodate words to support the key points. Images do no distort out even when they are projected on large screen. Adjust colors, text and fonts as per your business requirements.
-
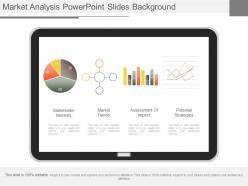 Use market analysis powerpoint slides background
Presenting use market analysis powerpoint slides background. This is a market analysis powerpoint slides background. This is a four stage process. The stages in this process are stakeholder interests, market trends, assessment of impact, potential strategies.
-
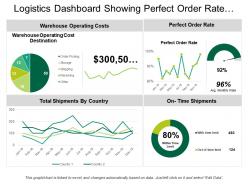 Logistics dashboard showing perfect order rate and on time shipments
Presenting Logistics Dashboard Showing Perfect Order Rate And On Time Shipments PPT slide. The on-time shipments dashboard PowerPoint template designed professionally by the team of SlideTeam to present the record of on time delivery to clients and investors. The different icons such as pie chart, ring, line chart and many other which include text in the perfect order rate dashboard slide are customizable in PowerPoint. A user can illustrate the desired values as the graphical dashboard template get linked with Excel Sheet and it is also compatible with Google Slide. A user can do alteration in the font size, font type, color and dimensions of the line and pie chart to present the desired delivery time.
-
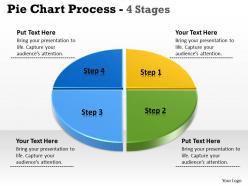 Pie chart 4 stages 5
This template is skillfully designed and is completely editable to suit all the needs and requirements of the user. The color of the font, its size, style, and all other elements can be customized according to the user's desire The text in the PPT placeholder can be replaced with the desired information making this template highly flexible and adaptable as well. This template is also compatible with various Microsoft versions and formats like Google Slides, JPG, PDF, etc so the user will face no issue in saving it in the format of his choice.
-
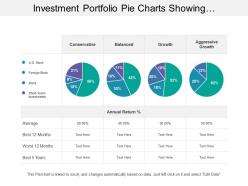 Investment portfolio pie charts showing conservative and balanced growth
Presenting this set of slides with name - Investment Portfolio Pie Charts Showing Conservative And Balanced Growth. This is a four stage process. The stages in this process are Investment Portfolio, Funding Portfolio, Expenditure Portfolio.
-
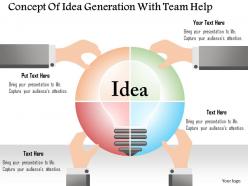 0115 concept of idea generation with team help powerpoint template
Innovative slide design with the concept of idea generation with team help useful for business analysts, market researchers, sales and marketing people, etc. Completely editable content including fonts, text, colors, etc. Compatible with number of software options. Personalize the presentation with individual company name and logo. Excellence in picture quality even on wide screen output. Easy and quick downloading process. Compatible with Google slides. Adaptable PPT designs as can be converted into JPEG and PDF.
-
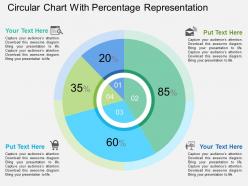 Circular chart with percentage representation flat powerpoint design
We are proud to present our circular chart with percentage representation flat powerpoint design. Graphic of circular chart and percentage graphics has been used to design this power point template diagram. This PPT diagram contains the concept of financial analysis. Use this PPT diagram for business and marketing related presentations.
Toggle Nav

Skip to Content

Search
5
Notifications 5
-
 SlideTeam has published a new blog titled "Top 7 Delivery Plan Templates with Examples and Samples".
1 hour ago
-
 SlideTeam has published a new blog titled "Top 10 des modèles de jalons de produits avec des échantillons et des exemples".
1 hour ago
-
 SlideTeam has published a new blog titled "أفضل 5 قوالب PPT لتدفق عمليات المستودعات مع عينات وأمثلة".
1 hour ago
-
 SlideTeam has published a new blog titled "Os 5 principais modelos de PPT de fluxo de processo de armazém com amostras e exemplos".
1 hour ago
-
 SlideTeam has published a new blog titled "Top 5 des modèles PPT de flux de processus d'entrepôt avec des échantillons et des exemples".
1 hour ago


