16387944 style technology 2 big data 2 piece powerpoint presentation diagram infographic slide
Showcase the business processes and its operations by using Business Impact Analysis Input And Output. You can highlight the numerous steps of disaster recovery like electronic vaulting, transaction integrity, business-integrated solution, no off-site data, and point-in-time copies with the help of this business analytics presentation template. Take the assistance of our business continuity planning PowerPoint graphic to create a plan for resuming operations after a disaster, to identify the impactful events that continue the operations, and to publicize the commitment of the organization. Use business process PPT visual to plan, prepare, and communicate to avoid any kind of difficulties that occurs while executing a product. Employ the business impact analysis PPT slideshow to generate a management report that helps to monitor the recovery strategies. Included here are various high-quality icons with which you can make your presentation visually appealing and engaging. Therefore, gather the relevant data that helps to recover from the damaged operations by downloading our ready-to-use business continuity management PPT theme.
Showcase the business processes and its operations by using Business Impact Analysis Input And Output. You can highlight th..
- Google Slides is a new FREE Presentation software from Google.
- All our content is 100% compatible with Google Slides.
- Just download our designs, and upload them to Google Slides and they will work automatically.
- Amaze your audience with SlideTeam and Google Slides.
-
Want Changes to This PPT Slide? Check out our Presentation Design Services
- WideScreen Aspect ratio is becoming a very popular format. When you download this product, the downloaded ZIP will contain this product in both standard and widescreen format.
-

- Some older products that we have may only be in standard format, but they can easily be converted to widescreen.
- To do this, please open the SlideTeam product in Powerpoint, and go to
- Design ( On the top bar) -> Page Setup -> and select "On-screen Show (16:9)” in the drop down for "Slides Sized for".
- The slide or theme will change to widescreen, and all graphics will adjust automatically. You can similarly convert our content to any other desired screen aspect ratio.
Compatible With Google Slides

Get This In WideScreen
You must be logged in to download this presentation.
PowerPoint presentation slides
Presenting Business Impact Analysis Input And Output which is completely editable. You can change the font, color, font size, and font types of the slides as per your needs. This template is adaptable with Google Slides which makes it easily accessible at once. Open and save your presentation in various formats like PDF, JPG, and PNG. Freely access your presentation in both 4:3 and 16:9 aspect ratio.
Content of this Powerpoint Presentation
Description:
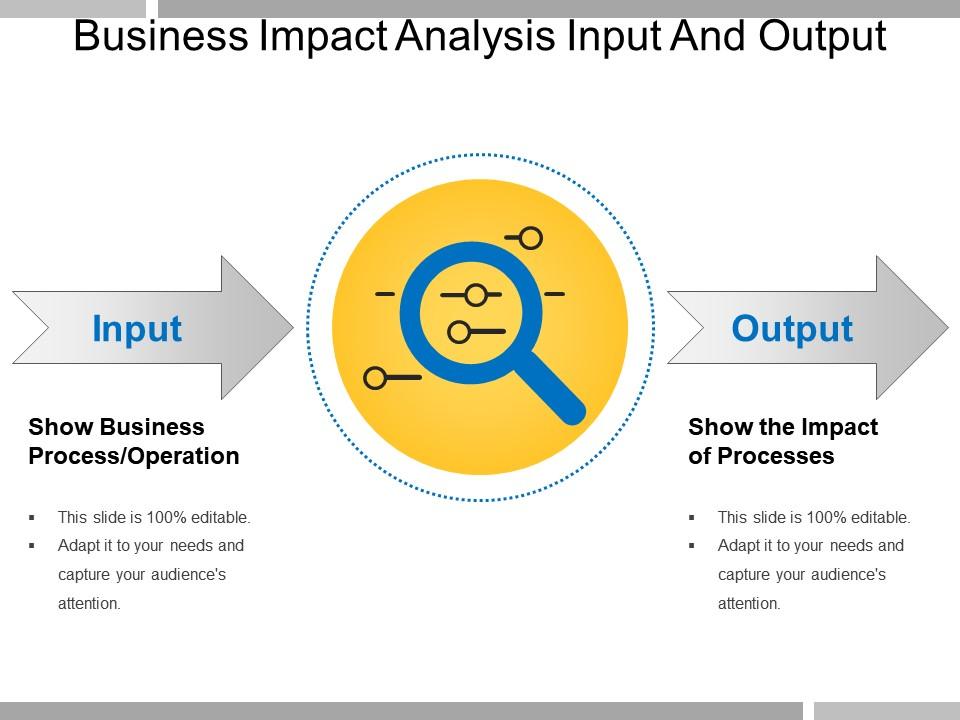
This image presents a slide from a presentation focused on "Business Impact Analysis Input And Output." The main title is bold and centered at the top, immediately informing viewers of the slide's topic. It highlights the concept of inputs and outputs within the context of business impact analysis.
"Input," there's an arrow pointing towards a central icon that combines a magnifying glass with various business-related symbols, suggesting a close examination of business processes and operations. Below the arrow, the text instructs the audience to "Show Business Process/Operation." This indicates to the presenter that the input side of the diagram should detail the specific business processes being analyzed for their impact.
"Output" is accompanied by an arrow pointing away from the central icon. The text below this arrow instructs the presenter to "Show the Impact of Processes," guiding them to demonstrate the results or consequences of inputs on business operations.
Use Cases:
Here are seven industries where this slide can be used, along with its potential uses, presenters, and audiences:
1. Manufacturing:
Use: Identifying the efficiency of production inputs and outputs.
Presenter: Operations Manager
Audience: Plant Managers and Operational Staff
2. Financial Services:
Use: Analyzing the impact of investment strategies.
Presenter: Financial Analyst
Audience: Investors and Financial Advisors
3. Information Technology:
Use: Mapping out the input of technical requirements and the output of system performance.
Presenter: IT Project Manager
Audience: Developers and Key Stakeholders
4. Healthcare:
Use: Assessing the input of patient care procedures and the output of health outcomes.
Presenter: Healthcare Administrator
Audience: Medical Staff and Healthcare Policy Makers
5. Retail:
Use: Evaluating the input of sales strategies and the output in terms of customer purchases and satisfaction.
Presenter: Retail Operations Director
Audience: Store Managers and Marketing Teams
6. Education:
Use: Demonstrating the input of educational techniques and the output in student learning and success rates.
Presenter: Education Consultant
Audience: Teachers and Educational Administrators
7. Energy:
Use: Showing the input of resource extraction processes and the output of energy production.
Presenter: Energy Analyst
Audience: Policy Makers and Sustainability Managers
16387944 style technology 2 big data 2 piece powerpoint presentation diagram infographic slide with all 5 slides:
Be an ideal brand ambassador with our Business Impact Analysis Input And Output. Extol the benefits of the goods you endorse.
-
Easily Understandable slides.
-
Best way of representation of the topic.


