62162090 style variety 2 currency 2 piece powerpoint presentation diagram infographic slide
Display your thoughts on our Budget And Financial Snapshot Powerpoint Shapes. They will take the world by storm.
- Google Slides is a new FREE Presentation software from Google.
- All our content is 100% compatible with Google Slides.
- Just download our designs, and upload them to Google Slides and they will work automatically.
- Amaze your audience with SlideTeam and Google Slides.
-
Want Changes to This PPT Slide? Check out our Presentation Design Services
- WideScreen Aspect ratio is becoming a very popular format. When you download this product, the downloaded ZIP will contain this product in both standard and widescreen format.
-

- Some older products that we have may only be in standard format, but they can easily be converted to widescreen.
- To do this, please open the SlideTeam product in Powerpoint, and go to
- Design ( On the top bar) -> Page Setup -> and select "On-screen Show (16:9)” in the drop down for "Slides Sized for".
- The slide or theme will change to widescreen, and all graphics will adjust automatically. You can similarly convert our content to any other desired screen aspect ratio.
Compatible With Google Slides

Get This In WideScreen
You must be logged in to download this presentation.
PowerPoint presentation slides
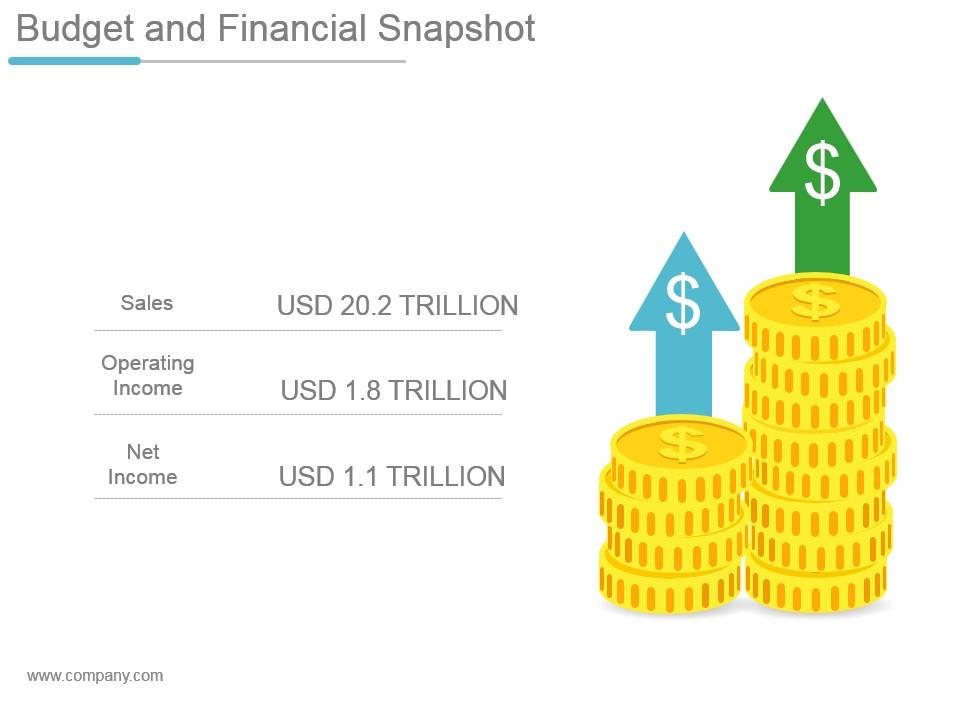
Presenting budget and financial snapshot powerpoint shapes. This is a budget and financial snapshot powerpoint shapes. This is a two stage process. The stages in this process are sales, operating income, net income.
Content of this Powerpoint Presentation
Description:
The image presented is a simplified financial summary slide titled "Budget and Financial Snapshot," providing a concise overview of key monetary metrics for a company or entity. The slide aims to offer a snapshot of the financial standing, emphasizing essential revenue and income figures.
The textual elements of the slide include:
1. Sales:
USD 20.2 TRILLION - Indicating the total revenue generated from sales before any costs or expenses are deducted.
2. Operating Income:
USD 1.8 TRILLION - Representing the profits realized from business operations after deducting operating expenses like wages and cost of goods sold, but before interest and taxes.
3. Net Income:
USD 1.1 TRILLION - Reflecting the bottom line or net profits after all expenses, including tax and interest, have been accounted for.
The graphical elements of the slide include stacks of coins with arrows pointing upwards, symbolizing an increase or positive performance in financial terms.
Use Cases:
This type of slide could be applicable in various industries and contexts where financial performance is key:
1. Finance:
Use: Presenting financial health and profitability
Presenter: Financial Analyst
Audience: Investors or Corporate Executives
2. Government:
Use: Reporting on economic metrics or budget reviews
Presenter: Treasury Official
Audience: Policy Makers or Public Stakeholders
3. Retail:
Use: Annual sales performance review
Presenter: CFO or Retail Analyst
Audience: Shareholders or Retail Management
4. Technology:
Use: Earnings report for tech corporations
Presenter: CEO or Financial Director
Audience: Analysts or Shareholders
5. Manufacturing:
Use: Financial briefing on manufacturing output and returns
Presenter: Operations Manager
Audience: Board Members or Investors
6. Healthcare:
Use: Financial state overview for healthcare providers or insurers
Presenter: Healthcare Administrator
Audience: Insurance Providers or Hospital Stakeholders
7. Energy:
Use: Assessing financial performance within the energy sector
Presenter: Financial Officer or Energy Economist
Audience: Industry Investors or Policy Analysts
62162090 style variety 2 currency 2 piece powerpoint presentation diagram infographic slide with all 5 slides:
Give a boost to honest coverage with our Budget And Financial Snapshot Powerpoint Shapes. Insist on journalistic ethics.
-
Out of the box and creative design.
-
Design layout is very impressive.


