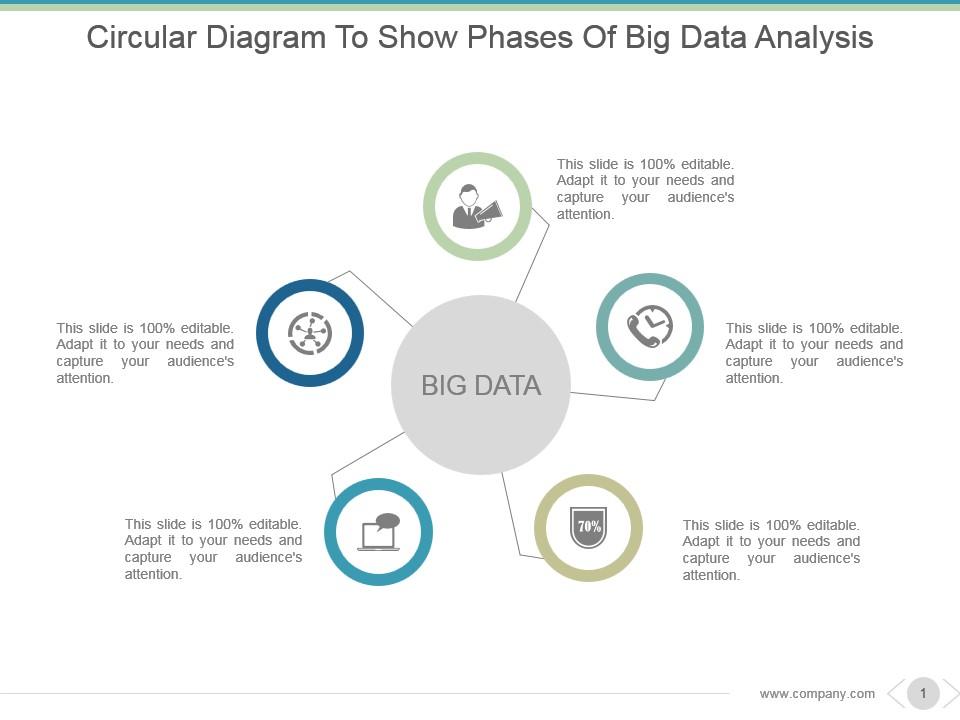
Circular diagram to show phases of big data analysis powerpoint presentation
Elaborate on irrigation with our Circular Diagram To Show Phases Of Big Data Analysis Powerpoint Presentation. Explain how to improve the fertility of the fields.
- Google Slides is a new FREE Presentation software from Google.
- All our content is 100% compatible with Google Slides.
- Just download our designs, and upload them to Google Slides and they will work automatically.
- Amaze your audience with SlideTeam and Google Slides.
-
Want Changes to This PPT Slide? Check out our Presentation Design Services
- WideScreen Aspect ratio is becoming a very popular format. When you download this product, the downloaded ZIP will contain this product in both standard and widescreen format.
-

- Some older products that we have may only be in standard format, but they can easily be converted to widescreen.
- To do this, please open the SlideTeam product in Powerpoint, and go to
- Design ( On the top bar) -> Page Setup -> and select "On-screen Show (16:9)” in the drop down for "Slides Sized for".
- The slide or theme will change to widescreen, and all graphics will adjust automatically. You can similarly convert our content to any other desired screen aspect ratio.
Compatible With Google Slides

Get This In WideScreen
You must be logged in to download this presentation.
PowerPoint presentation slides
Presenting circular diagram to show phases of big data analysis powerpoint presentation. This is a circular diagram to show phases of big data analysis powerpoint presentation. This is a five stage process. The stages in this process are big data, icons, process, analysis, strategy, business, success.
People who downloaded this PowerPoint presentation also viewed the following :
Circular diagram to show phases of big data analysis powerpoint presentation with all 5 slides:
Handle genuine complaints with our Circular Diagram To Show Phases Of Big Data Analysis Powerpoint Presentation. Eliminate any cause for grumbling.
-
Best way of representation of the topic.
-
Professional and unique presentations.


