Commercial real estate property management powerpoint presentation slides
Give an attractive yet informative introduction to the property market with this Commercial Real Estate Property Management PowerPoint Presentation Slides. Provide an executive summary of the global market by taking the aid of these PPT templates. Present a pricing strategy snapshot along with the average sales report with the assistance of our property investment PowerPoint presentation. Showcase the global market trends to the entrepreneurs and investors in a well-organized manner with the help of our land stakes PPT templates. Mention the growth drivers in property dealing to help your clients make an informed decision through this estate development PPT slideshow. Employ these professionally designed realty shares PowerPoint graphics to illustrate the outlay structure of the investment process. Prepare a plan of action assessing the market overview and industry trends of real estate with the help of this well-organized land and property PPT deck. Download this expertly designed PowerPoint presentation and lay a solid work foundation. Additional slides at the end allow you to showcase the laws and regulations regarding real estate and many more factors.
Give an attractive yet informative introduction to the property market with this Commercial Real Estate Property Management..
- Google Slides is a new FREE Presentation software from Google.
- All our content is 100% compatible with Google Slides.
- Just download our designs, and upload them to Google Slides and they will work automatically.
- Amaze your audience with SlideTeam and Google Slides.
-
Want Changes to This PPT Slide? Check out our Presentation Design Services
- WideScreen Aspect ratio is becoming a very popular format. When you download this product, the downloaded ZIP will contain this product in both standard and widescreen format.
-

- Some older products that we have may only be in standard format, but they can easily be converted to widescreen.
- To do this, please open the SlideTeam product in Powerpoint, and go to
- Design ( On the top bar) -> Page Setup -> and select "On-screen Show (16:9)” in the drop down for "Slides Sized for".
- The slide or theme will change to widescreen, and all graphics will adjust automatically. You can similarly convert our content to any other desired screen aspect ratio.
Compatible With Google Slides

Get This In WideScreen
You must be logged in to download this presentation.
PowerPoint presentation slides
Presenting our Commercial Real Estate Property Management PowerPoint Presentation Slides. This is a 100% editable and adaptable PPT slide. You can save it in different formats like PDF, JPG, and PNG. It can be edited with different colors, fonts, font sizes, and font types of the template as per your requirements. This template supports the standard (4:3) and widescreen (16:9) format. It is also compatible with Google Slides.
People who downloaded this PowerPoint presentation also viewed the following :
Content of this Powerpoint Presentation
Slide 1: This is the cover slide for Commercial Real Estate Property Management PowerPoint Presentation.
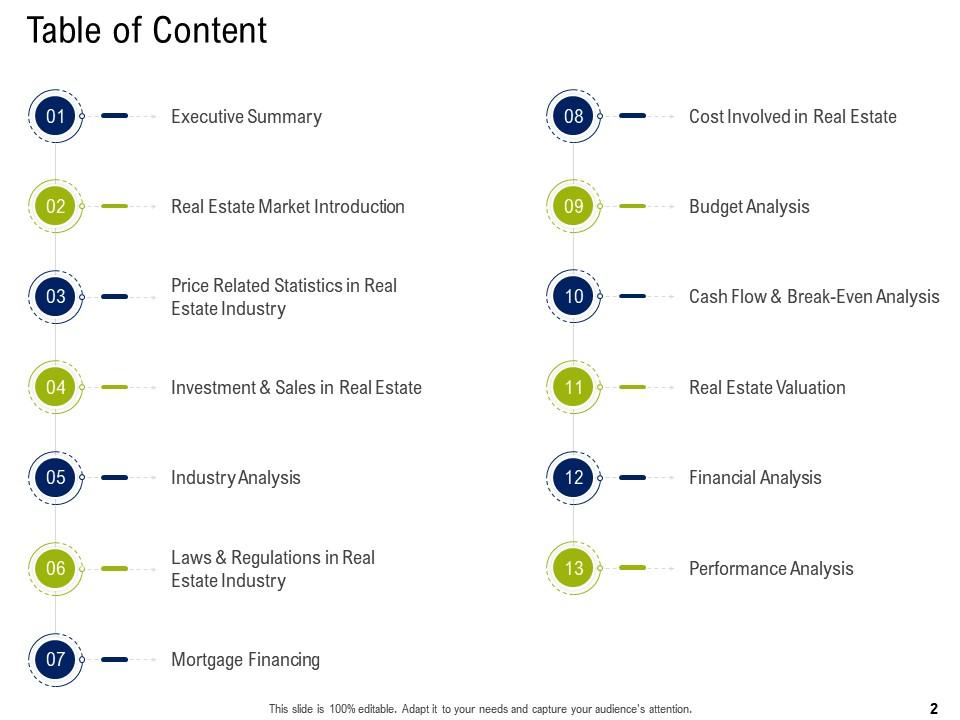
Slide 2: This is a Table of Content slide that lists out all the essential elements covered in the deck.
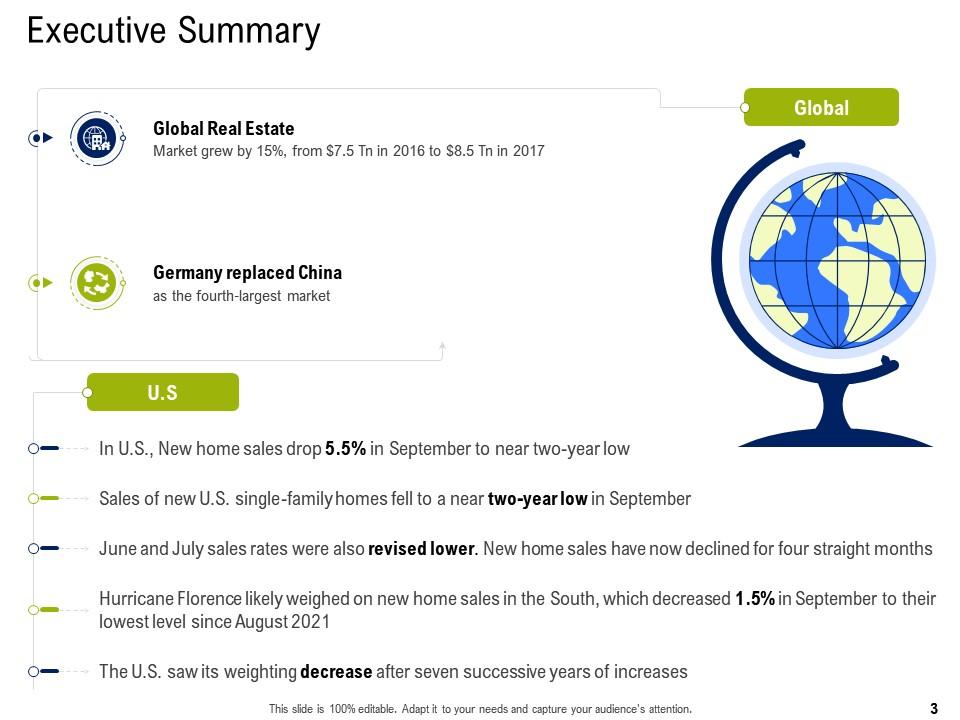
Slide 3: This slide gives an Executive Summary of the Commercial Real Estate Property Management.
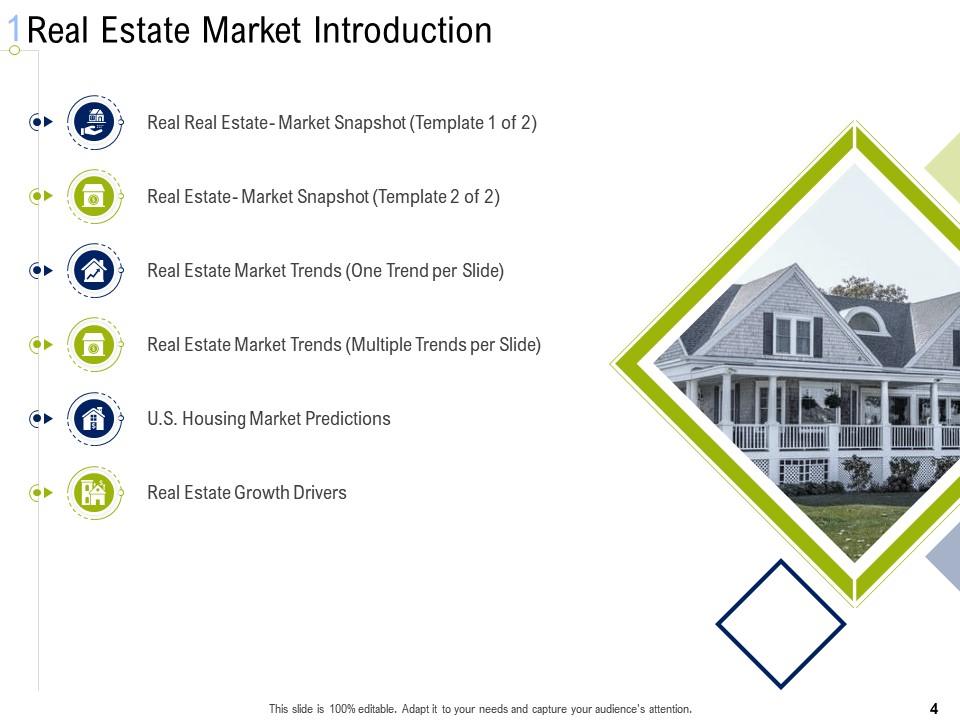
Slide 4: This slide presents Real Estate Market Introduction
Slide 5: This slide provides Real Estate - Market Snapshot
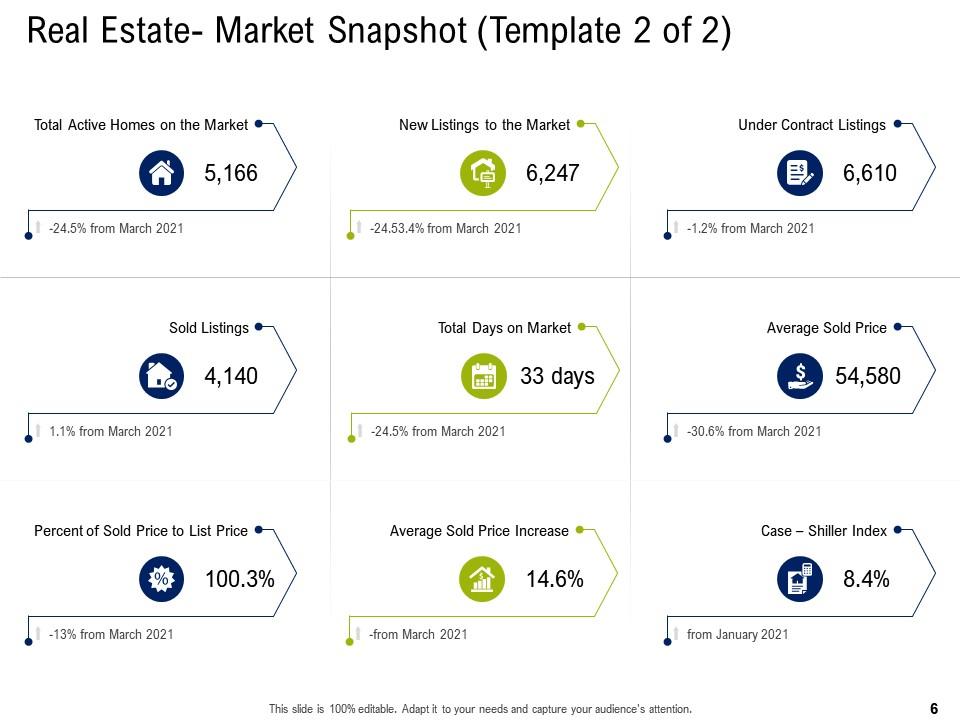
Slide 6: This slide provides Real Estate - Market Snapshot
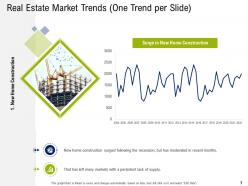
Slide 7: This slide provides a glimpse of real estate market trends.
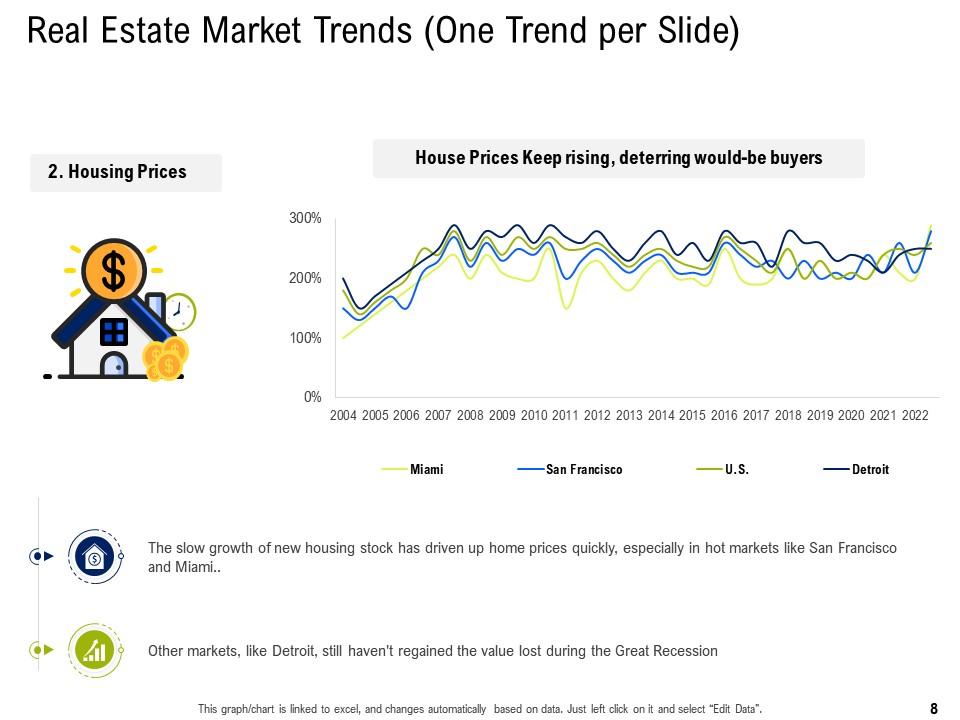
Slide 8: This slide provides a glimpse of real estate market trends.
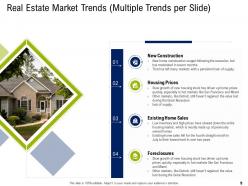
Slide 9: This slide provides a glimpse of different real estate market trends.
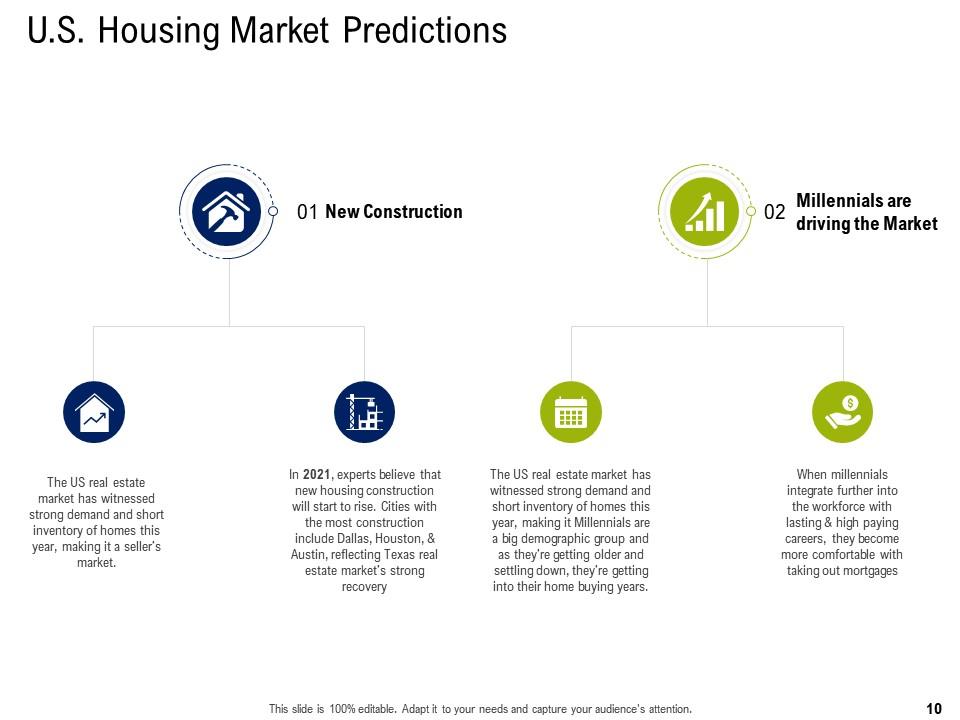
Slide 10: This slide provides a glimpse of US Housing Market Predictions.
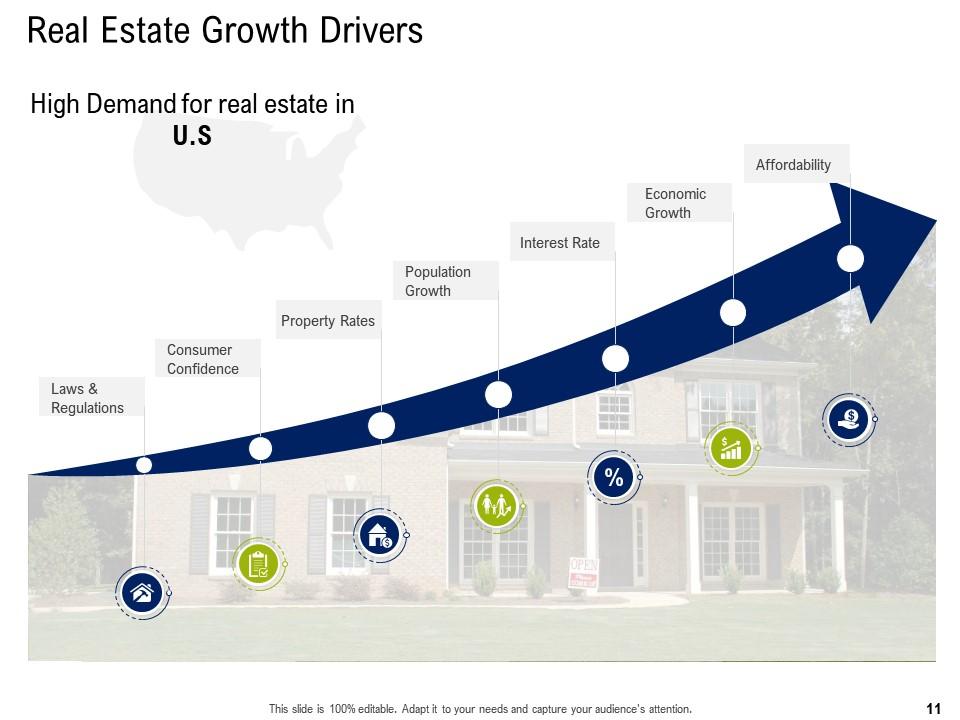
Slide 11: This slide provides a glimpse of real state growth drivers.
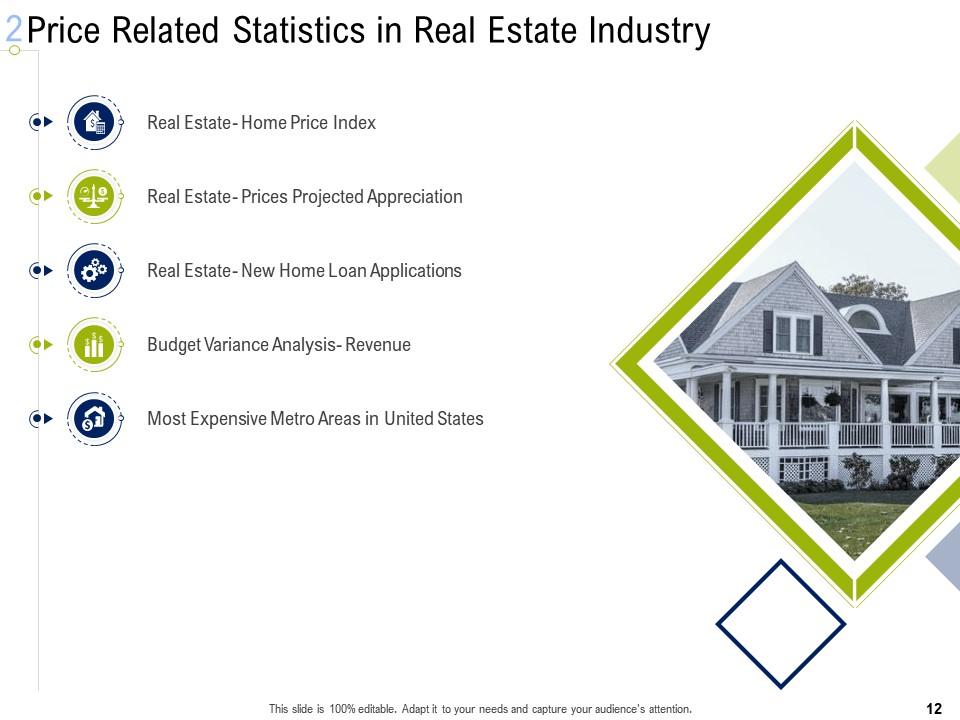
Slide 12: This slide presents Price Related Statistics in Real Estate Industry
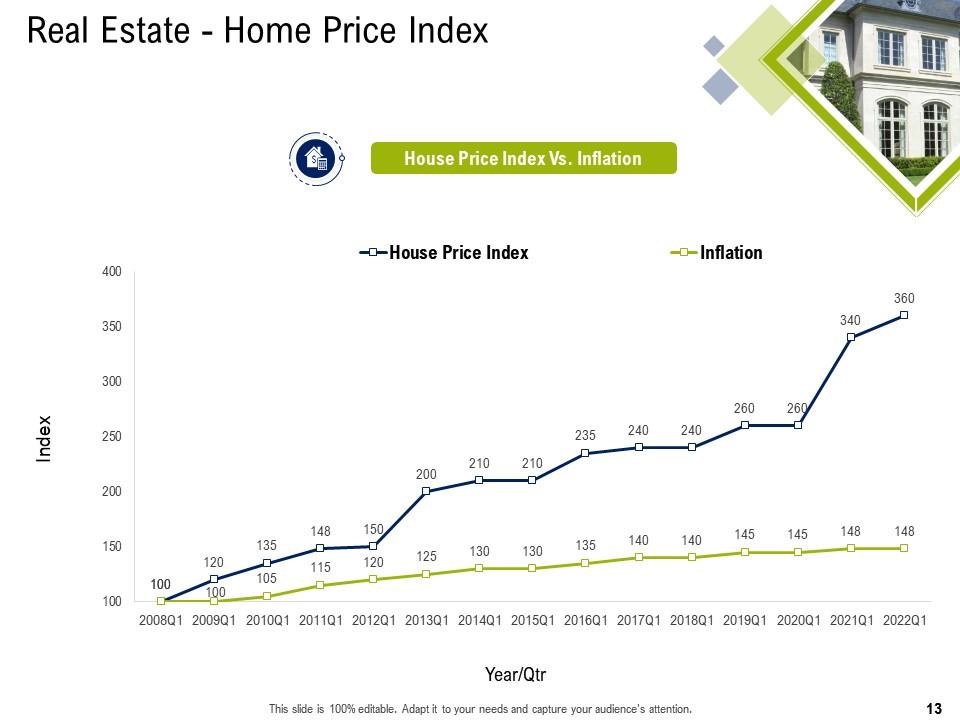
Slide 13: This slide provides a glimpse of Real Estate - Home Price Index
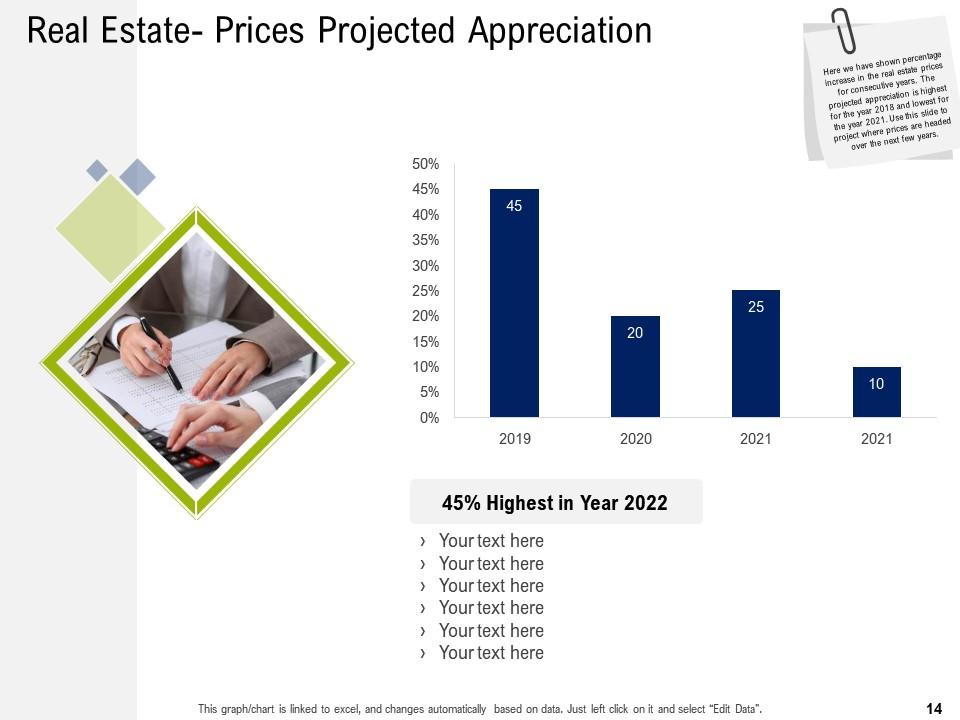
Slide 14: This slide provides a glimpse of Real Estate- Prices Projected Appreciation
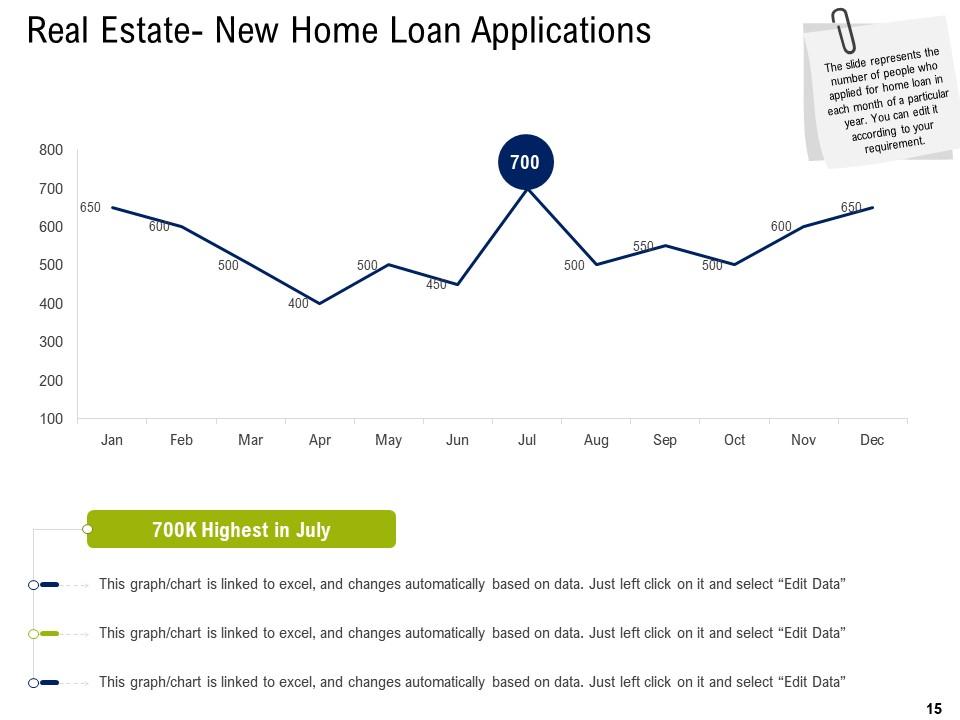
Slide 15: The slide represents the number of people who applied for home loan in each month of a particular year. You can edit it according to your requirement.
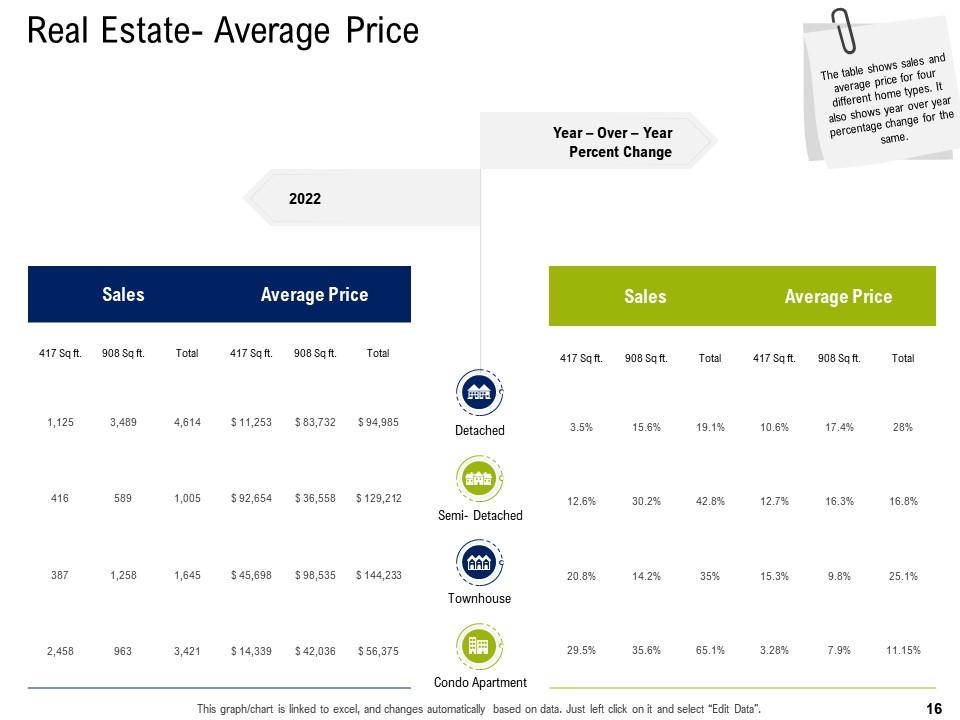
Slide 16: The table shows sales and average price for four different home types. It also shows year over year percentage change for the same.
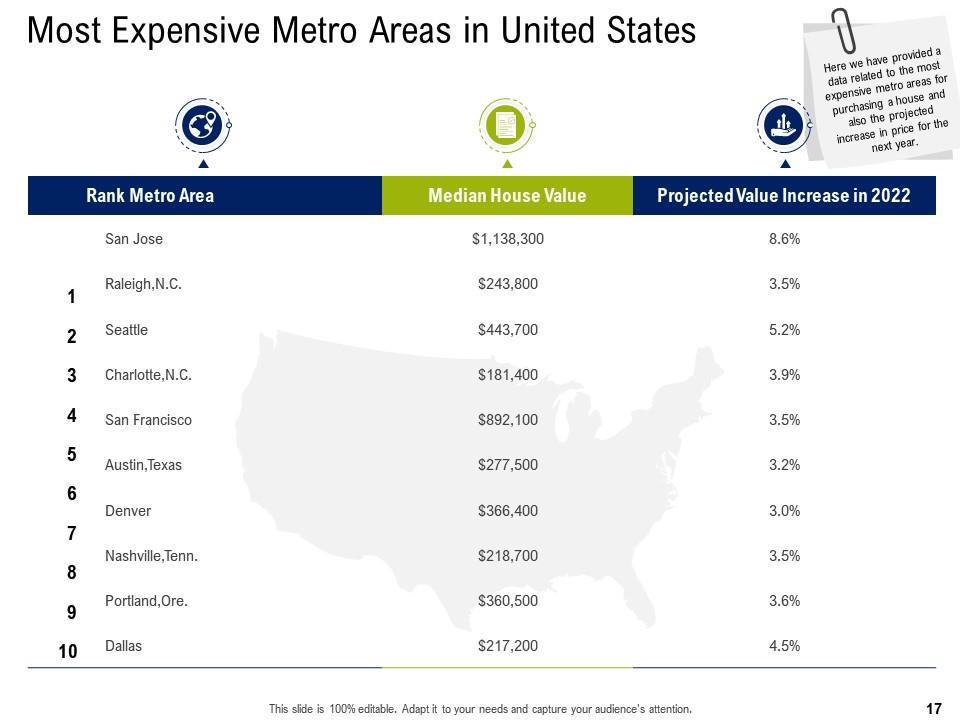
Slide 17: This slide provides data related to the most expensive metro areas for purchasing a house and also the projected increase in price for the next year.
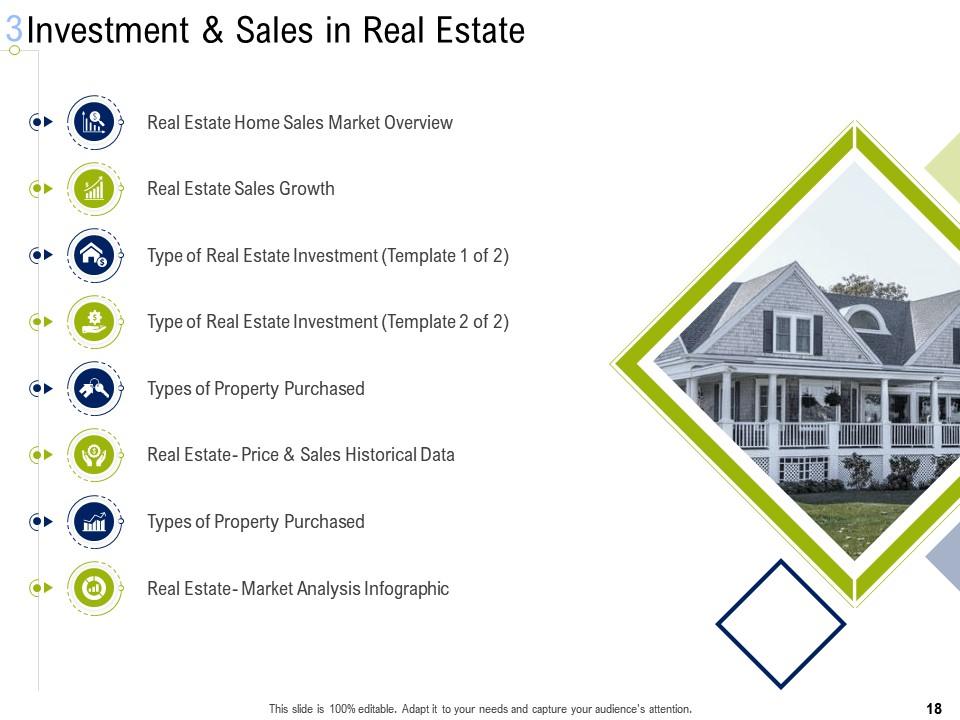
Slide 18: This slide presents Investment & Sales in Real Estate.
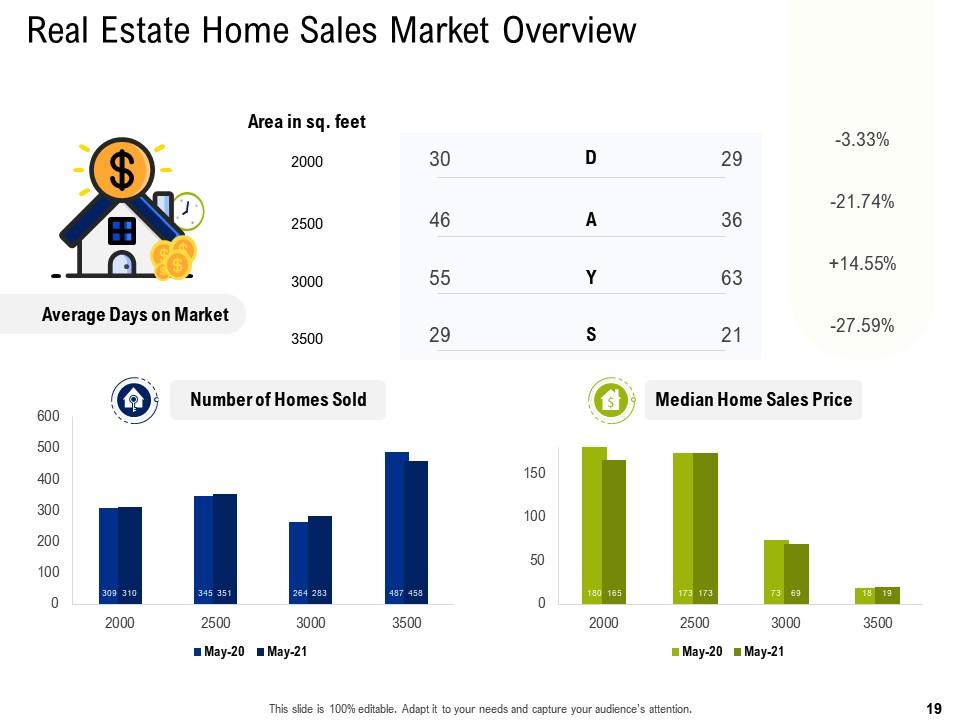
Slide 19: This slide provides a glimpse of Real Estate Home Sales Market Overview.
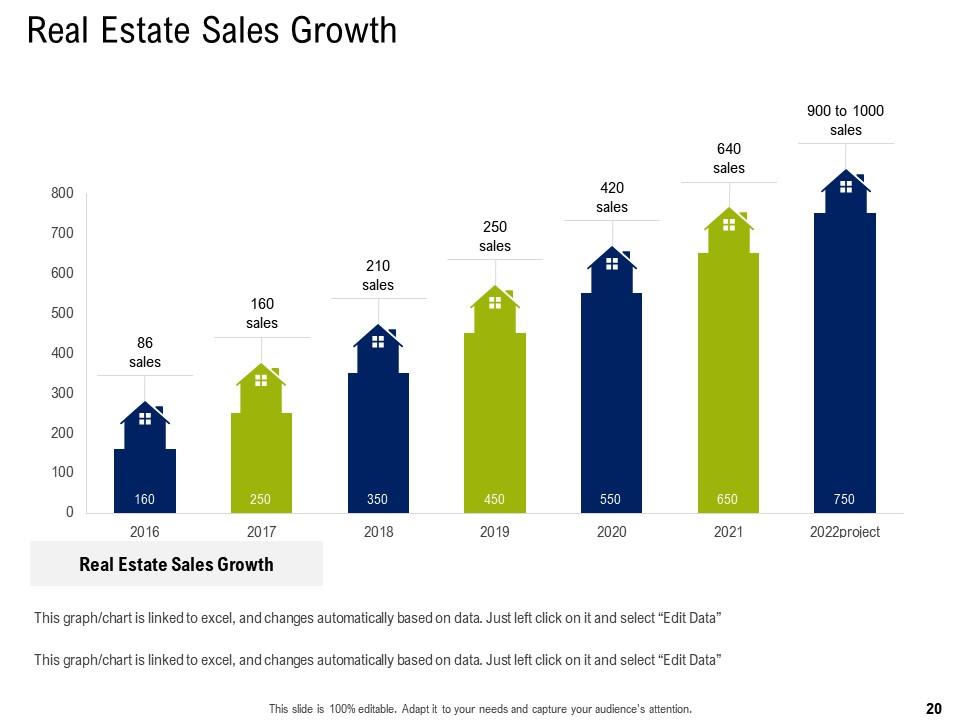
Slide 20: This slide provides a glimpse of Real Estate Sales Growth.
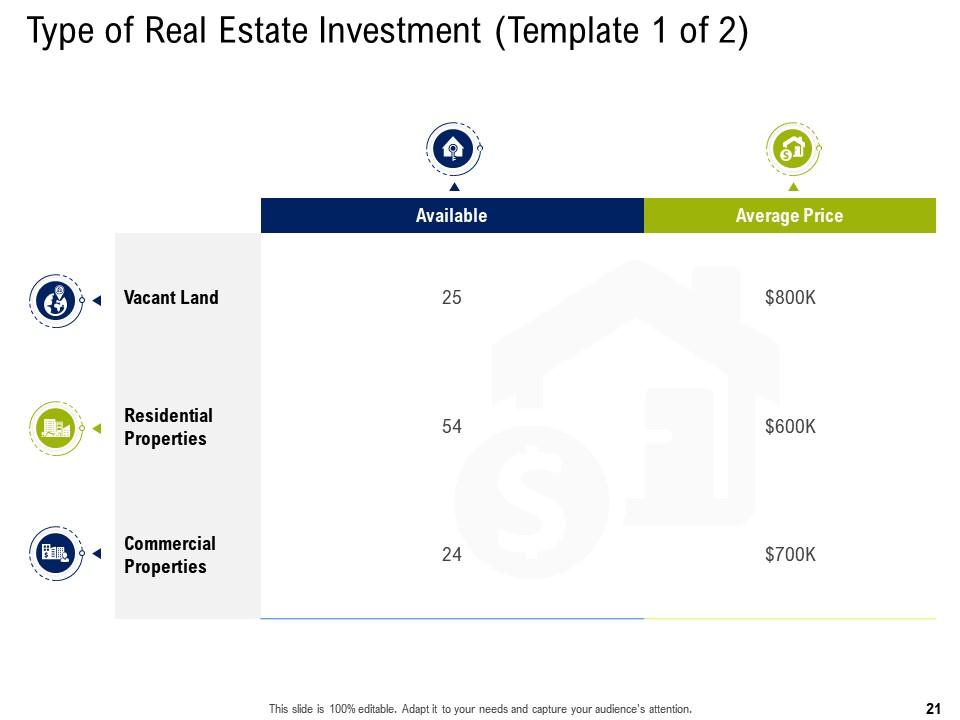
Slide 21: This slide provides a glimpse of Type of Real Estate Investment (Template 1 of 2)
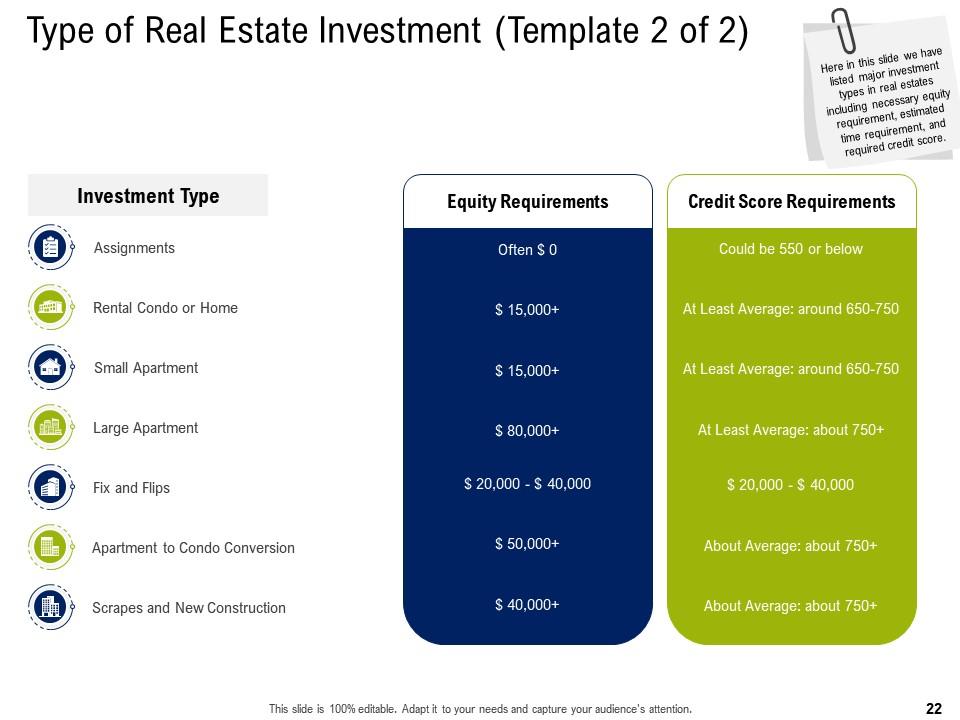
Slide 22: This slide provides a glimpse of major investment types in real estates including necessary equity requirement, estimated time requirement, and required credit score.
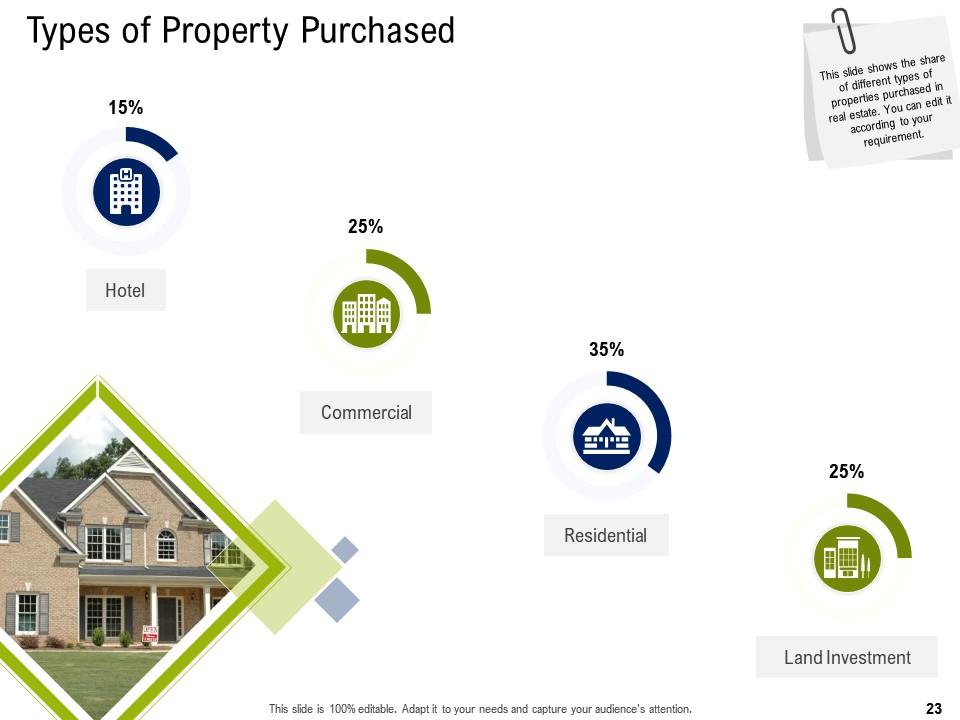
Slide 23: This slide shows the share of different types of properties purchased in real estate. .
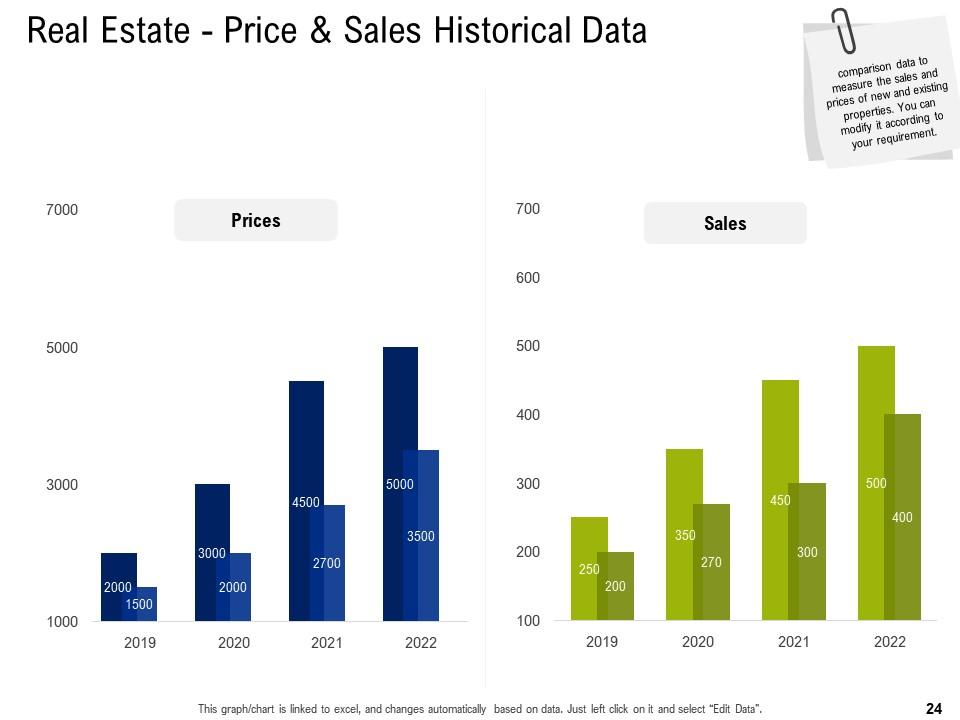
Slide 24: This slide provides a glimpse of comparison data to measure the sales and prices of new and existing properties.
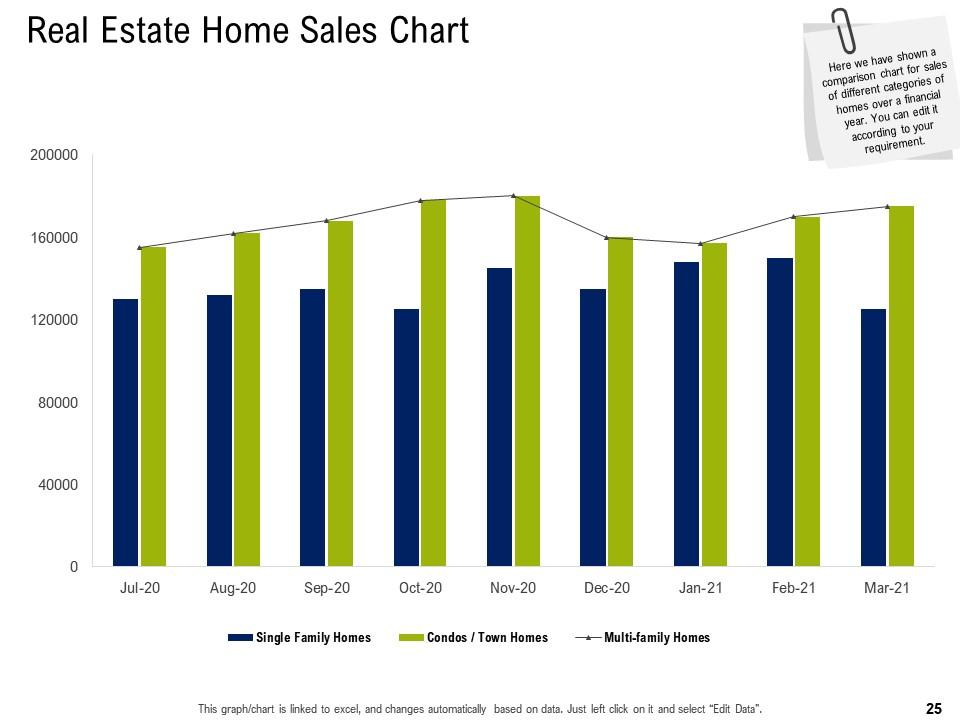
Slide 25: This slide provides a glimpse of comparison chart for sales of different categories of homes over a financial year.
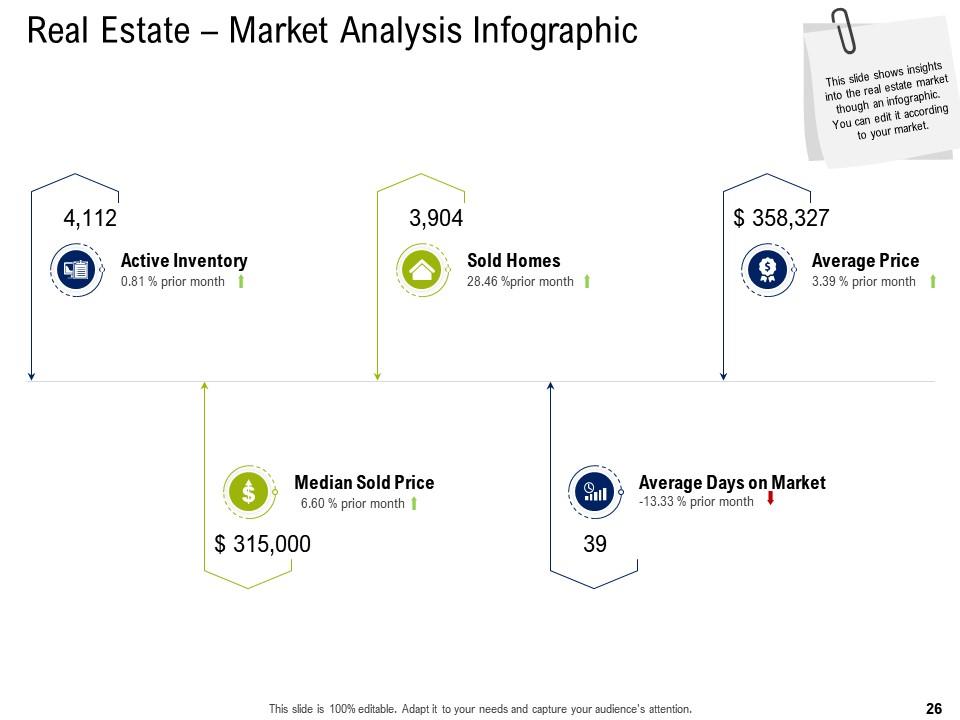
Slide 26: This slide shows insights into the real estate market though an infographic.
Slide 27: This slide presents Industry Analysis.
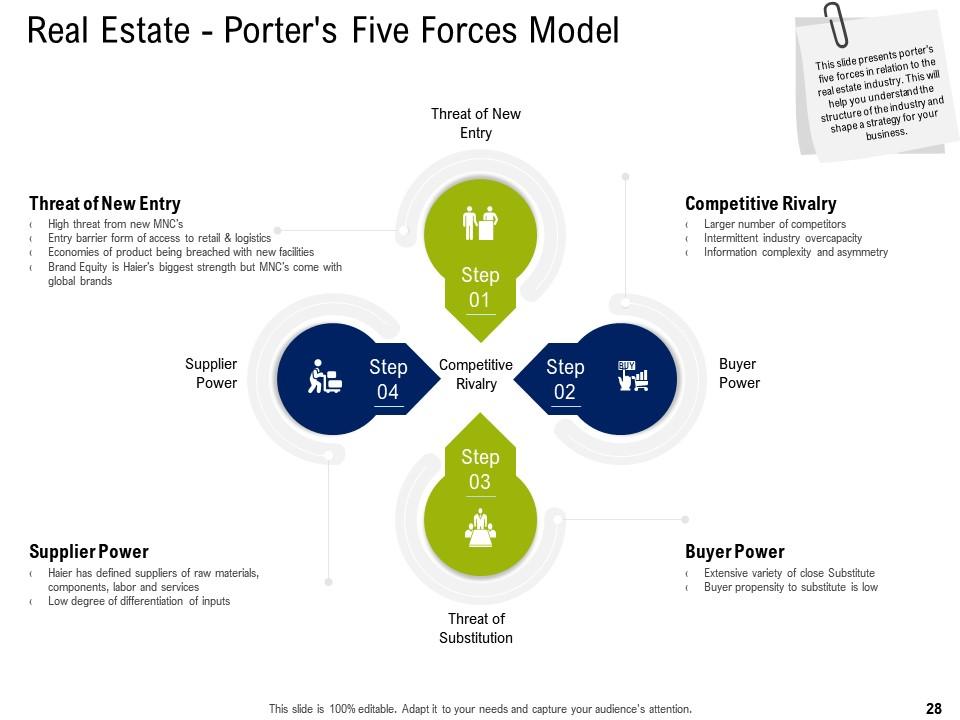
Slide 28: This slide presents porter’s five forces in relation to the real estate industry. This will help you understand the structure of the industry and shape a strategy for your business.
Slide 29: This slide presents Laws and Regulations in Real Estate Industry.
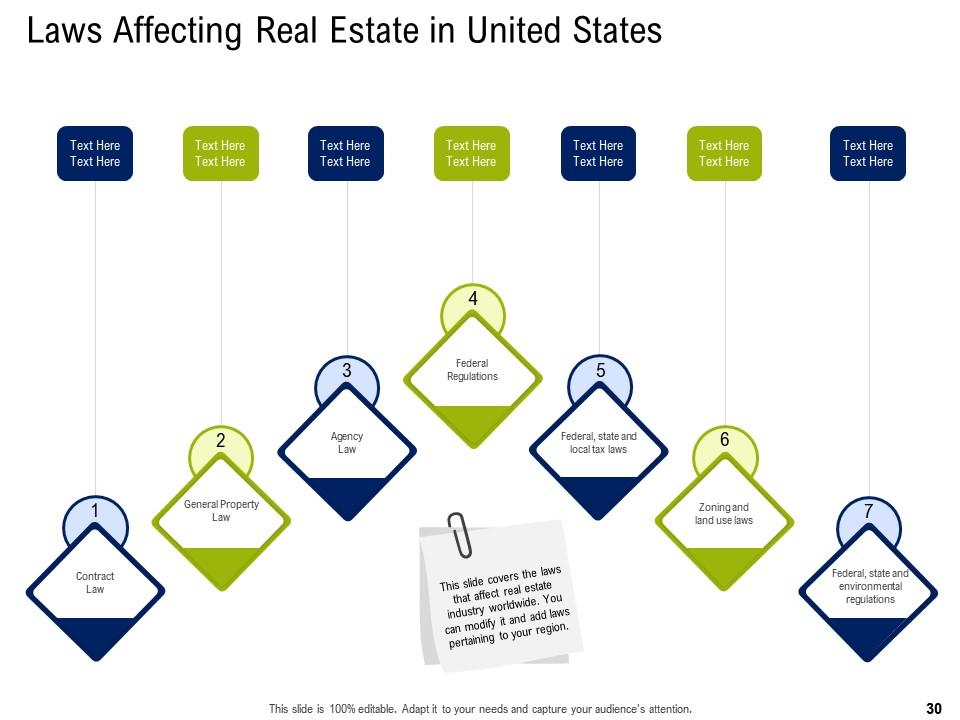
Slide 30: This slide covers the laws that affect real estate industry worldwide. You can modify it and add laws pertaining to your region.
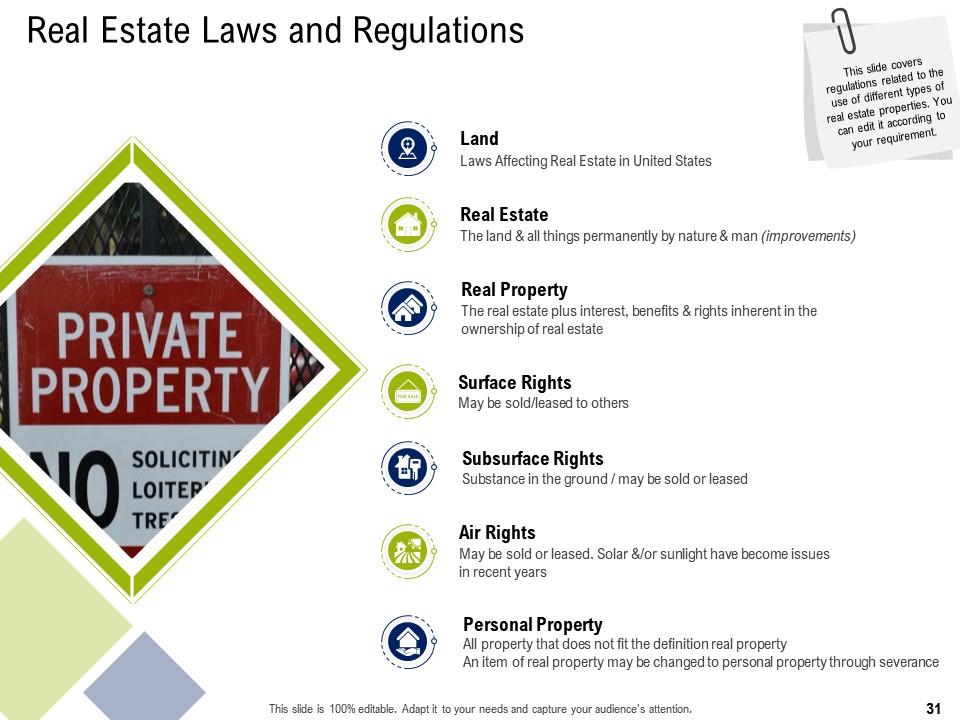
Slide 31: This slide covers regulations related to the use of different types of real estate properties. You can edit it according to your requirement.
Slide 32: This slide presents Mortgage Financing.
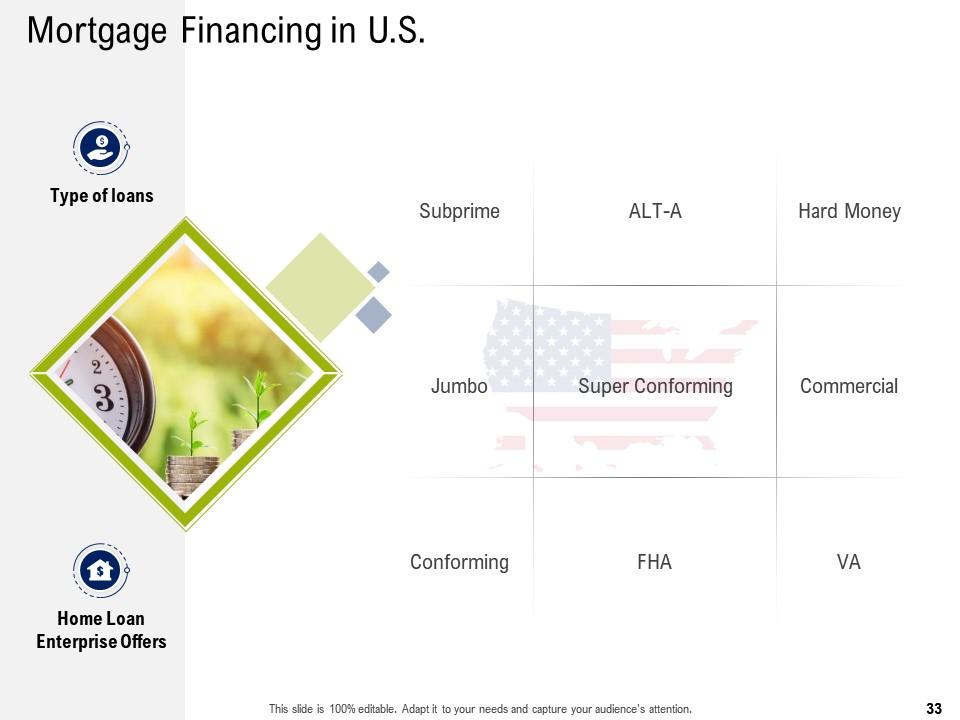
Slide 33: This slide provides a glimpse of Mortgage Financing in U.S.
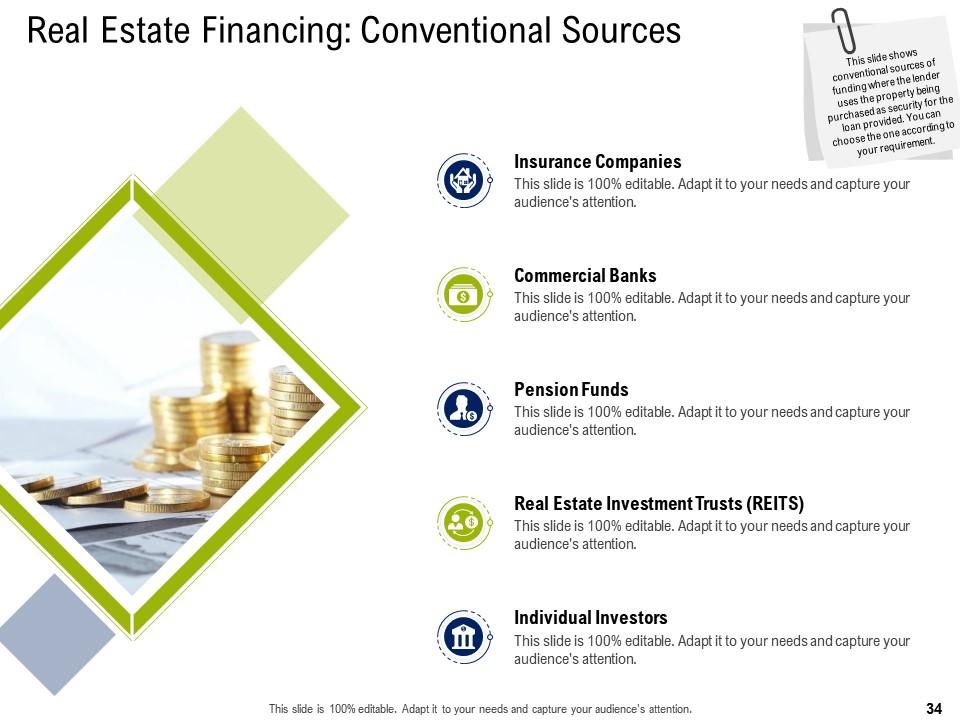
Slide 34: This slide shows conventional sources of funding where the lender uses the property being purchased as security for the loan provided. You can choose the one according to your requirement.
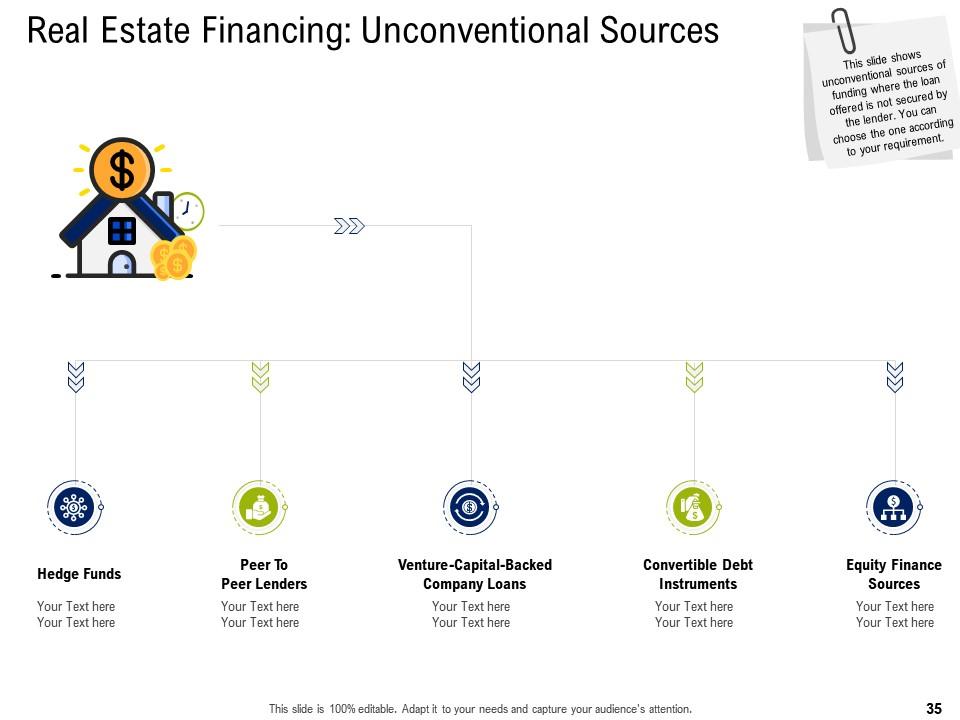
Slide 35: This slide shows unconventional sources of funding where the loan offered is not secured by the lender. You can choose the one according to your requirement.
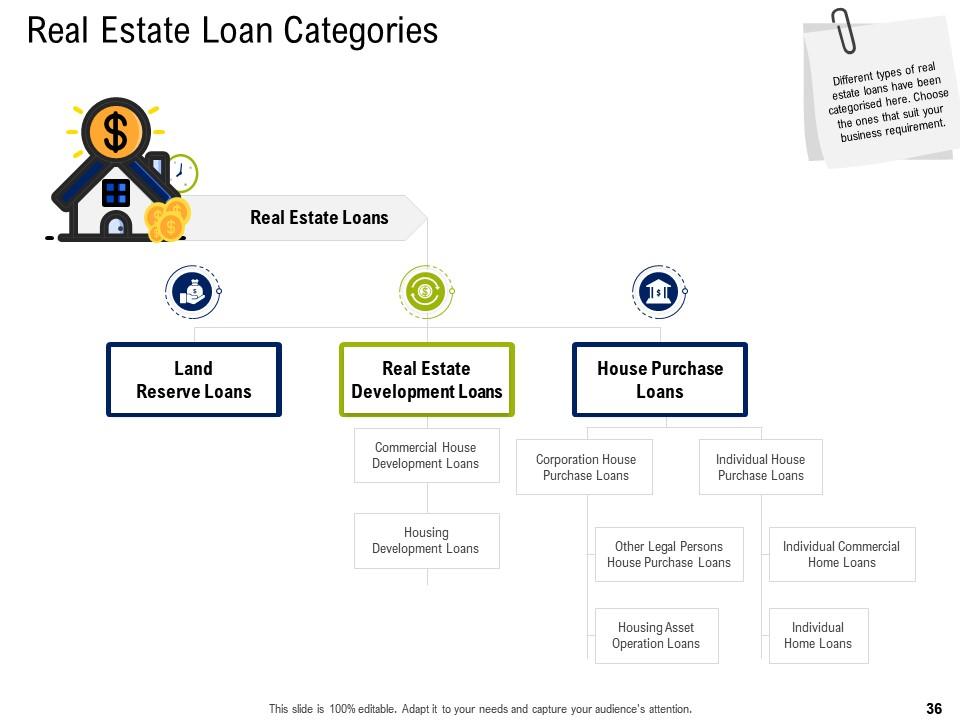
Slide 36: This slide provides a glimpse of Real Estate Loan Categories.
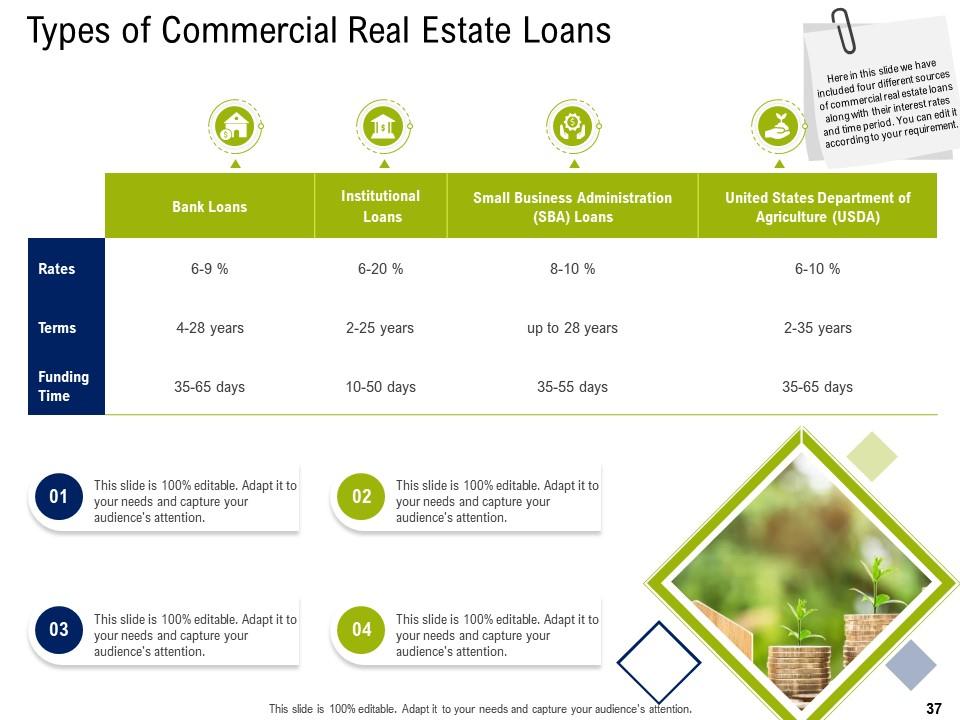
Slide 37: This slide we have included four different sources of commercial real estate loans along with their interest rates and time period. You can edit it according to your requirement.
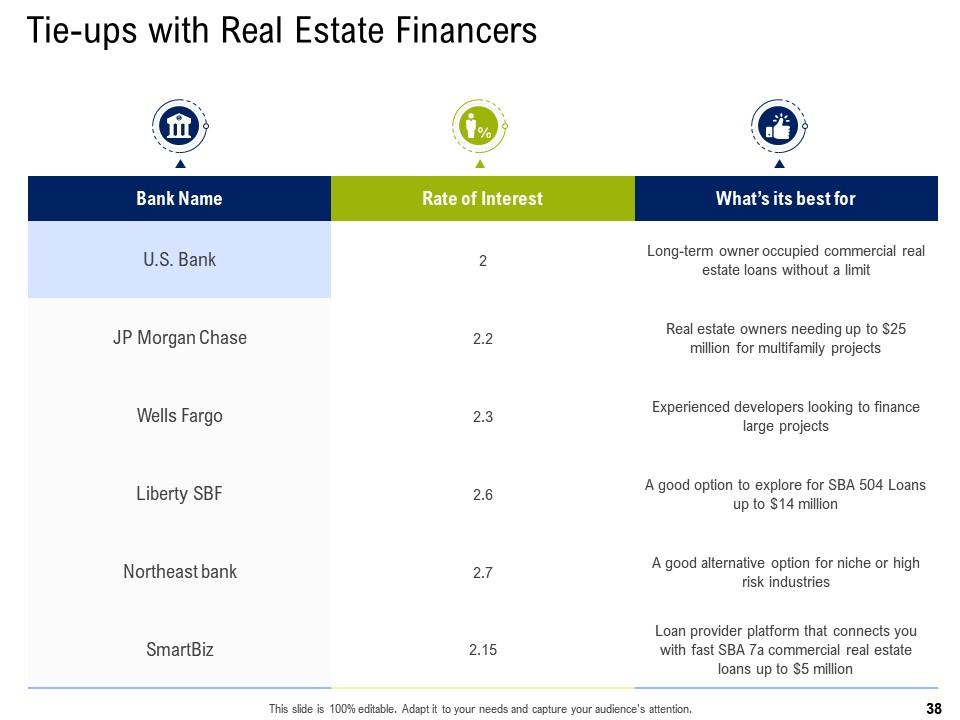
Slide 38: This slide provides a glimpse of Tie-ups with Real Estate Financers.
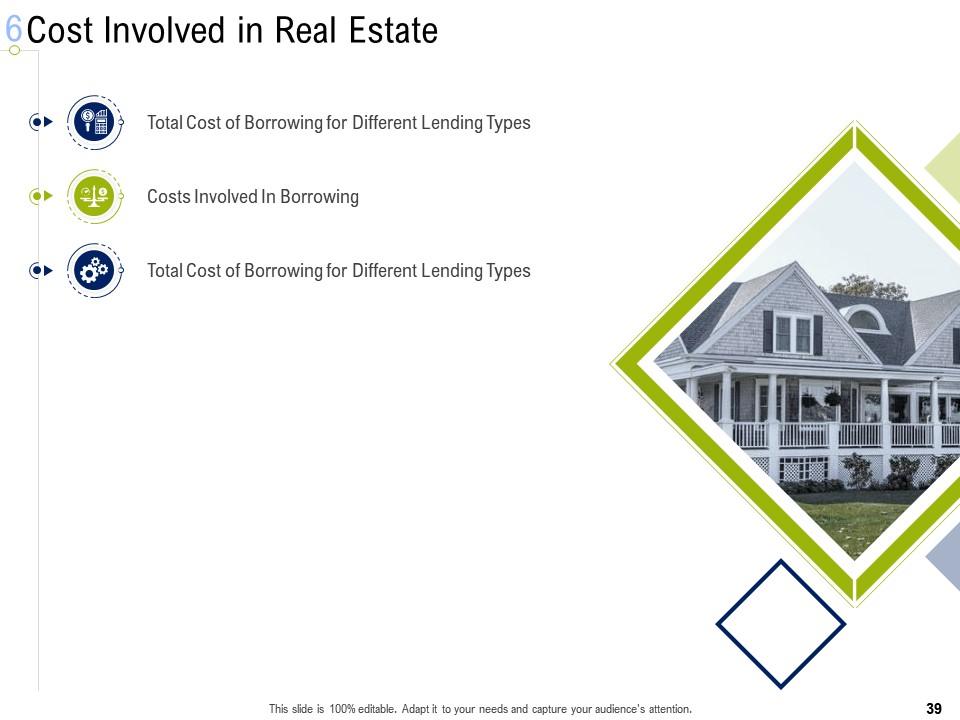
Slide 39: This slide presents Cost Involved in Real Estate.
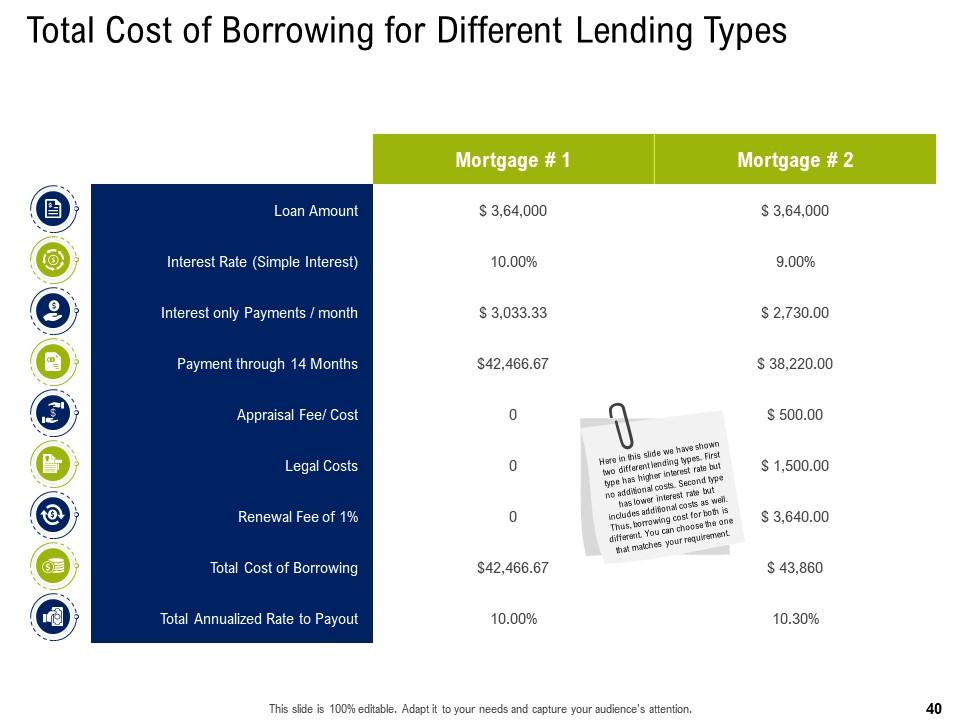
Slide 40: This slide shows two different lending types. First type has higher interest rate but no additional costs. Second type has lower interest rate but includes additional costs as well. Thus, borrowing cost for both is different. You can choose the one that matches your requirement.
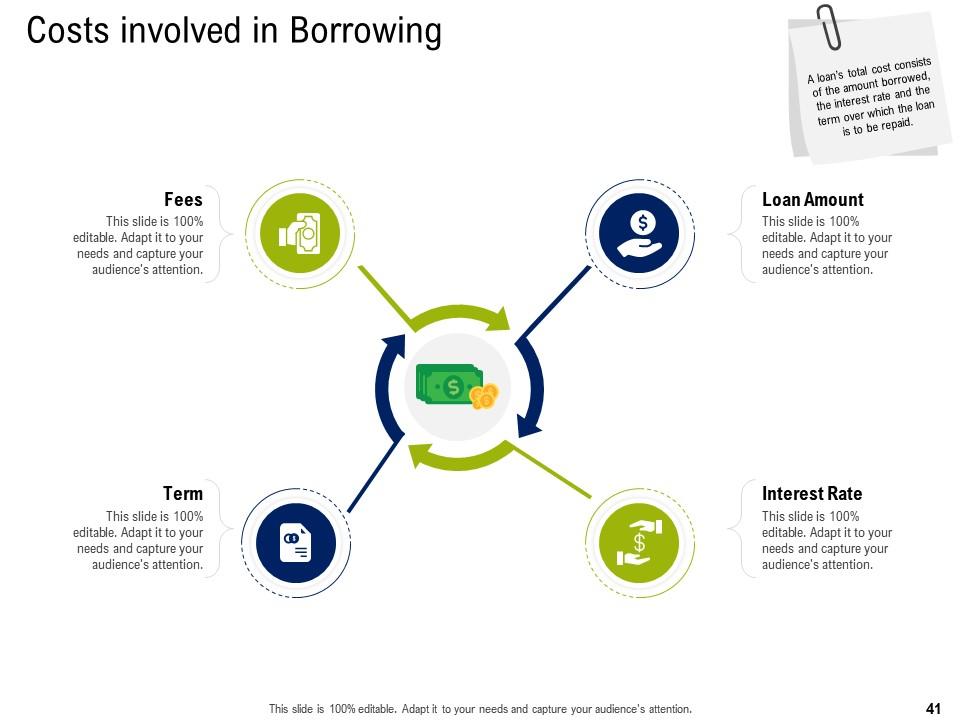
Slide 41: This slide provides a glimpse of cost involved in borrowing.
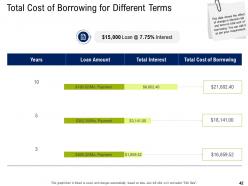
Slide 42: This slide shows the effect of change in interest rate and term on total cost of borrowing.
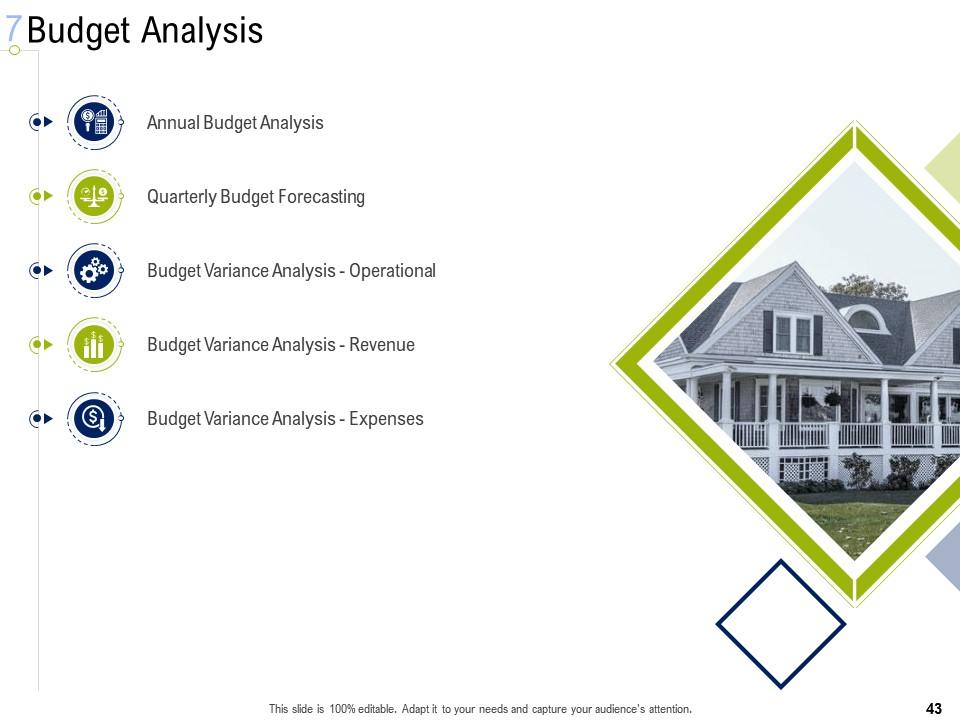
Slide 43: This slide presents Budget Analysis.
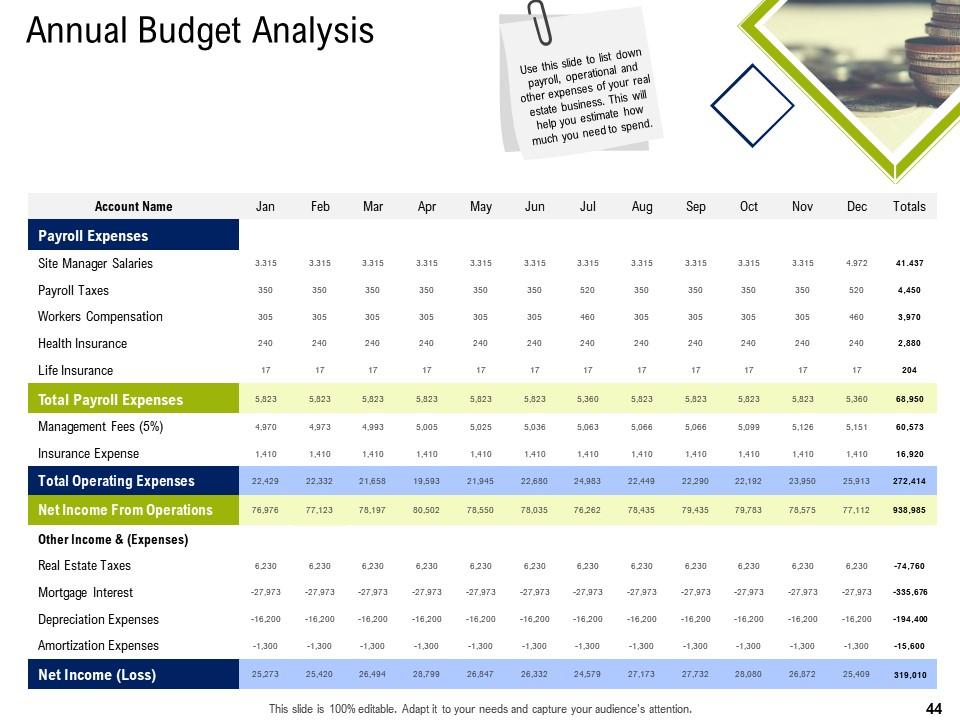
Slide 44: This slide helps you list down payroll, operational and other expenses of your real estate business. This will help you estimate how much you need to spend.
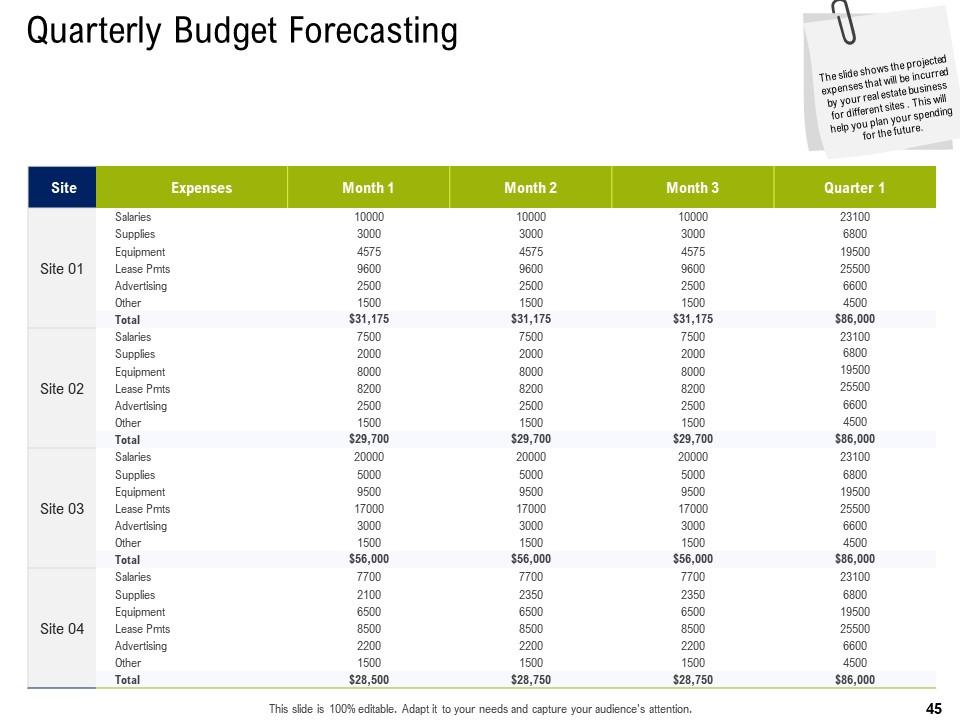
Slide 45: The slide shows the projected expenses that will be incurred by your real estate business for different sites . This will help you plan your spending for the future.
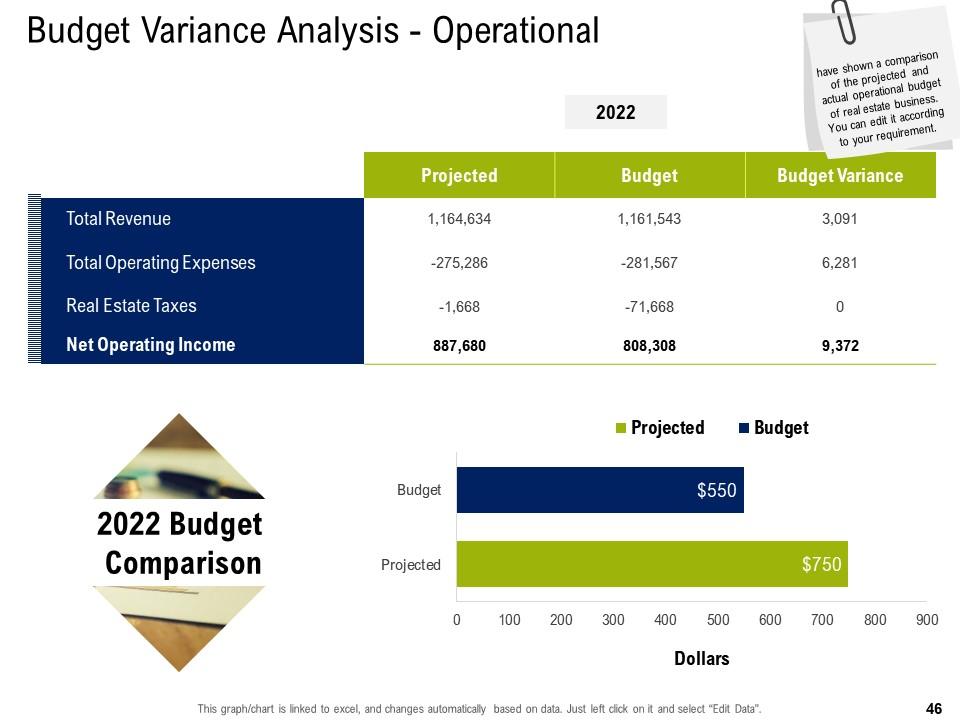
Slide 46:
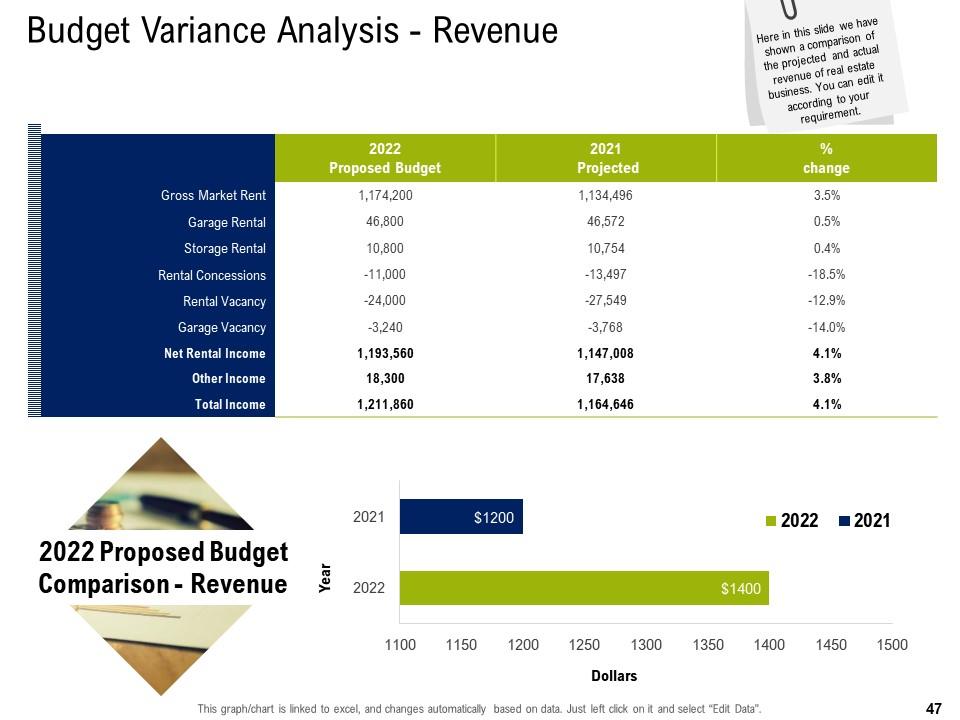
Slide 47: This slide shows a comparison of the projected and actual revenue of real estate business. You can edit it according to your requirement.
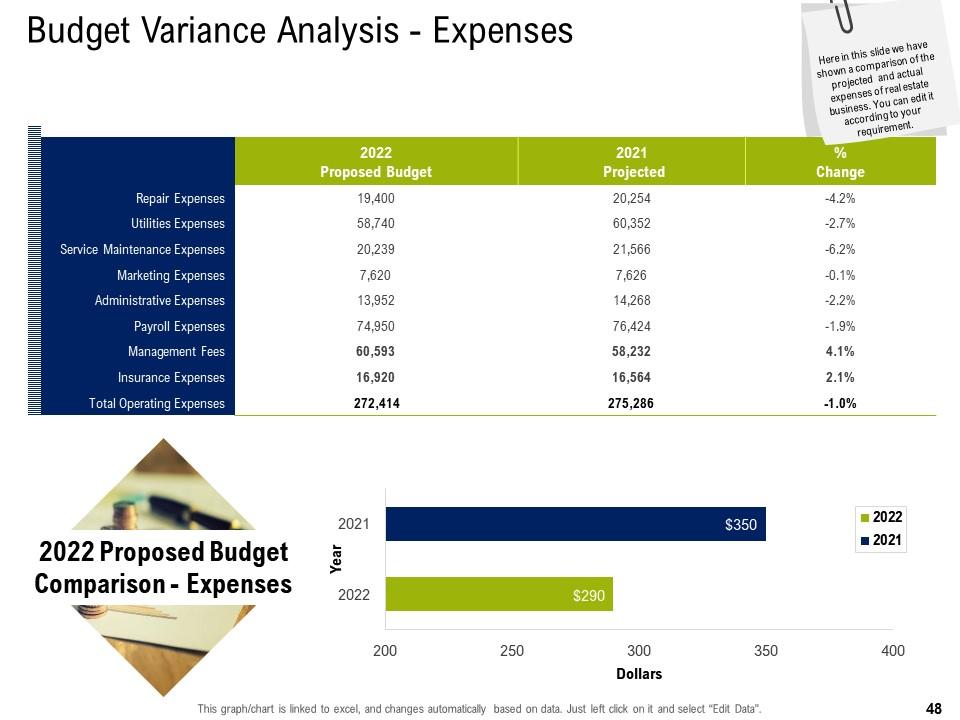
Slide 48: This slide shows a comparison of the projected and actual expenses of real estate business. You can edit it according to your requirement.
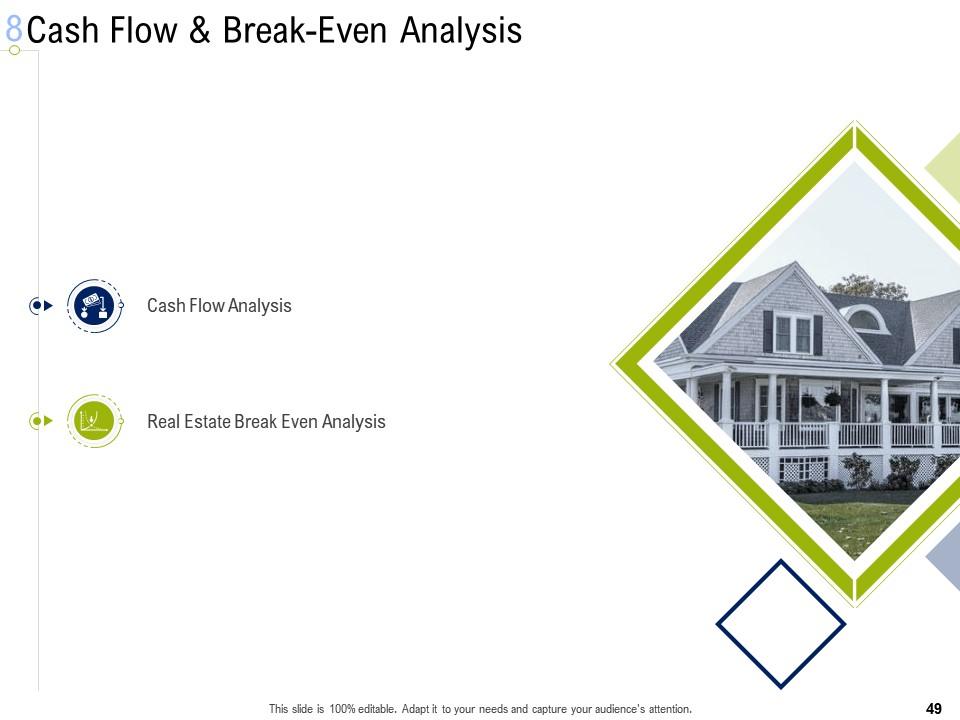
Slide 49: This slide presents Cash Flow & Break-Even Analysis.
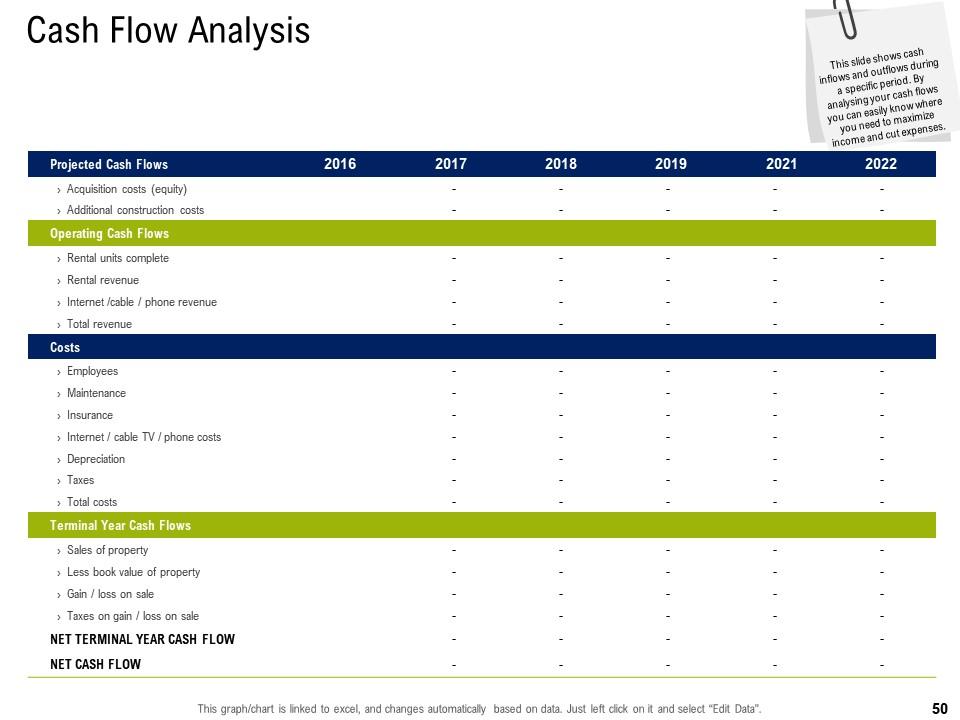
Slide 50: This slide shows cash inflows and outflows during a specific period. By analysing your cash flows you can easily know where you need to maximize income and cut expenses.
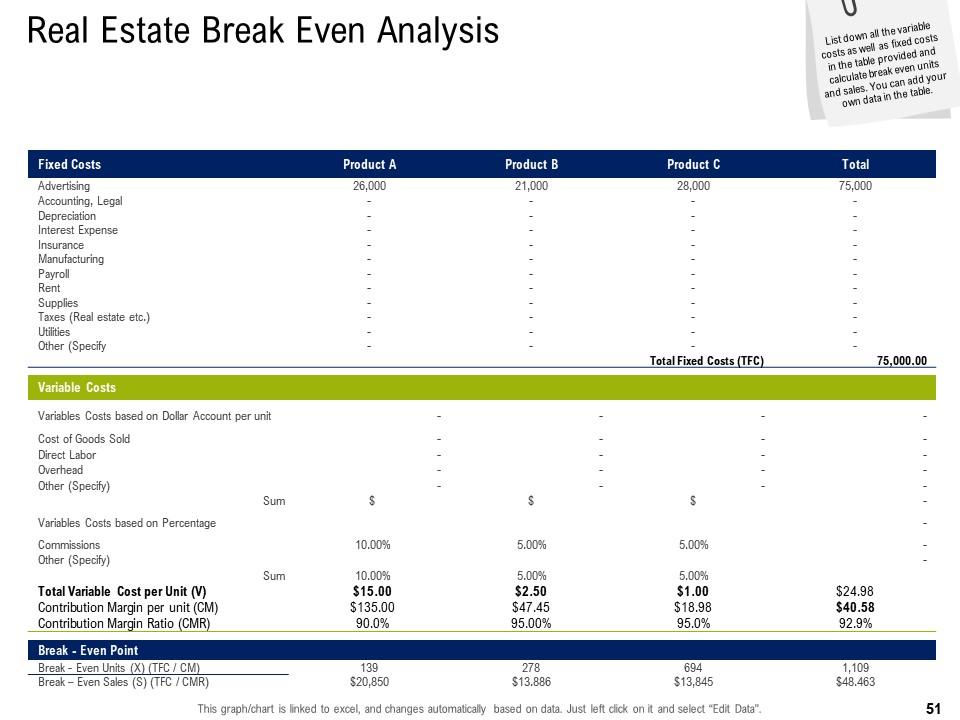
Slide 51: This slide presents all the variable costs as well as fixed costs in the table provided and calculate break even units and sales.
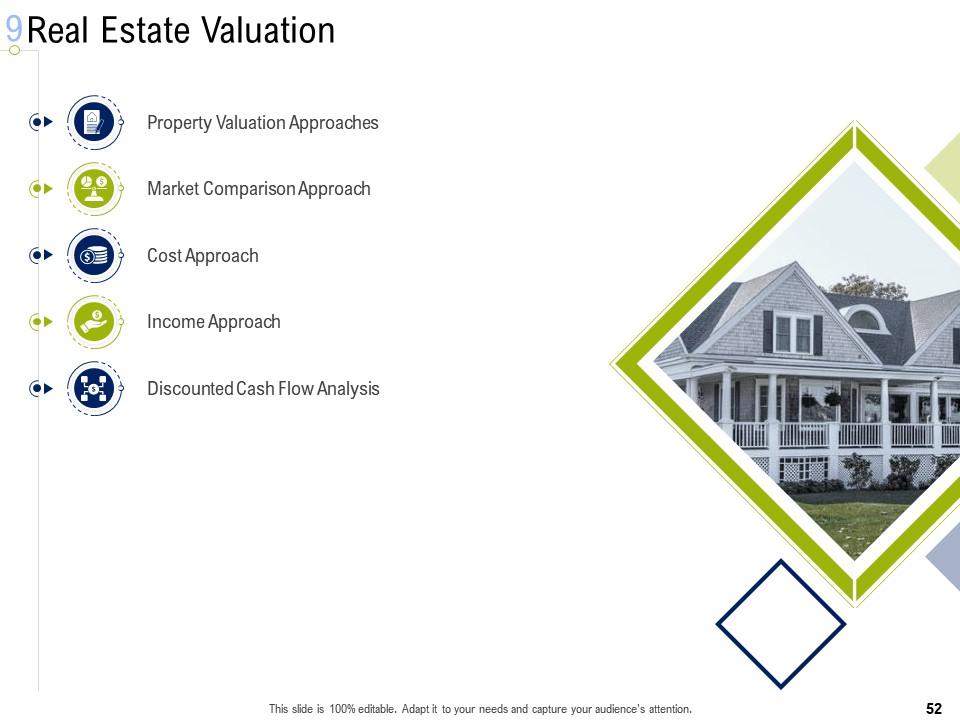
Slide 52: This slide presents Real Estate Valuation
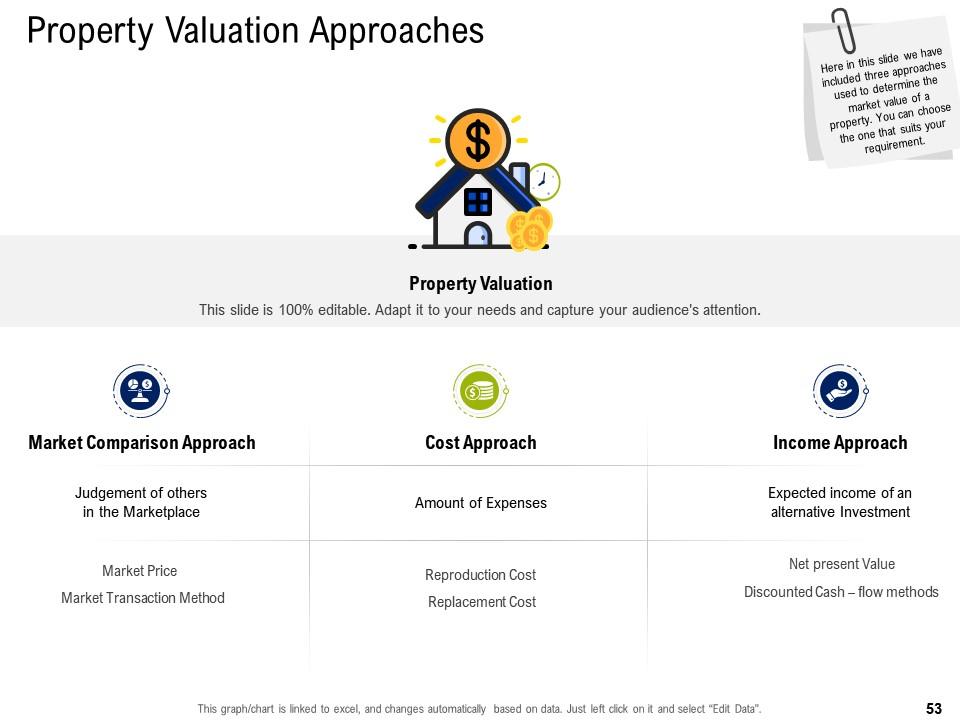
Slide 53: This slide shows three approaches used to determine the market value of a property. You can choose the one that suits your requirement.
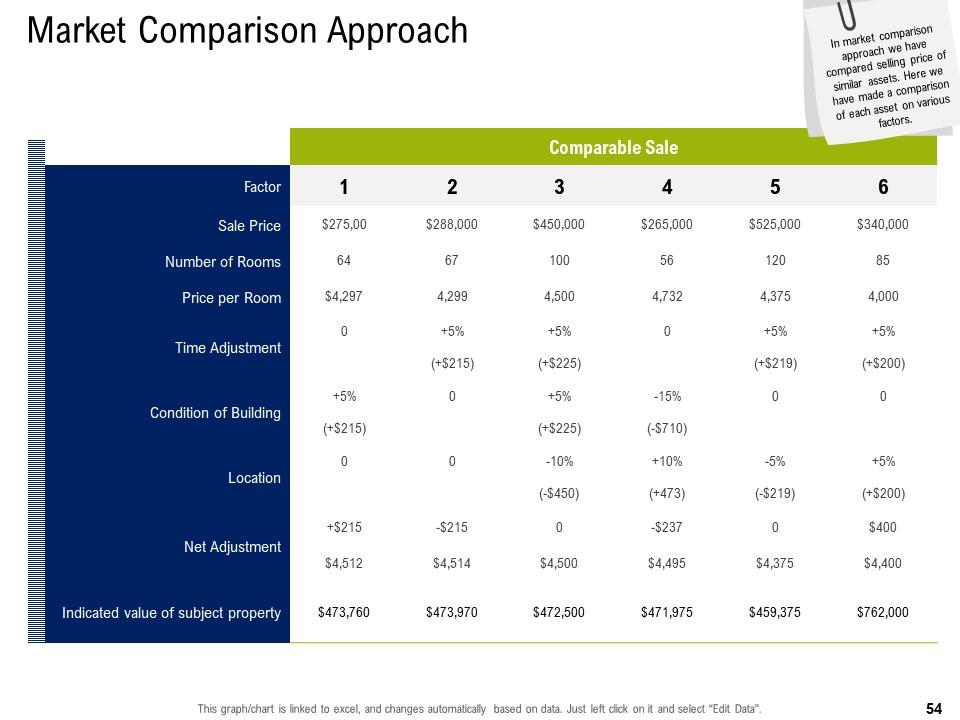
Slide 54: This slide presents Market Comparison Approach
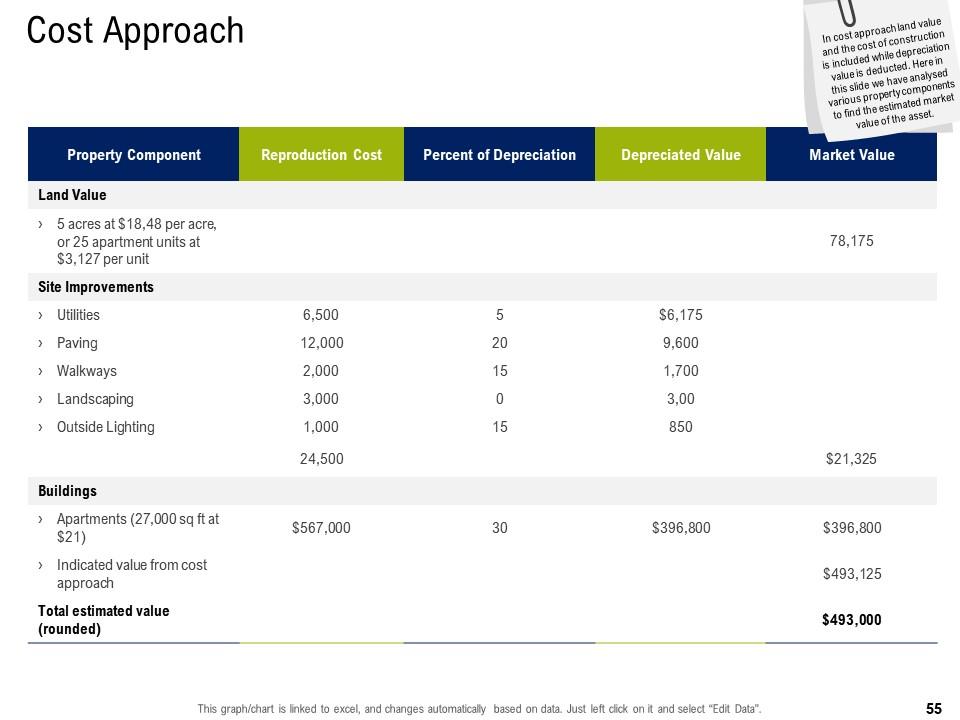
Slide 55: This slide presents Cost Comparison Approach.
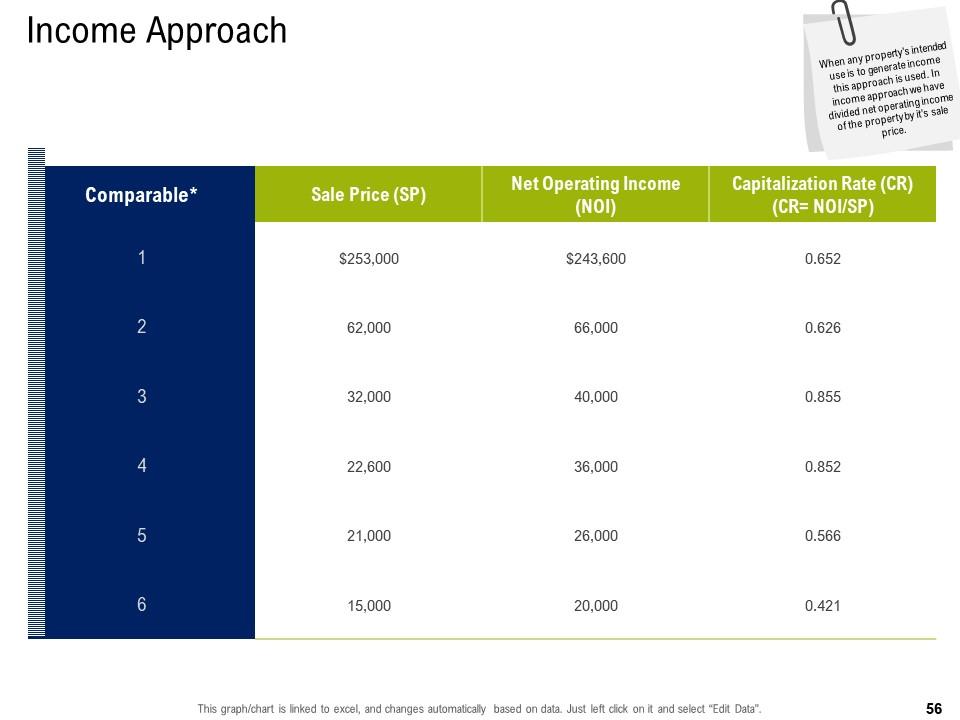
Slide 56: This slide present Income Comparison Approach.
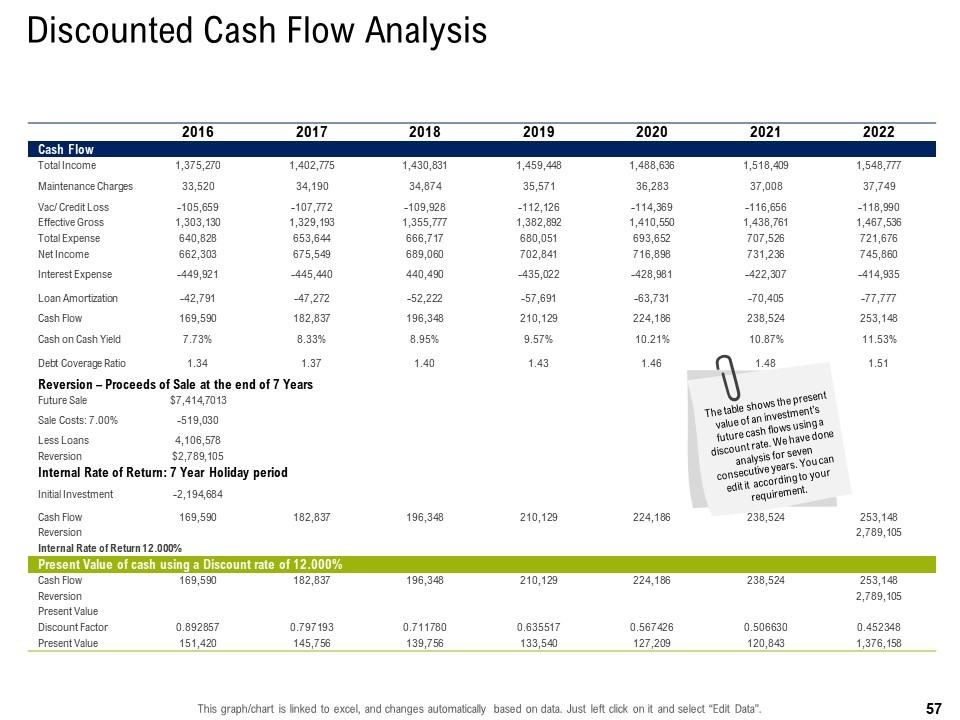
Slide 57: The table shows the present value of an investment’s future cash flows using a discount rate. We have done analysis for seven consecutive years. You can edit it according to your requirement.
Slide 58: This slide presents the Financial Analysis.
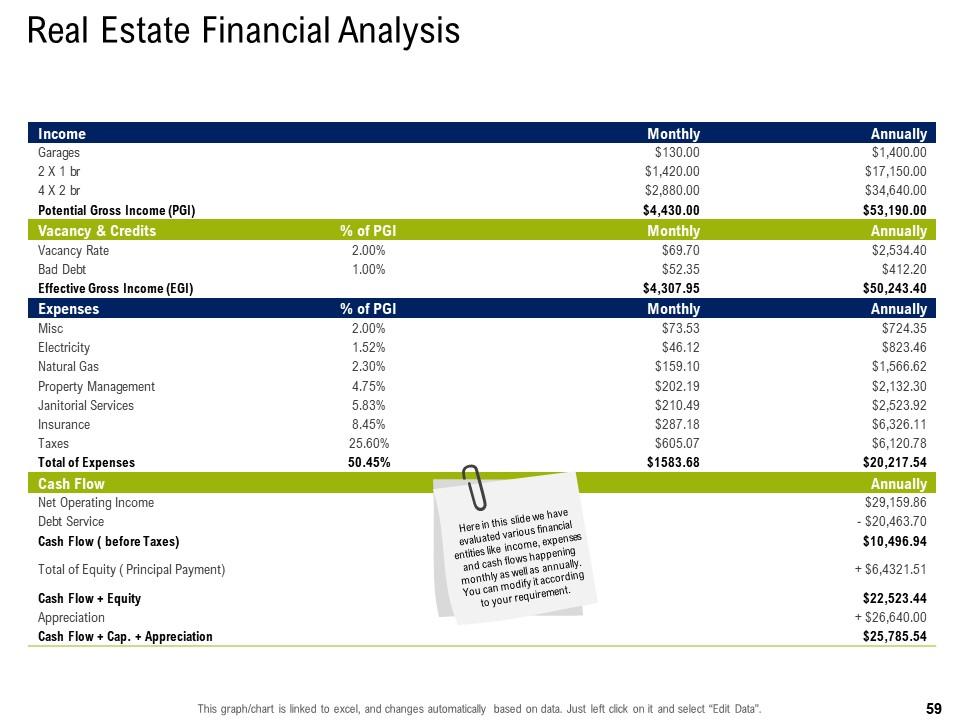
Slide 59: This slide we have evaluated various financial entities like income, expenses and cash flows happening monthly as well as annually. You can modify it according to your requirement.
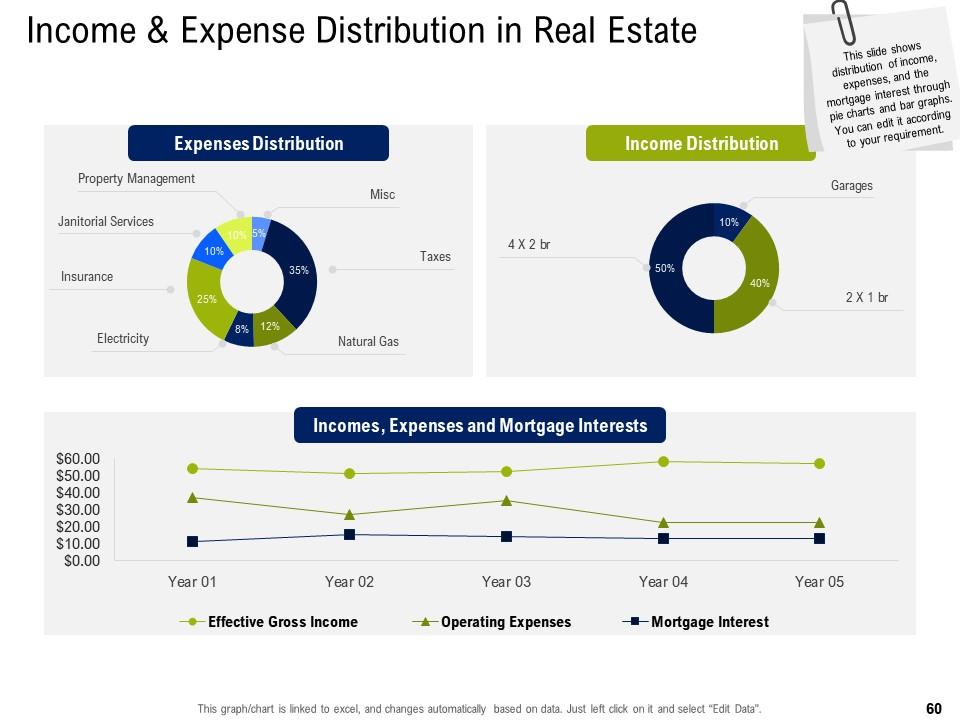
Slide 60: This slide shows distribution of income, expenses, and the mortgage interest through pie charts and bar graphs. You can edit it according to your requirement.
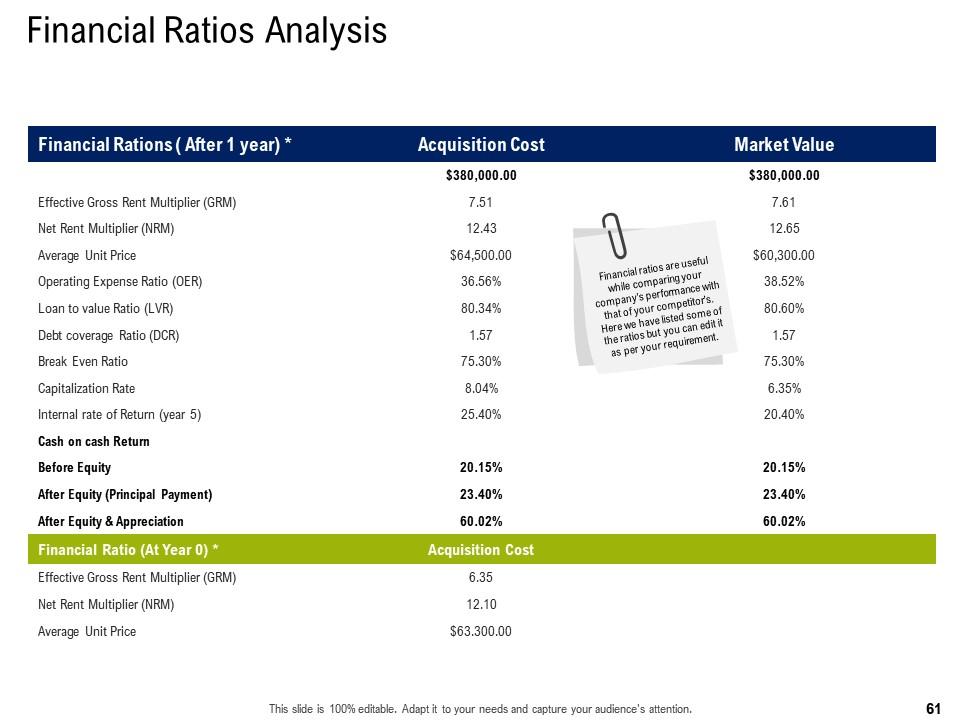
Slide 61: Financial ratios are useful while comparing your company’s performance with that of your competitor’s. Here we have listed some of the ratios but you can edit it as per your requirement.
Slide 62: This slide presents performance analysis.
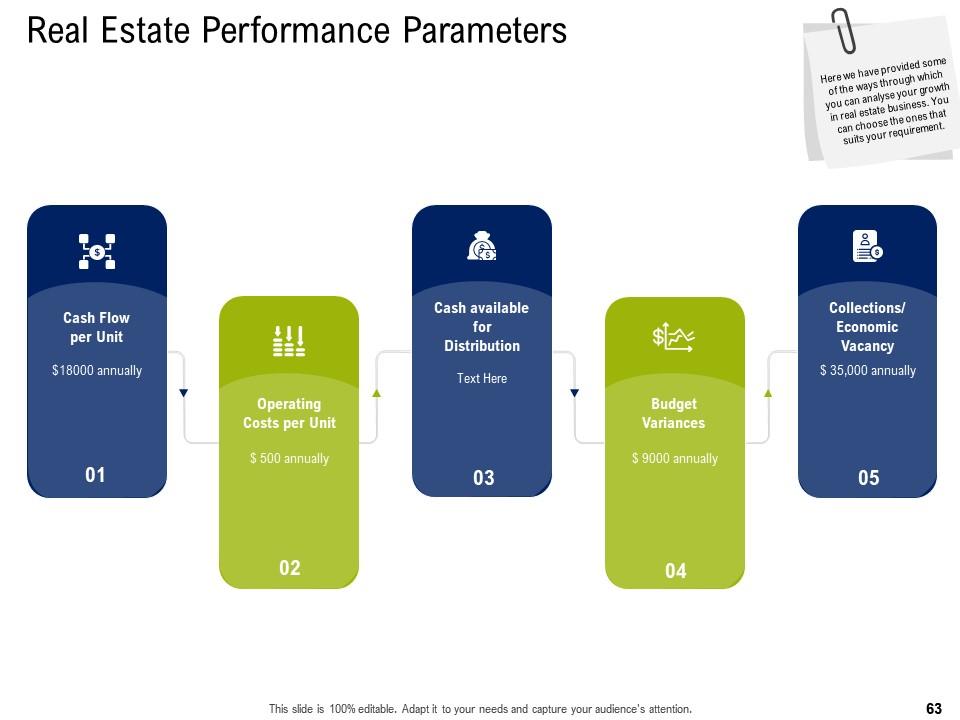
Slide 63: This slide presents some of the ways through which you can analyse your growth in real estate business. You can choose the ones that suits your requirement.
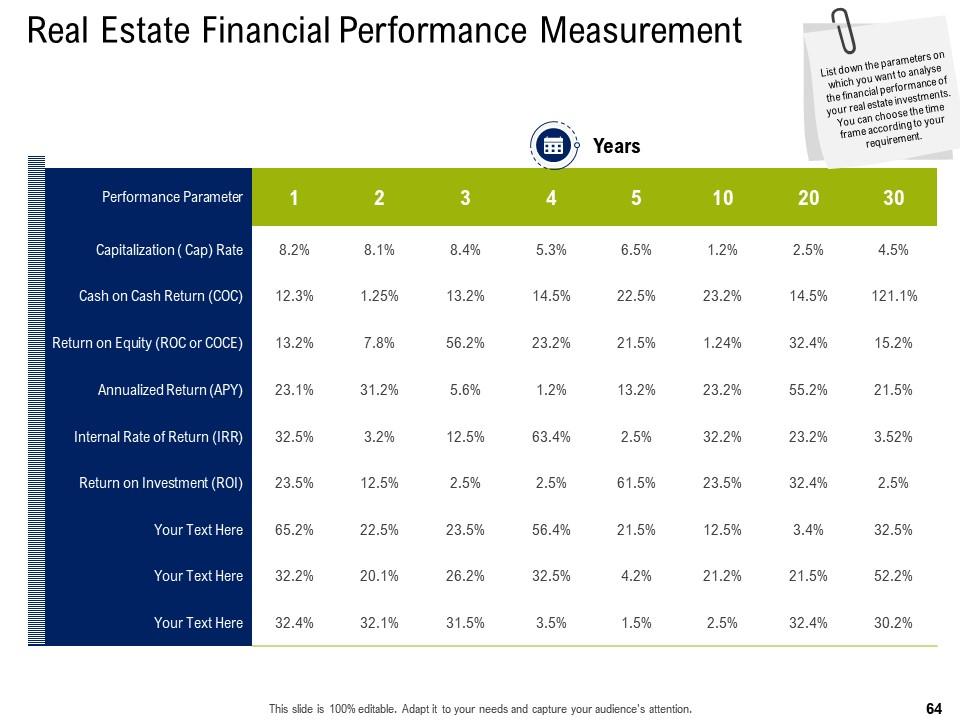
Slide 64: This slide Lists down the parameters on which you want to analyse the financial performance of your real estate investments. You can choose the time frame according to your requirement.
Slide 65: This is an Icon Slide. Use it as per your needs.
Slide 66: This is an Additional Slide.
Slide 67: This is an About Us slide that can be used to give a brief overview of the company.
Slide 68: This is Our Mission slide that can be used to state your mission and vision.
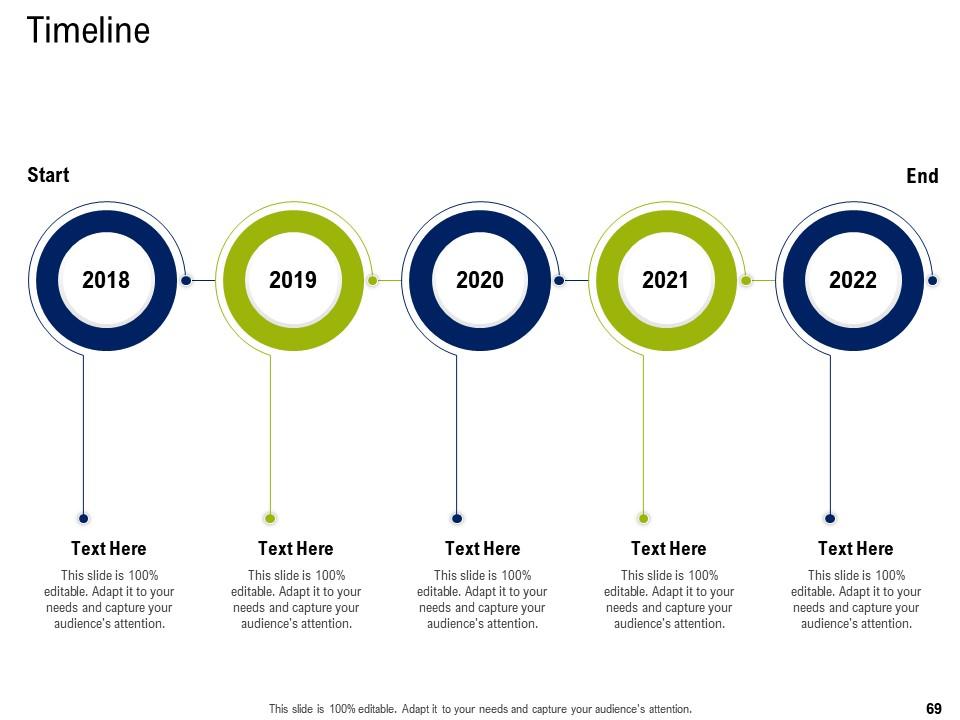
Slide 69: This is a Timeline slide that can be used to present the chronological sequence of events.
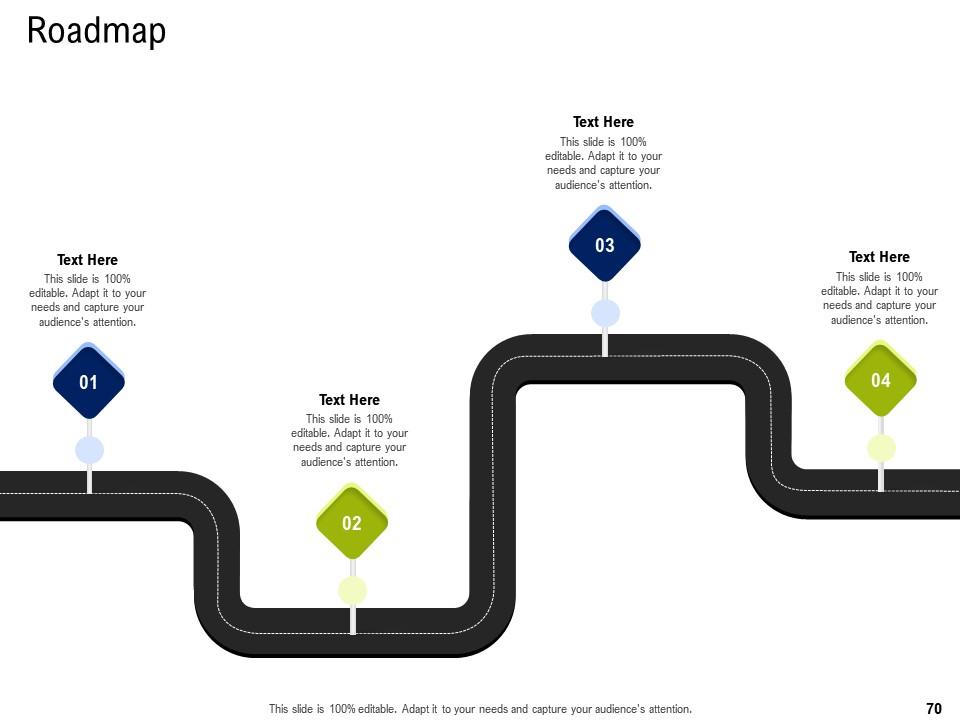
Slide 70: This is a Roadmap slide that can be used to present a series of events.
Slide 71: This is a 30 60 90 Days Plan slide that can be used to create robust plans.
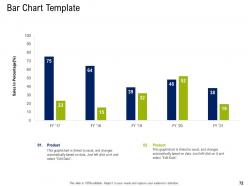
Slide 72: This is a Bar Chart Template slide that can be used to compare different products.
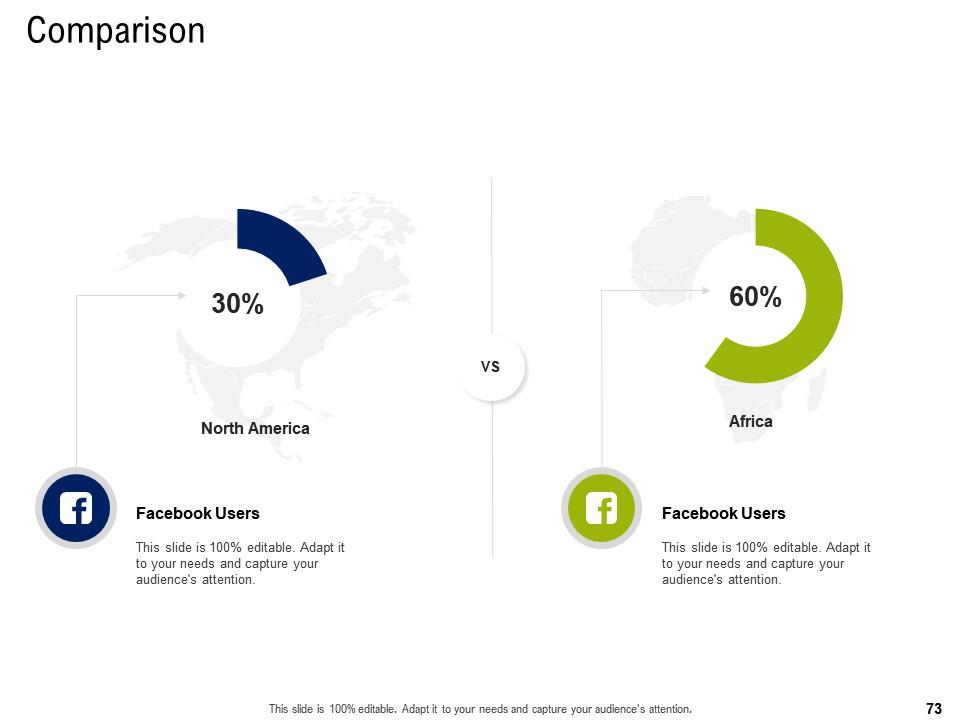
Slide 73: This is a Comparison slide that can be used to conduct a comparative analysis of different elements.
Slide 74: This is a Thankyou slide for acknowledgment. You can share your contact details here.
Commercial real estate property management powerpoint presentation slides with all 74 slides:
Use our Commercial Real Estate Property Management Powerpoint Presentation Slides to effectively help you save your valuable time. They are readymade to fit into any presentation structure.
-
Excellent products for quick understanding.
-
Great quality product.
-
Great quality product.
-
Amazing product with appealing content and design.


