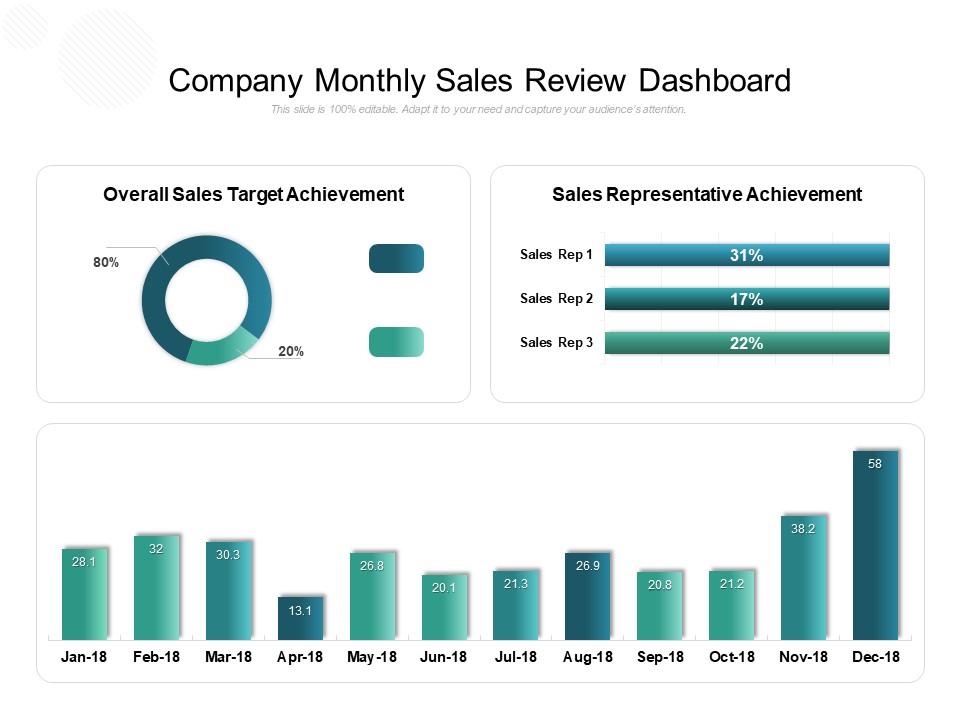
Company monthly sales review dashboard
Try Before you Buy Download Free Sample Product
Audience
Editable
of Time
Colour your thoughts in bright hues. Our Company Monthly Sales Review Dashboard will paint the picture.
People who downloaded this PowerPoint presentation also viewed the following :
Company monthly sales review dashboard with all 2 slides:
Drive the debate with our Company Monthly Sales Review Dashboard. Fix the attention of your audience on the issue.
FAQs for Company monthly
**INPUT**: What key metrics should be included in an effective sales dashboard? **OUTPUT**: Effective sales dashboards should include revenue performance, lead conversion rates, sales cycle length, pipeline value, individual rep performance, and customer acquisition costs. These metrics enable sales managers to streamline forecasting, enhance team productivity, and accelerate deal closure, with many organizations finding that comprehensive visibility ultimately delivers improved quota attainment and strategic revenue growth. **Word count: 54 words**
Visualization techniques enhance sales data understanding by transforming complex datasets into intuitive charts, graphs, heat maps, and interactive dashboards that reveal patterns and trends instantly. These visual tools enable sales teams to identify top-performing regions, track conversion rates, and spot seasonal fluctuations quickly, ultimately delivering faster decision-making and improved strategic planning across organizations.
Real-time data enables sales teams to identify trends, track performance metrics, and adjust strategies immediately, rather than waiting for monthly reports. Through instant visibility into pipeline changes, customer interactions, and conversion rates, organizations can respond quickly to opportunities, address bottlenecks proactively, and ultimately accelerate deal closures while maximizing revenue potential.
Sales dashboards should be customized by role-specific metrics, access levels, and functional priorities, with sales reps focusing on individual performance and pipeline management while managers need team analytics and forecasting capabilities. Through strategic customization, organizations streamline decision-making processes, enhance accountability across different sales functions, and ultimately deliver faster performance insights, with many sales teams finding that role-based dashboards significantly improve both individual productivity and overall team coordination.
**INPUT**: What are the best practices for choosing the right software for building a sales dashboard? **OUTPUT**: Best practices include evaluating integration capabilities with existing CRM systems, assessing real-time data processing speeds, ensuring mobile accessibility, and confirming customizable visualization options. These considerations streamline implementation by reducing technical barriers, enhancing user adoption, and delivering actionable insights, with many sales organizations finding that strategic software selection ultimately accelerates decision-making and drives revenue growth. **Word count: 56 words**
Sales dashboards integrate with CRM systems through API connections, real-time data synchronization, and automated reporting workflows, creating comprehensive analytics platforms. This strategic combination enables sales teams to track pipeline performance, customer engagement patterns, and revenue forecasting in unified interfaces, with many organizations finding that integrated systems deliver faster decision-making and improved sales outcomes.
Common sales dashboard pitfalls include overcrowding with excessive metrics, poor visual hierarchy, lacking real-time data integration, unclear KPI definitions, and ignoring user-specific needs. These design flaws often overwhelm sales teams with information overload, create confusion in decision-making, and ultimately reduce dashboard adoption rates, with many organizations finding that simplified, role-focused dashboards deliver significantly better user engagement and actionable insights.
Historical data analysis enhances sales dashboard forecasting by identifying seasonal patterns, customer behavior trends, and performance cycles that inform predictive models. Through advanced analytics, sales teams can anticipate market fluctuations, optimize resource allocation, and adjust strategies proactively, ultimately delivering more accurate revenue projections and competitive advantage in dynamic markets.
Effective sales visualizations include line charts for revenue trends, bar charts for performance comparisons, funnel charts for pipeline analysis, heat maps for territory performance, and pie charts for market share breakdown. These visual formats enable sales teams to quickly identify patterns, track quota attainment, and spot opportunities across regions, with many organizations finding that interactive dashboards combining multiple chart types deliver faster decision-making and improved forecasting accuracy.
Sales dashboards help identify trends and patterns by consolidating historical data, tracking key performance indicators, and providing visual analytics that reveal seasonal fluctuations, customer behavior shifts, and sales cycle variations. Through automated reporting and comparative analysis, sales teams can spot emerging opportunities, predict market changes, and adjust strategies proactively, ultimately delivering improved forecasting accuracy and competitive advantage.
Mobile-friendly sales dashboards provide real-time access to performance metrics, lead tracking, customer data, pipeline visibility, and territory management from anywhere. These mobile platforms enhance productivity by enabling instant client updates, faster decision-making, and seamless field-to-office communication, with many sales organizations finding that mobile accessibility increases closing rates and reduces response times significantly.
User feedback improves sales dashboard effectiveness by identifying missing metrics, highlighting usability issues, and revealing workflow gaps that hinder adoption. Through regular feedback collection, organizations can optimize data visualization, streamline navigation, and enhance mobile functionality, with many sales teams finding that user-driven dashboard iterations significantly increase daily usage and ultimately deliver better forecasting accuracy.
**INPUT**: What security measures should be considered when sharing sales dashboard insights? **OUTPUT**: Essential security measures include role-based access controls, data encryption, user authentication protocols, audit trails, and secure sharing permissions that limit dashboard visibility to authorized personnel. These safeguards enable organizations to maintain data integrity while facilitating collaboration, with many financial services and healthcare companies finding that layered security approaches ultimately deliver competitive intelligence sharing without compromising sensitive customer information.
Sales dashboards motivate individual performance by providing real-time visibility into personal metrics, goal progress, gamified leaderboards, and achievement recognition systems. Through interactive visualizations and automated alerts, sales professionals can track quotas, conversion rates, and pipeline health while receiving instant feedback, ultimately driving accountability and competitive spirit that enhances overall team productivity.
Automation significantly enhances sales dashboard efficiency by streamlining data collection, eliminating manual entry errors, and providing real-time performance insights across multiple channels and metrics. Through automated integration, sales teams can track lead conversions, monitor pipeline velocity, and generate actionable reports instantly, ultimately delivering faster decision-making and improved revenue outcomes.
No Reviews