Comparison of share prices with stock market chart
Our Comparison Of Share Prices With Stock Market Chart are topically designed to provide an attractive backdrop to any subject. Use them to look like a presentation pro.
- Google Slides is a new FREE Presentation software from Google.
- All our content is 100% compatible with Google Slides.
- Just download our designs, and upload them to Google Slides and they will work automatically.
- Amaze your audience with SlideTeam and Google Slides.
-
Want Changes to This PPT Slide? Check out our Presentation Design Services
- WideScreen Aspect ratio is becoming a very popular format. When you download this product, the downloaded ZIP will contain this product in both standard and widescreen format.
-

- Some older products that we have may only be in standard format, but they can easily be converted to widescreen.
- To do this, please open the SlideTeam product in Powerpoint, and go to
- Design ( On the top bar) -> Page Setup -> and select "On-screen Show (16:9)” in the drop down for "Slides Sized for".
- The slide or theme will change to widescreen, and all graphics will adjust automatically. You can similarly convert our content to any other desired screen aspect ratio.
Compatible With Google Slides

Get This In WideScreen
You must be logged in to download this presentation.
PowerPoint presentation slides
Presenting this set of slides with name Comparison Of Share Prices With Stock Market Chart. The topics discussed in these slides are Percentage, Price, Stock. This is a completely editable PowerPoint presentation and is available for immediate download. Download now and impress your audience.
People who downloaded this PowerPoint presentation also viewed the following :
Content of this Powerpoint Presentation
Description:
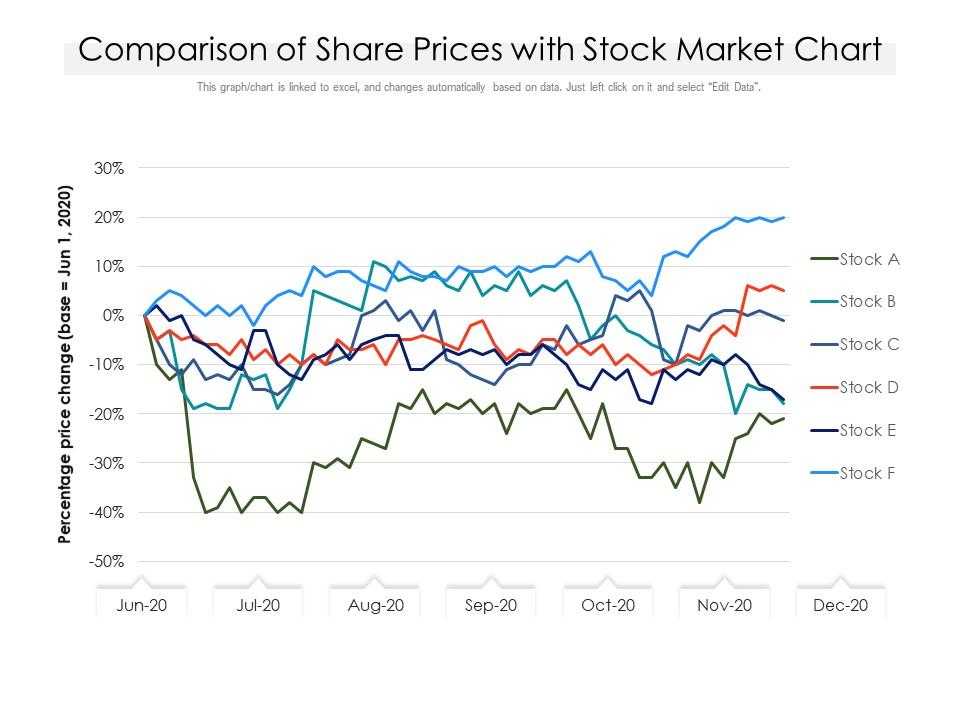
The image presented is a line graph titled "Comparison of Share Prices with Stock Market Chart," which indicates the performance of six different stocks (Stock A to Stock F) over a six-month period from June 2020 to December 2020. The vertical axis represents the percentage price change from the base (June 1, 2020), ranging from -50% to +30%, and the horizontal axis reflects the time progression in months.
Each line on the graph corresponds to a different stock, using distinct colors for differentiation. The note below the title states that this chart is linked to an Excel spreadsheet and updates automatically based on data. The user can edit the data by clicking on the chart and selecting "Edit Data."
Use Cases:
Below are seven industries where such slides can be utilized, along with their uses, potential presenters, and the intended audience:
1. Finance:
Use: Tracking and comparing stock performance.
Presenter: Financial Analyst.
Audience: Investors and Portfolio Managers.
2. Education:
Use: Teaching students about stock market trends.
Presenter: Economics Professor.
Audience: Business and Finance Students.
3. Business Intelligence:
Use: Presenting market analysis to inform strategic decisions.
Presenter: BI Consultant.
Audience: Senior Management and Decision-makers.
4. Investment Banking:
Use: Showcasing investment opportunities to clients.
Presenter: Investment Banker.
Audience: High-net-worth Clients and Institutional Investors.
5. Market Research:
Use: Illustrating industry trends and company standings.
Presenter: Market Research Analyst.
Audience: Marketing Professionals and Brand Managers.
6. Corporate Finance:
Use: Reporting corporate stock performance to stakeholders.
Presenter: CFO or Financial Manager.
Audience: Board Members and Shareholders.
7. Financial Journalism:
Use: Explaining stock market dynamics to the public.
Presenter: Financial Journalist.
Audience: General Public or Audience of a Business News Outlet.
Comparison of share prices with stock market chart with all 2 slides:
Use our Comparison Of Share Prices With Stock Market Chart to effectively help you save your valuable time. They are readymade to fit into any presentation structure.
-
Very well designed and informative templates.
-
Excellent Designs.
-
Good research work and creative work done on every template.
-
Great quality product.
-
Great quality slides in rapid time.


