Competitive Intelligence Analysis And Strategy Powerpoint Presentation Slides
Businesses need to bring better schemes than their competitors otherwise, they will not survive in the market. For this, SlideTeam presents competitive intelligence analysis and strategy PowerPoint presentation slides which help you to identify the techniques to beat the competition. This content ready competitor analysis presentation PPT covers important topics like industry analysis, market opportunity, market trends, target market, business profitability, industry cost structure, distribution channel, competitor overview, competitor market strategy, swot analysis of competitors etc. Our pre-designed customized competitive matrix presentation PPT can also be related to market intelligence, competitor matrix, strategic intelligence, organizational intelligence, competitive advantage, business model and many more. Download this professionally designed competitive intelligence analysis and strategy presentation graphics and leave your competitor’s behind. Ideas begin to jell due to our Competitive Intelligence Analysis And Strategy Powerpoint Presentation Slides. A definite form is bound to emerge.
- Google Slides is a new FREE Presentation software from Google.
- All our content is 100% compatible with Google Slides.
- Just download our designs, and upload them to Google Slides and they will work automatically.
- Amaze your audience with SlideTeam and Google Slides.
-
Want Changes to This PPT Slide? Check out our Presentation Design Services
- WideScreen Aspect ratio is becoming a very popular format. When you download this product, the downloaded ZIP will contain this product in both standard and widescreen format.
-

- Some older products that we have may only be in standard format, but they can easily be converted to widescreen.
- To do this, please open the SlideTeam product in Powerpoint, and go to
- Design ( On the top bar) -> Page Setup -> and select "On-screen Show (16:9)” in the drop down for "Slides Sized for".
- The slide or theme will change to widescreen, and all graphics will adjust automatically. You can similarly convert our content to any other desired screen aspect ratio.
Compatible With Google Slides

Get This In WideScreen
You must be logged in to download this presentation.
PowerPoint presentation slides
These presentation slides are 100% editable. Quickly downloadable slides. These templates consist of 52 slides. High-resolution template designs. These slides are totally risk-free. Compatible presentation layout. Our PPT graphics can be easily converted to PDF and JPG formats. These slides can be shown in standard and widescreen.The stages in this process are competitive intelligence analysis and strategy, branding strategy, positioning, strategy, distribution strategy, promotion strategy, marketing plan, marketing management.
People who downloaded this PowerPoint presentation also viewed the following :
Content of this Powerpoint Presentation
Slide 1: This slide introduces Competitive Intelligence Analysis and Strategy. State Company Name and begin.
Slide 2: This is an Agenda slide. Showcase your agendas here.
Slide 3: This slide is titled Market Analysis to move forward.
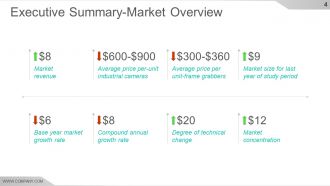
Slide 4: This slide showcases Executive Summary- Market Overview displaying- Market concentration, Market size for last year of study period, Base year market growth rate, Market revenue, Compound annual growth rate, Customer price sensitivity, Average price per unit-frame grabbers, Degree of technical change.
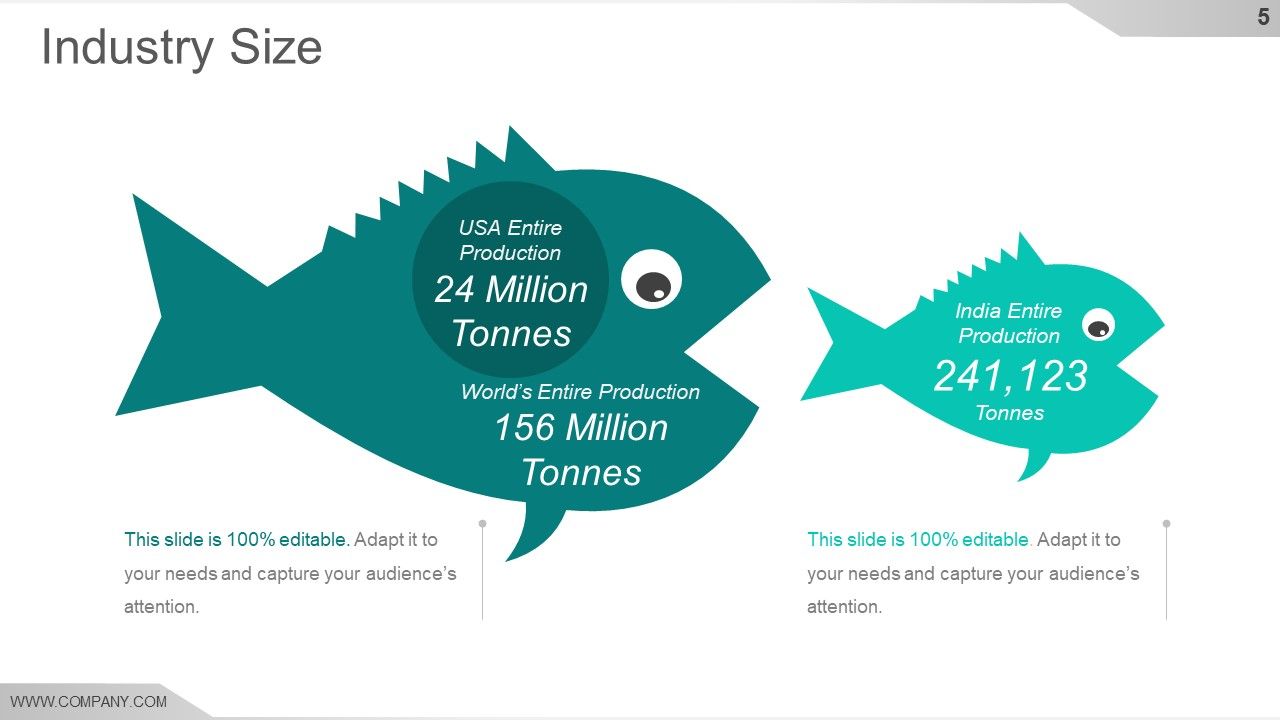
Slide 5: This slide showcases Industry Size with creative fish imagery. Show industry size in terms of market share, productivity etc. here.
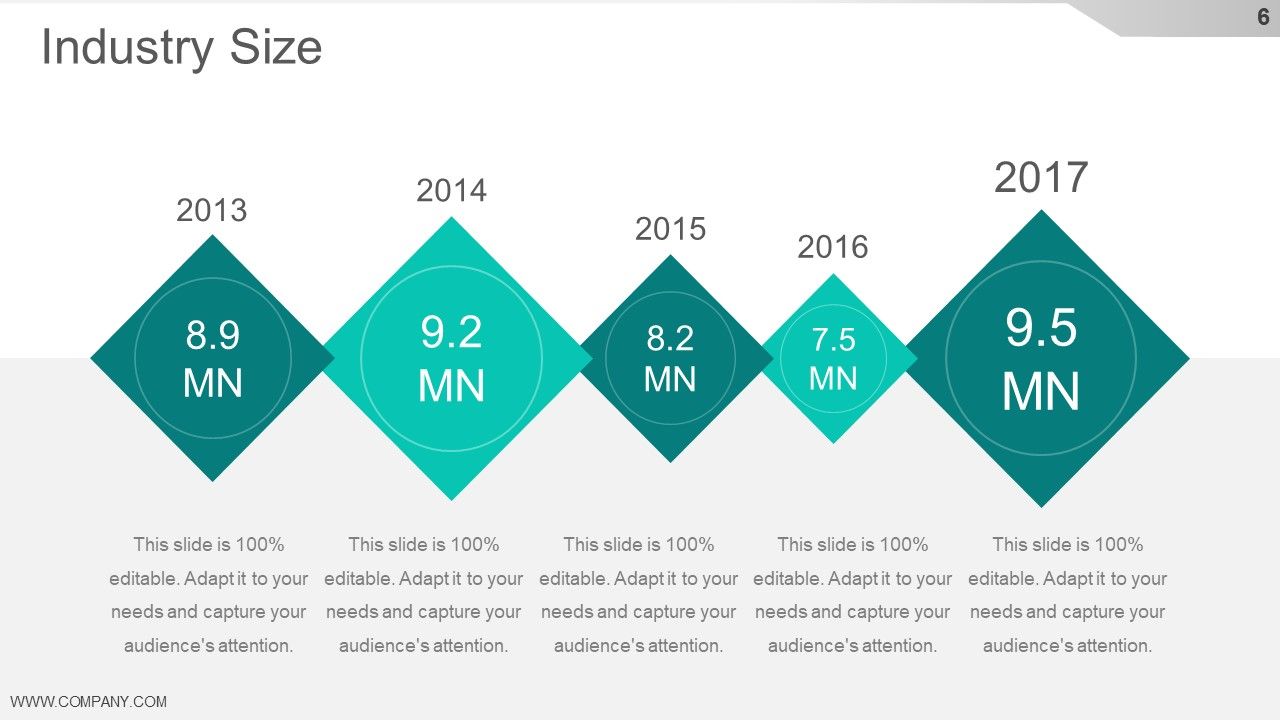
Slide 6: This slide showcases Industry Size in timeline form.
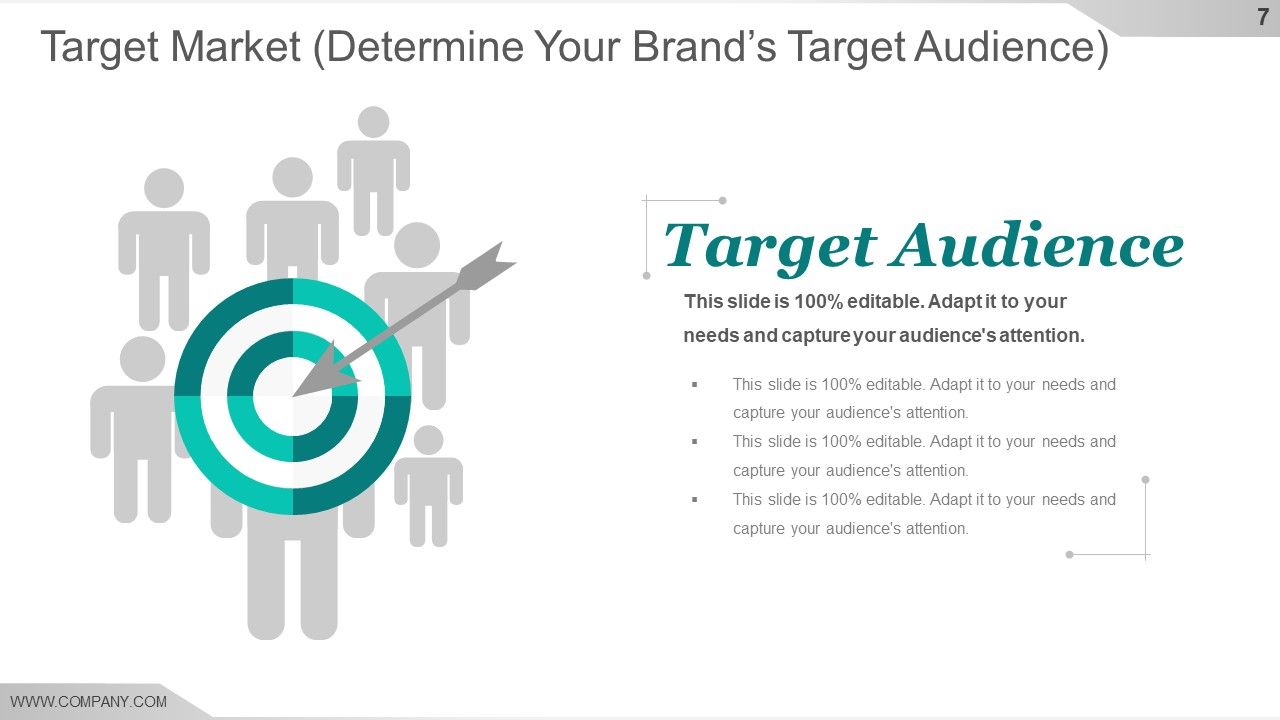
Slide 7: This slide shows Target Market (Determine Your Brand’s Target Audience).
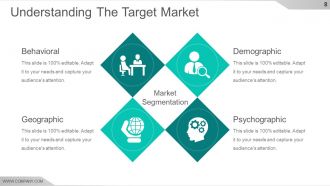
Slide 8: This slide showcases Understanding The Target Market categorized into- Behavioral, Geographic, Psychographic, and Demographic factors.
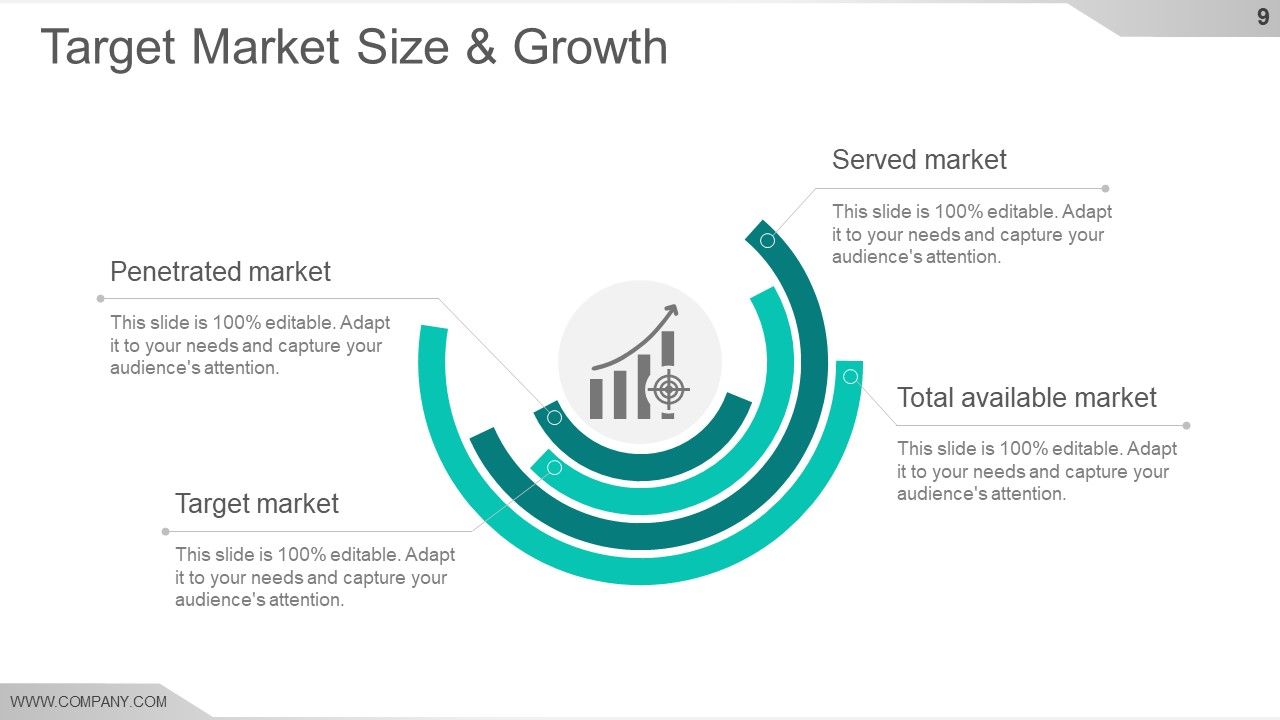
Slide 9: This slide showcases Target Market Size & Growth showing- Served market, Total available market, Target market.
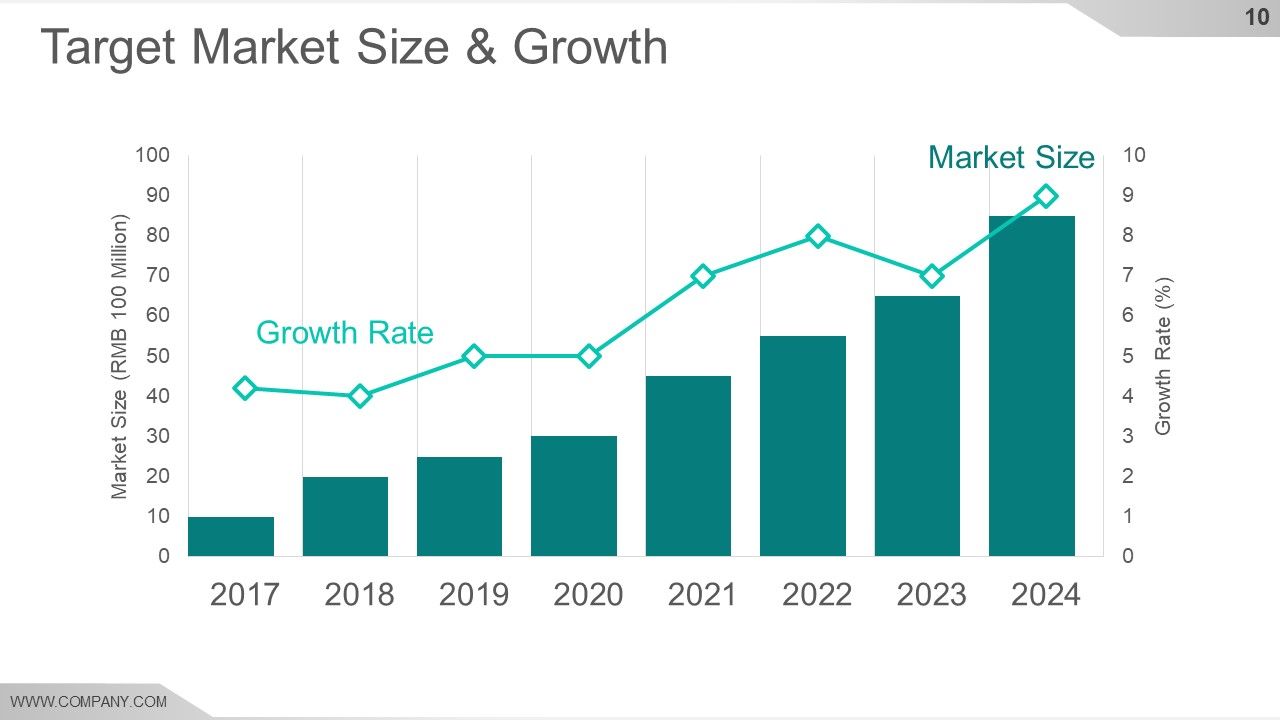
Slide 10: This slide presents Target Market Size & Growth in graph form displaying- Market Size and Growth Rate.
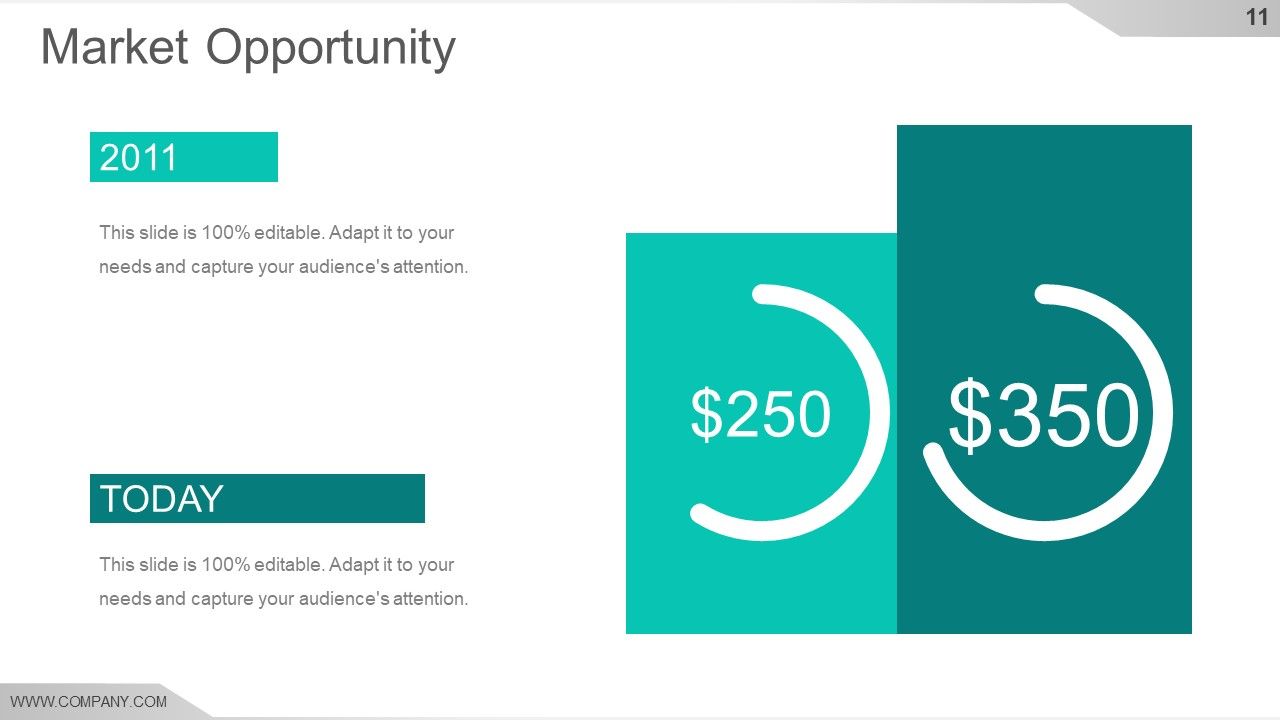
Slide 11: This slide showcases Market Opportunity. State relative facts, statistics etc. here.
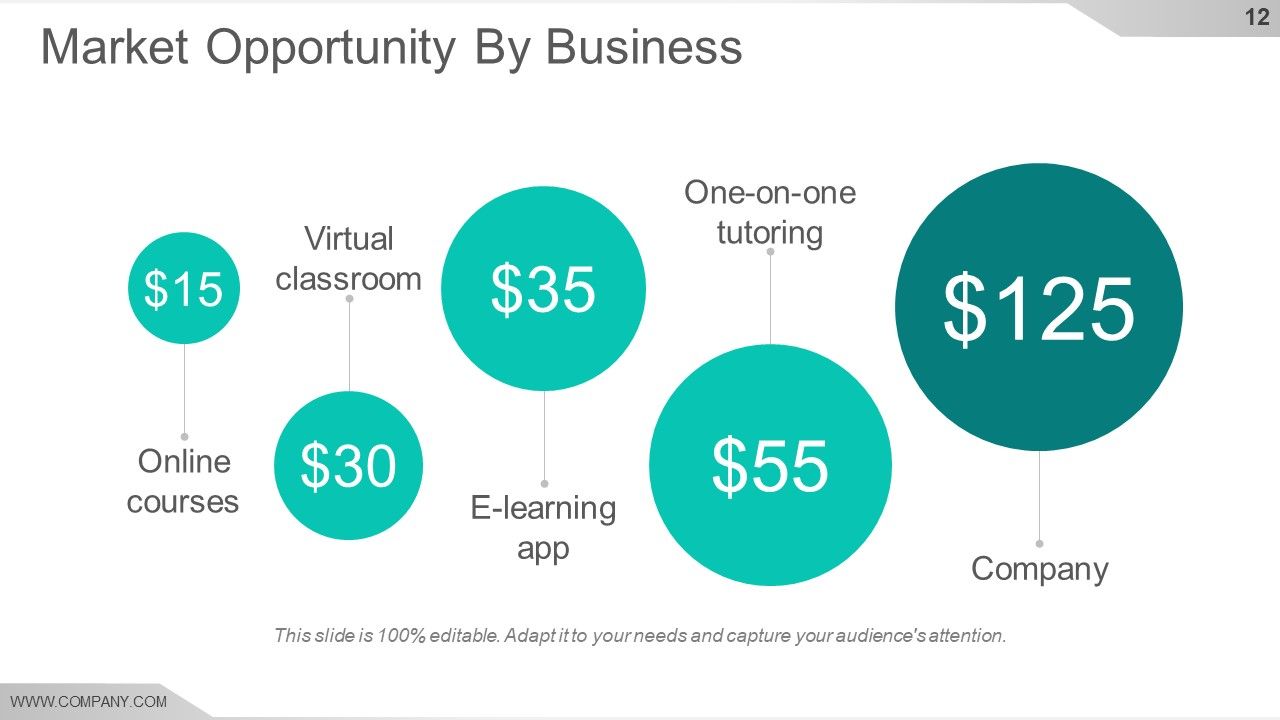
Slide 12: This slide showcases Market Opportunity By Business displaying- Online Courses, Virtual Classroom, E-learning App, One-on-one Tutoring, Company as factors to present.
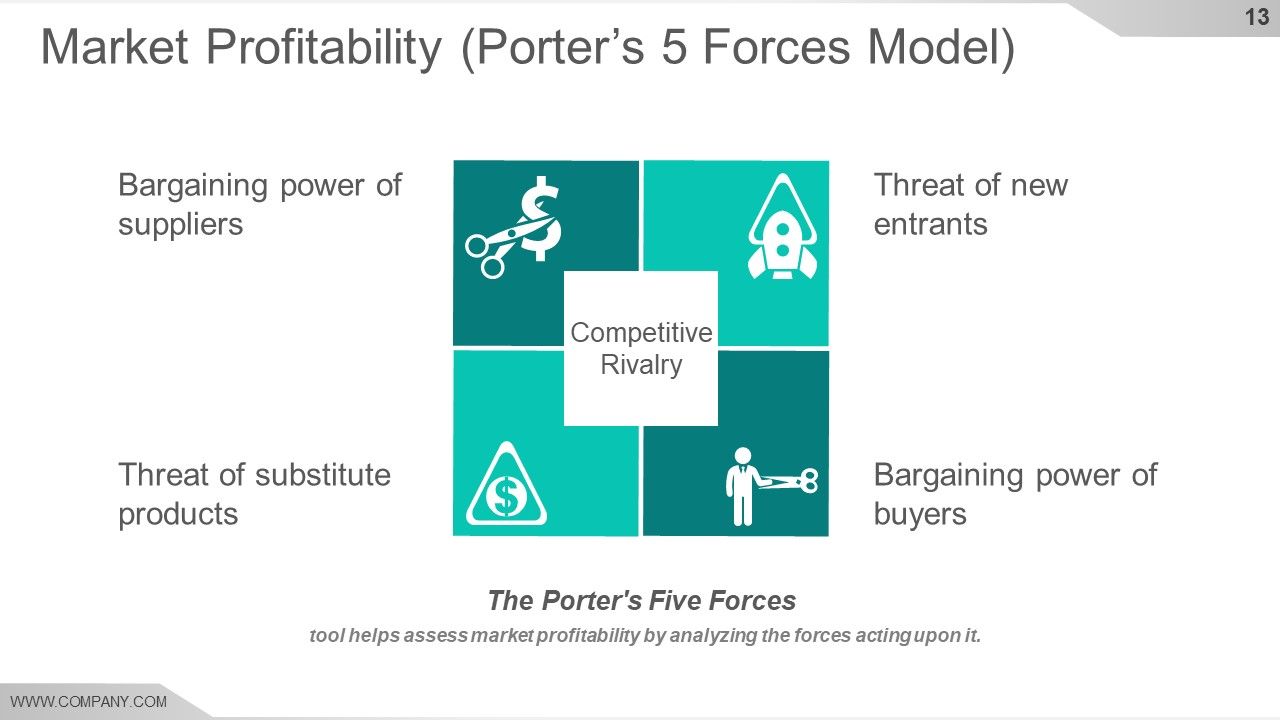
Slide 13: This slide shows Market Profitability (Porter’s 4 Forces Model) displaying- Bargaining power of buyers, Threat of new entrants, Threat of substitute products, Bargaining power of suppliers, Competitive Rivalry. The Porter's Five Forces tool helps assess market profitability by analysing the forces acting upon it.
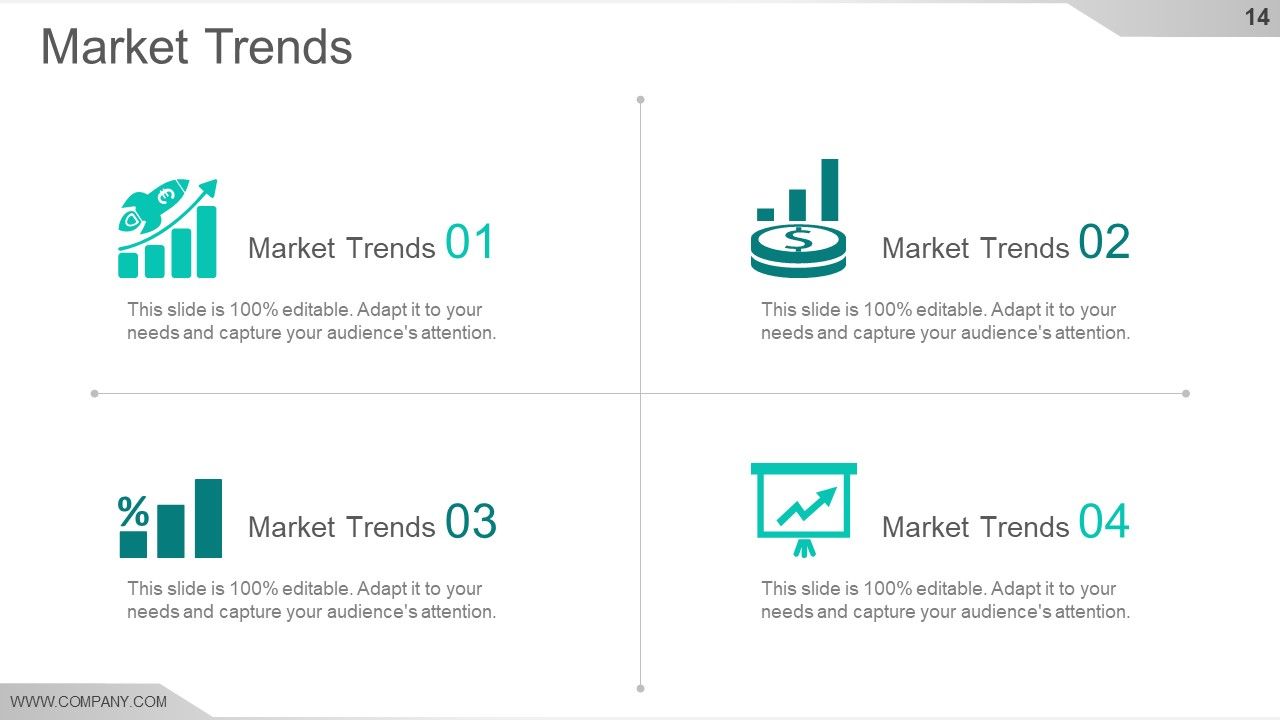
Slide 14: This slide shows Market Trends to be shown.
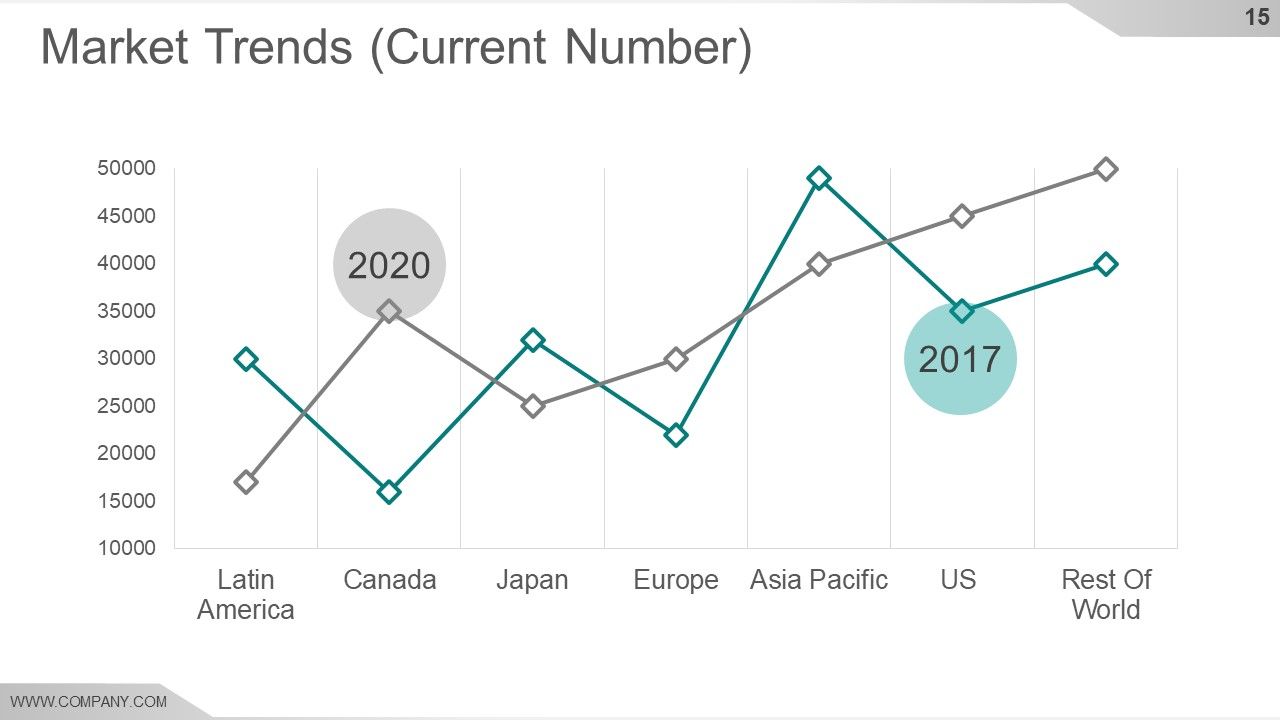
Slide 15: This slide showcases Market Trends (Current Number) in graph form.
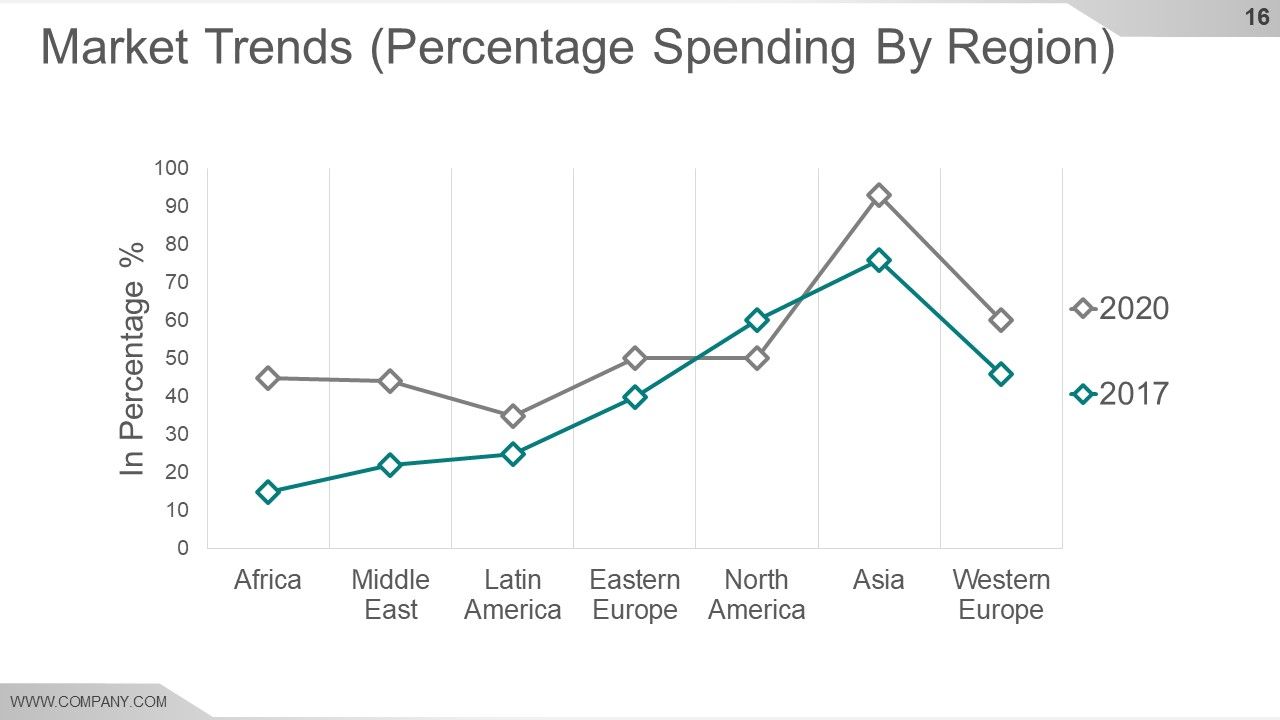
Slide 16: This slide shows Market Trends (Percentage Spending By Region) in bar graph form.
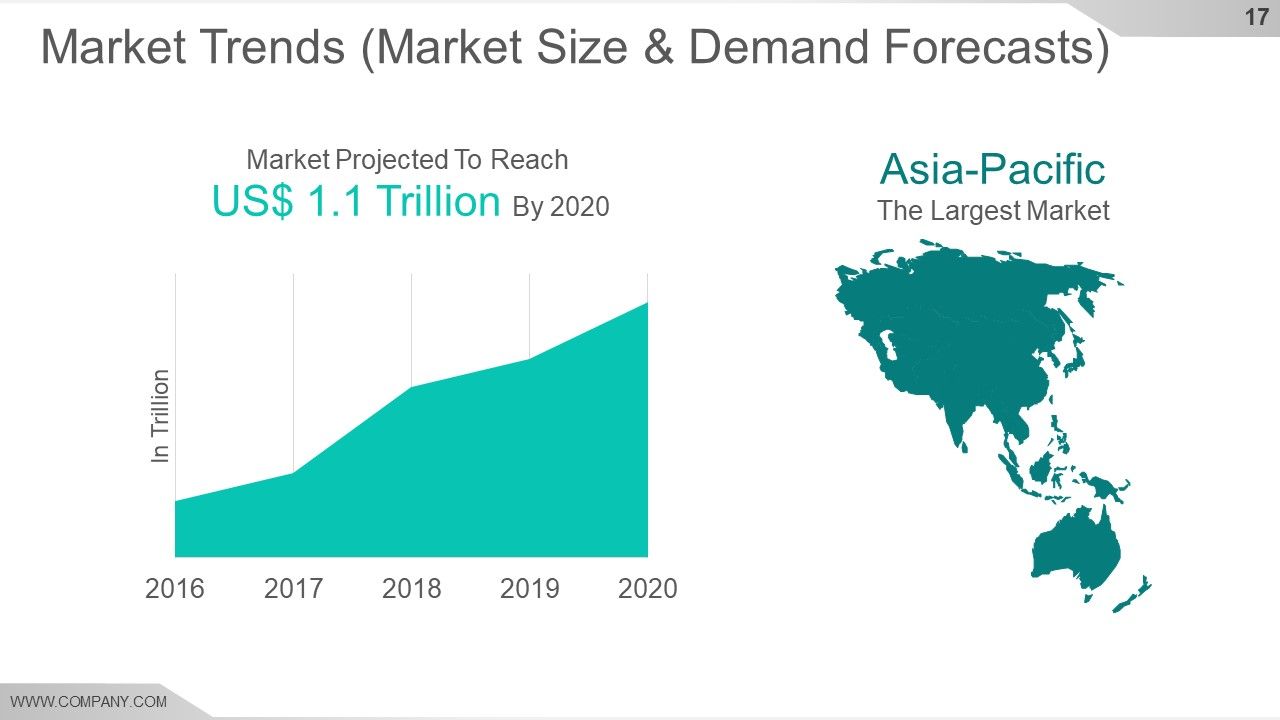
Slide 17: This slide presents Market Trends (Market Size & Demand Forecasts) in graph form with asia pacific map image.
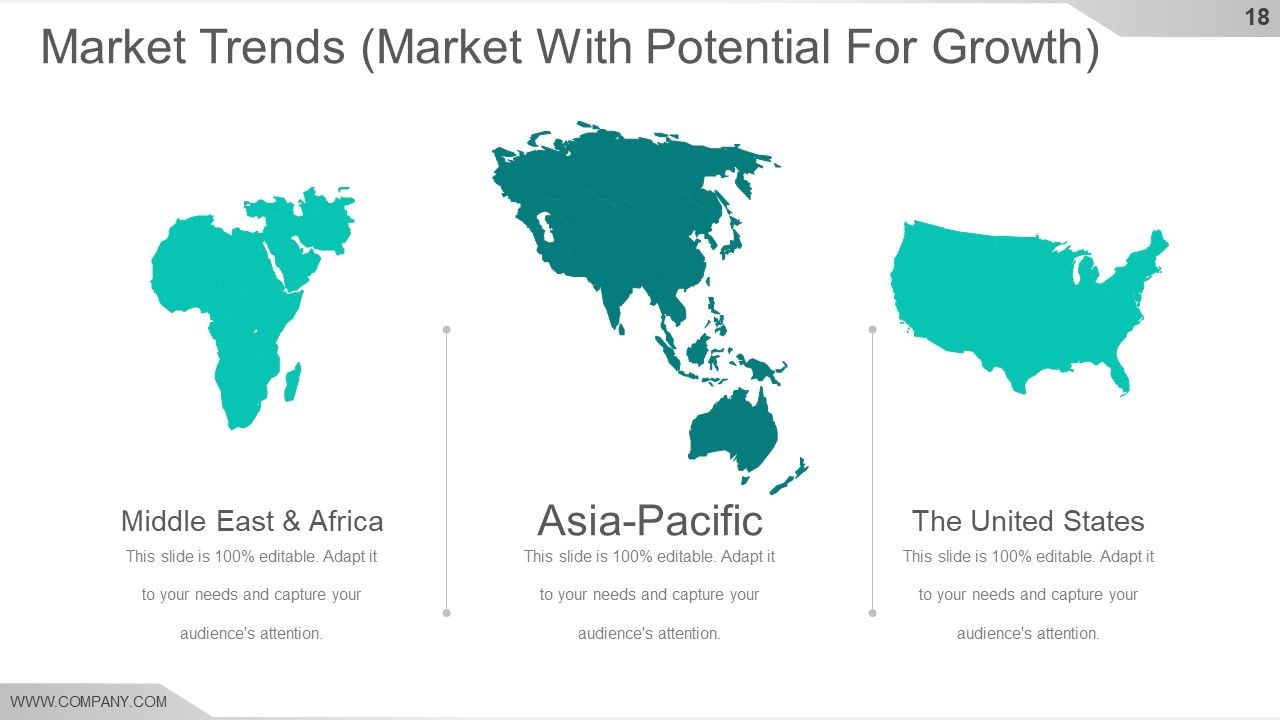
Slide 18: This slide presents Market Trends (Markets With Potential For Growth) showing- Middle East & Africa Asia-Pacific The United States map images to state geographical facts.
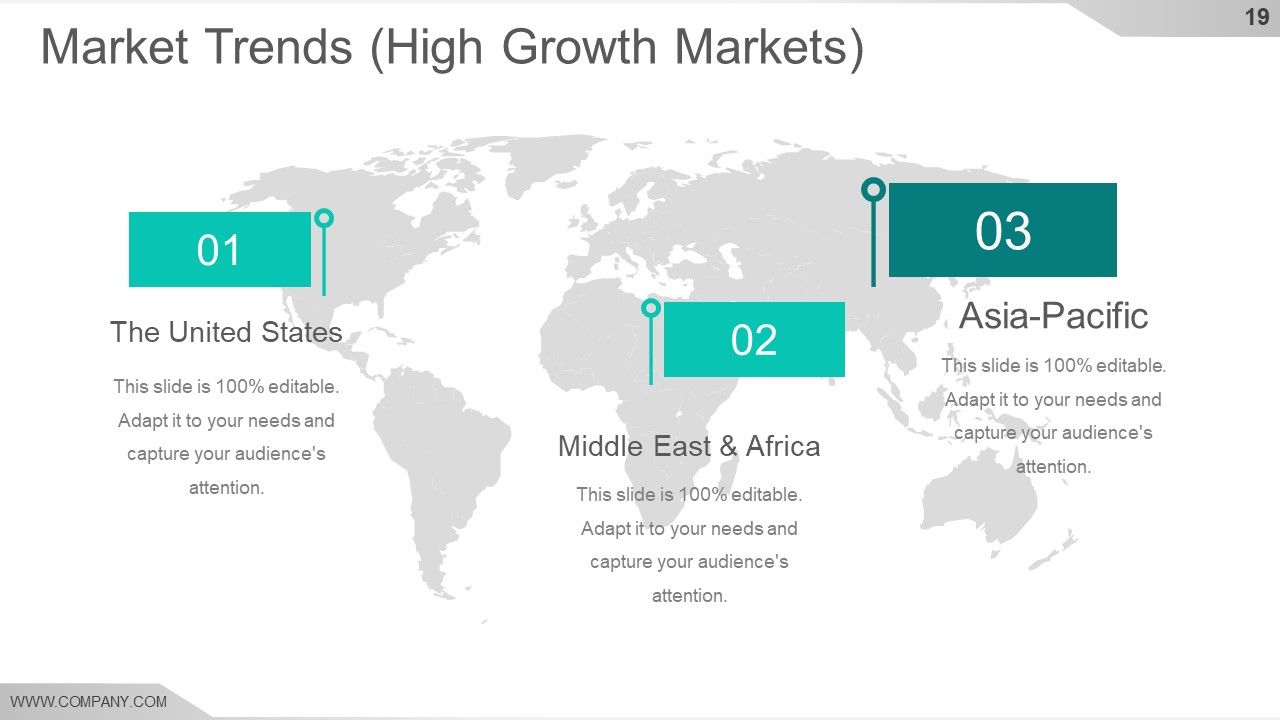
Slide 19: This slide presents Market Trends (High Growth Markets) with world map image.
Slide 20: This slide showcases Market Trends (Key Market Drivers) to be displayed.
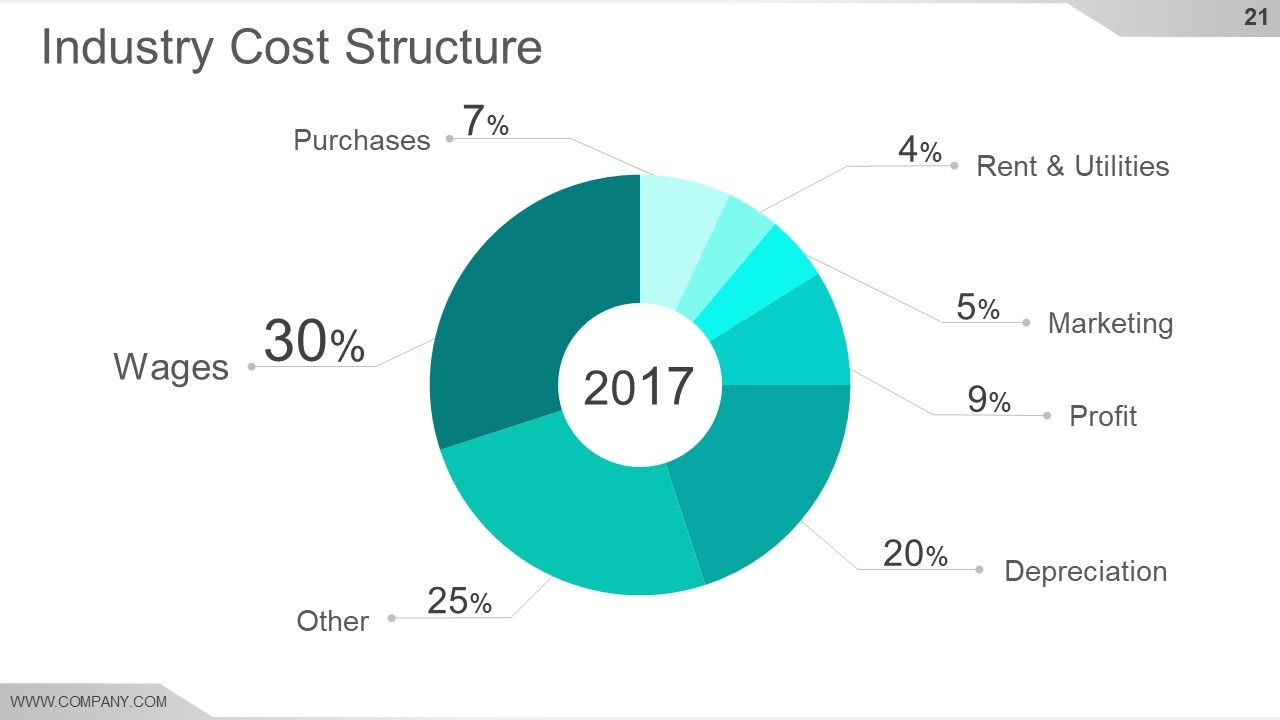
Slide 21: This slide shows Industry Cost Structure showing- Other, Depreciation, Purchases, Rent & Utilities, Marketing, Profit, Wages.
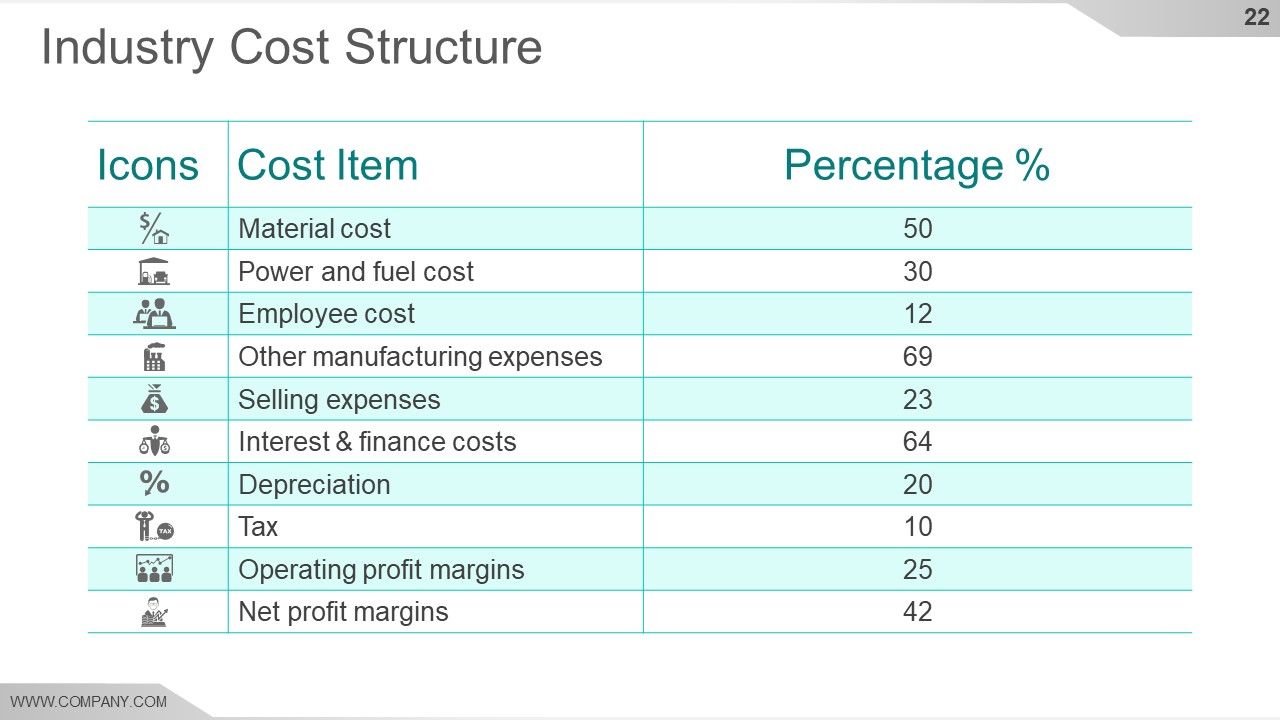
Slide 22: This slide displays Industry Cost Structure in tabular form.
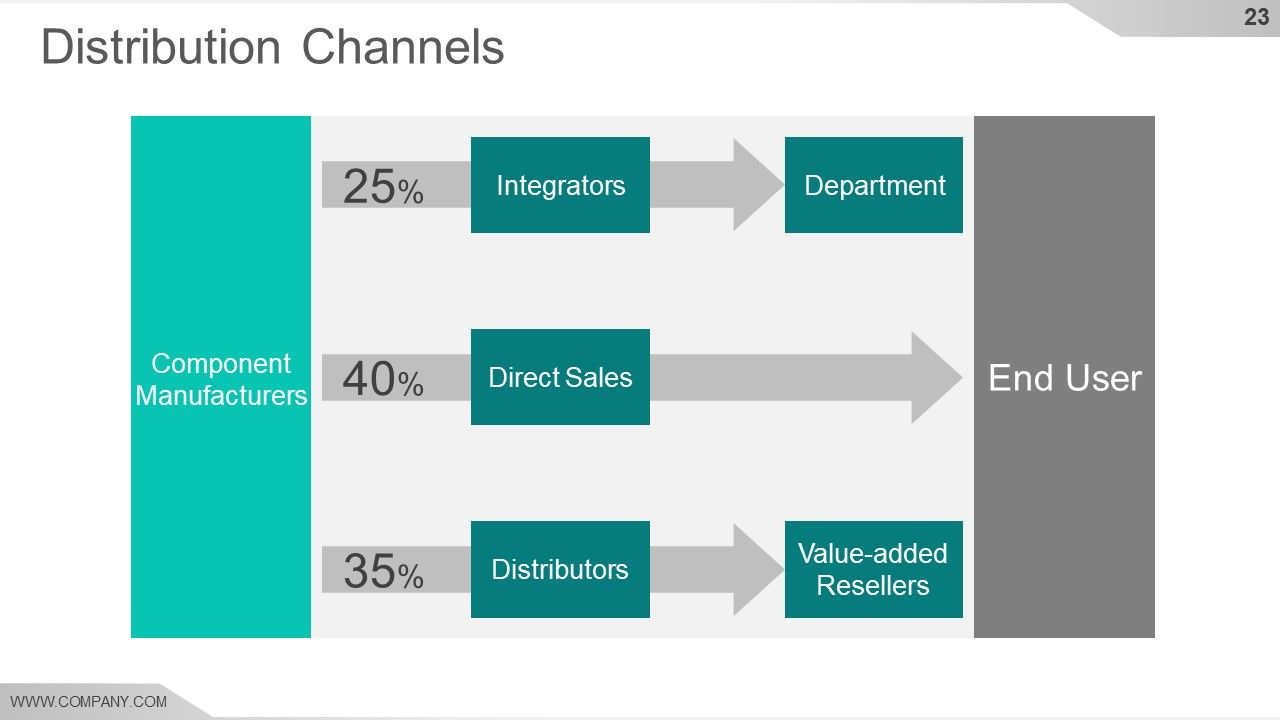
Slide 23: This slide shows Distribution Channels showcasing- Component Manufacturers, Direct Sales, Distributors, Integrators, End User, Value-added Resellers, System Developers.
Slide 24: This slide showcases Key Success Factors. The key success factors are those that are necessary for you to achieve success as a brand.
Slide 25: This slide shows Competitor Analysis.
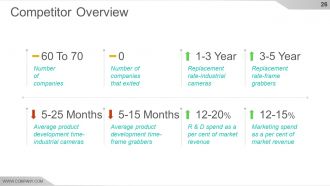
Slide 26: This slide shows Competitor Overview with- Number of competitors, Number of companies that exited, Average product development time-industrial cameras, Average product development time-frame grabbers, Replacement rate-industrial cameras, R & D spend as A per cent of market revenue, Replacement rate-frame grabbers, Marketing spend as A per cent of market revenue in, Decreasing, Increasing and Stable parameters.
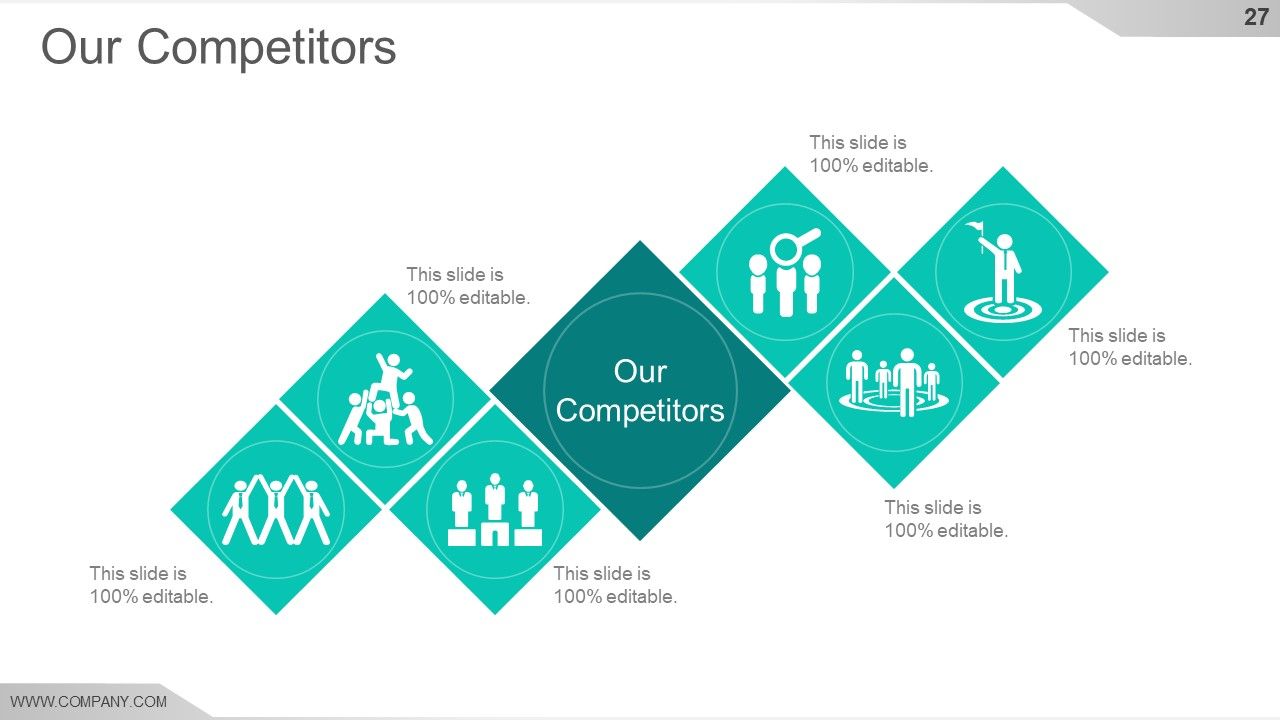
Slide 27: This slide shows Our Competitors with icon imagery to display.
Slide 28: This slide also shows Our Competitors with icon imagery to display.
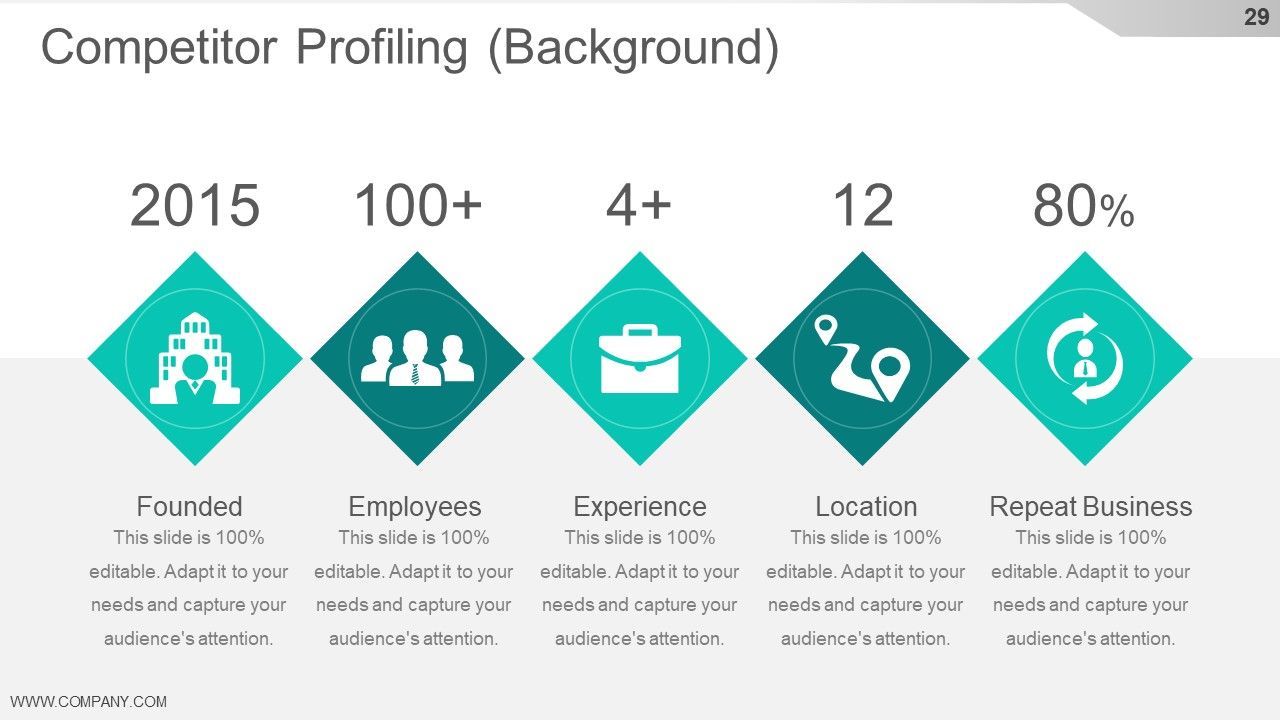
Slide 29: This slide presents Competitor Profiling (Background) showcasing- Founded, Employees, Experience, Location, and Repeat Business as factors to display.
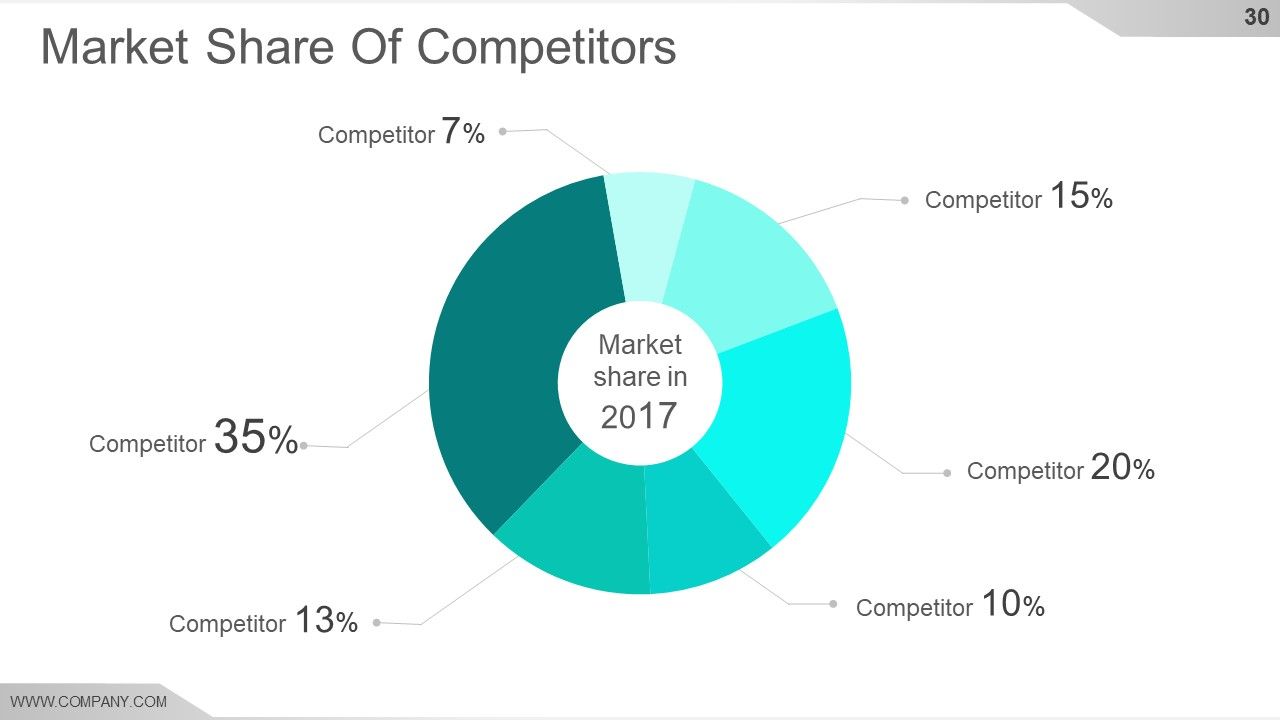
Slide 30: This slide presents Market Share Of Competitors in bar graph form.
Slide 31: This slide shows Competitor’s Objectives (Short Term & Long Term).
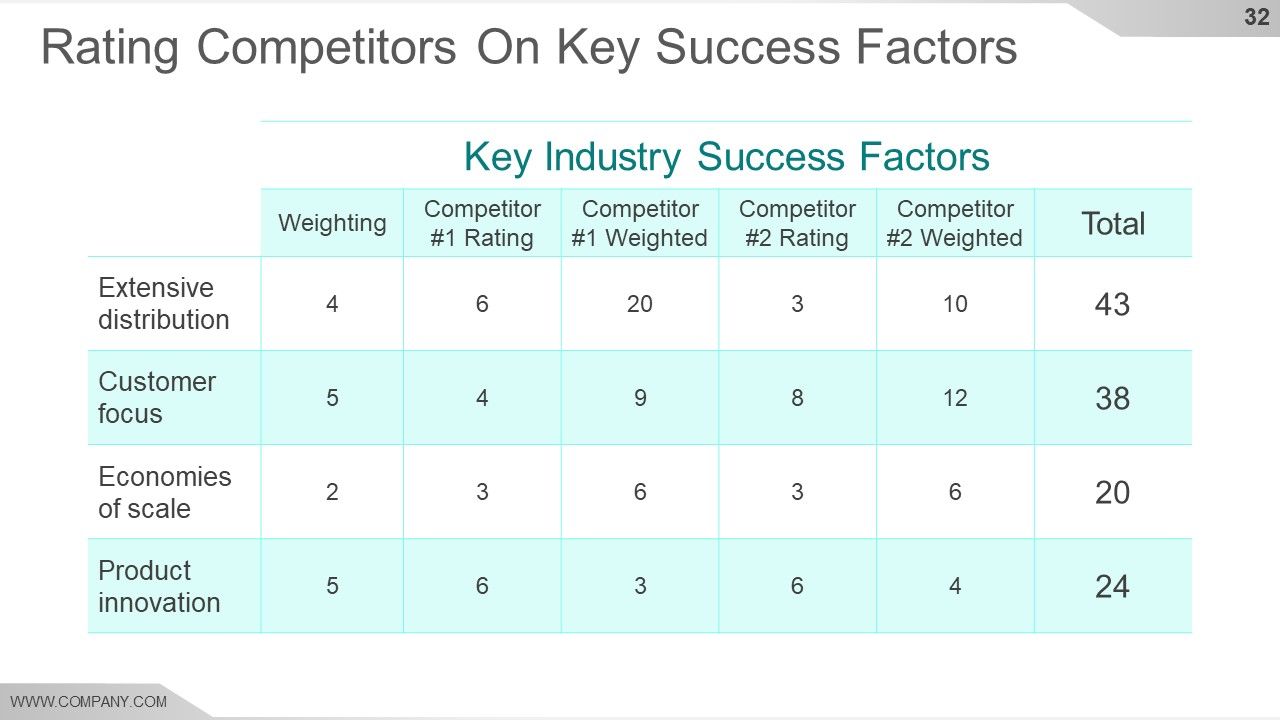
Slide 32: This slide displays Rating Competitors On Key Success Factors in tabular form.
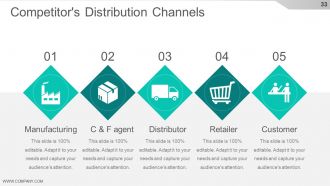
Slide 33: This slide showcases Competitor's Distribution Channels displaying- Manufacturing, Distributor, Retailer, Customer, C & F agent.
Slide 34: This slide shows Competitor's Current Strategy. State those aspects here.
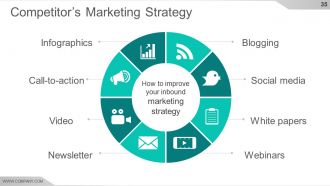
Slide 35: This slide presents Competitor’s Marketing Strategy displaying- Call-to-action, Infographics, Video, Newsletter, Social media, Blogging, White papers, Webinars.
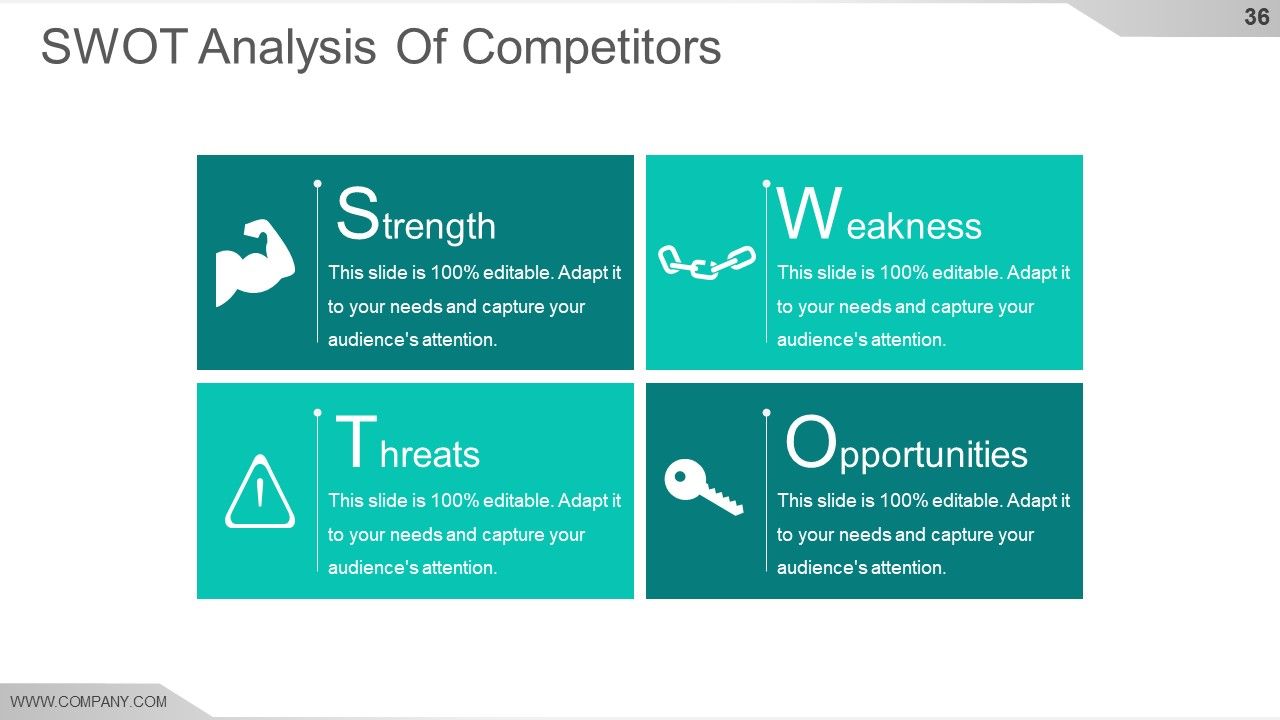
Slide 36: This slide showcases SWOT Analysis of Competitors.
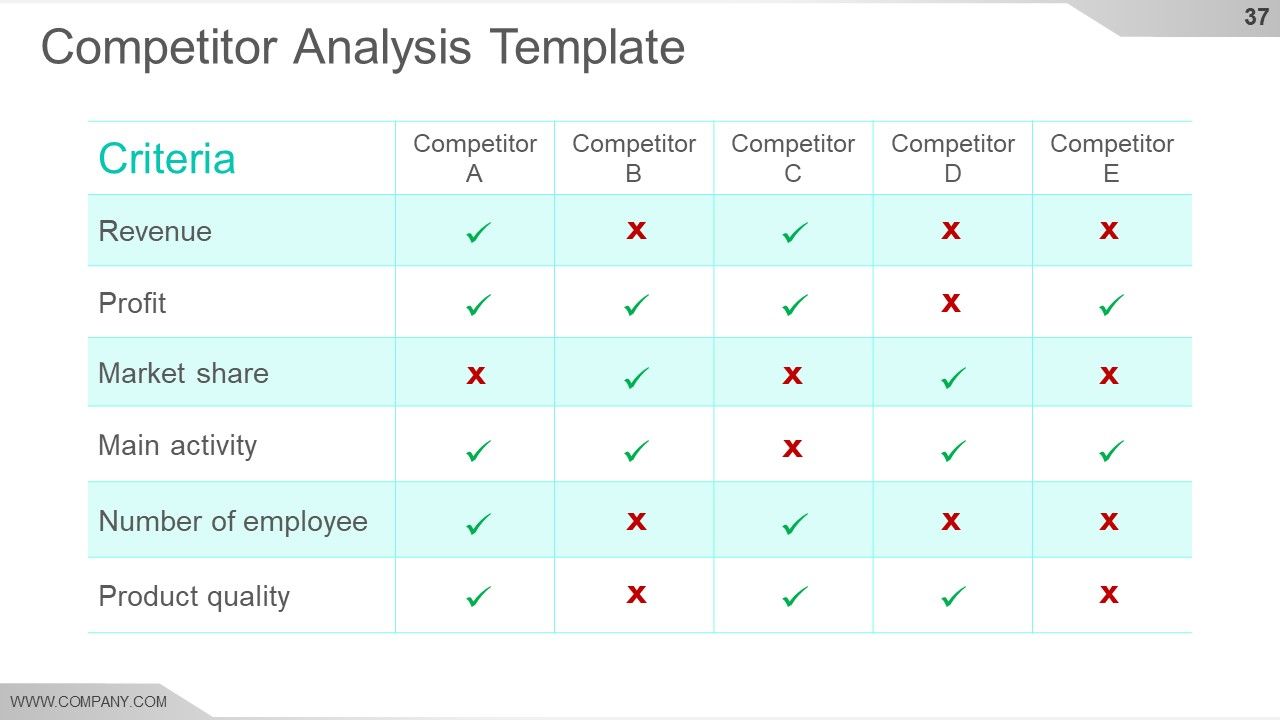
Slide 37: This is a Competitor Analysis Template slide.
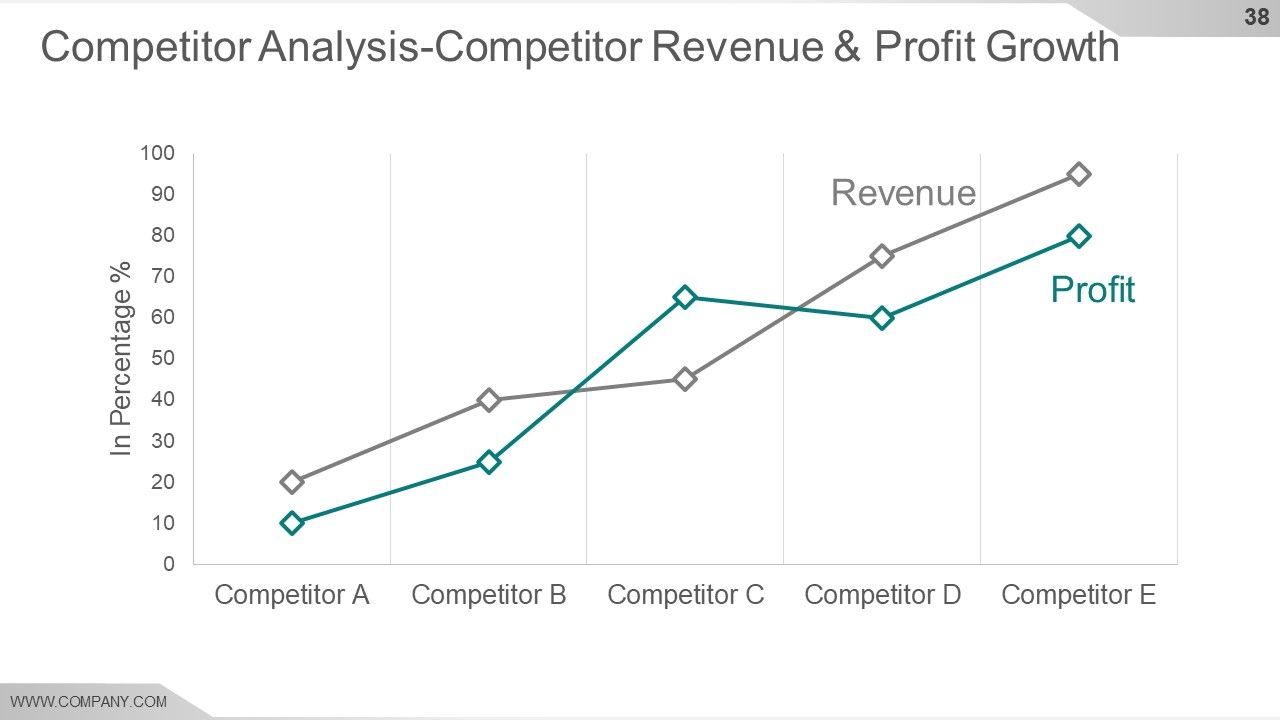
Slide 38: This slide shows Competitor Analysis- Competitor Revenue & Profit Graph showing- Revenue and Profit.
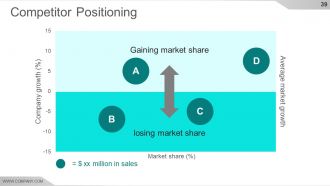
Slide 39: This slide shows Competitor Positioning stating- Losing market share, Gaining market share, Average market growth.
Slide 40: This is Competitive Intelligence Icon Set slide. Use the icons as per need.
Slide 41: This slide is titled Additional slides. You can change the slide content as per need.
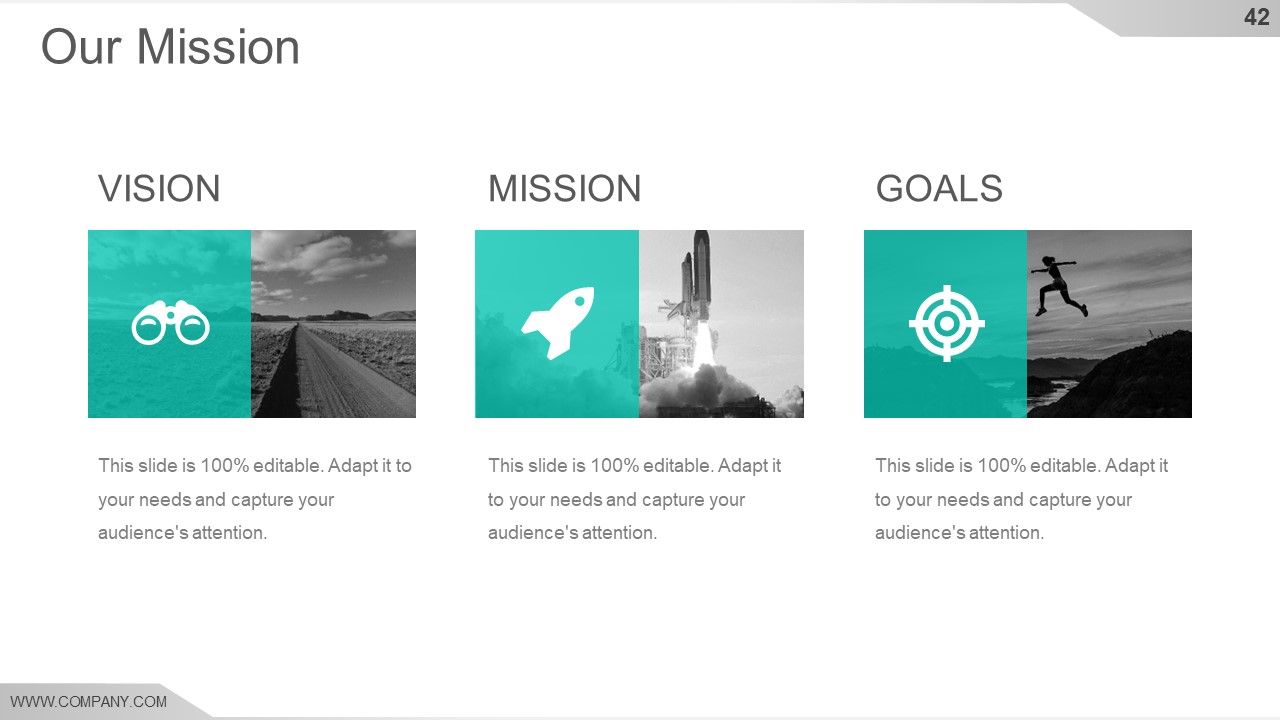
Slide 42: This is Our Mission slide with Vision, Mission, and Goal. State them here.
Slide 43: This is Our team slide with name, designation and text boxes to state information.
Slide 44: This is an About Us slide. State company/team specifications here.
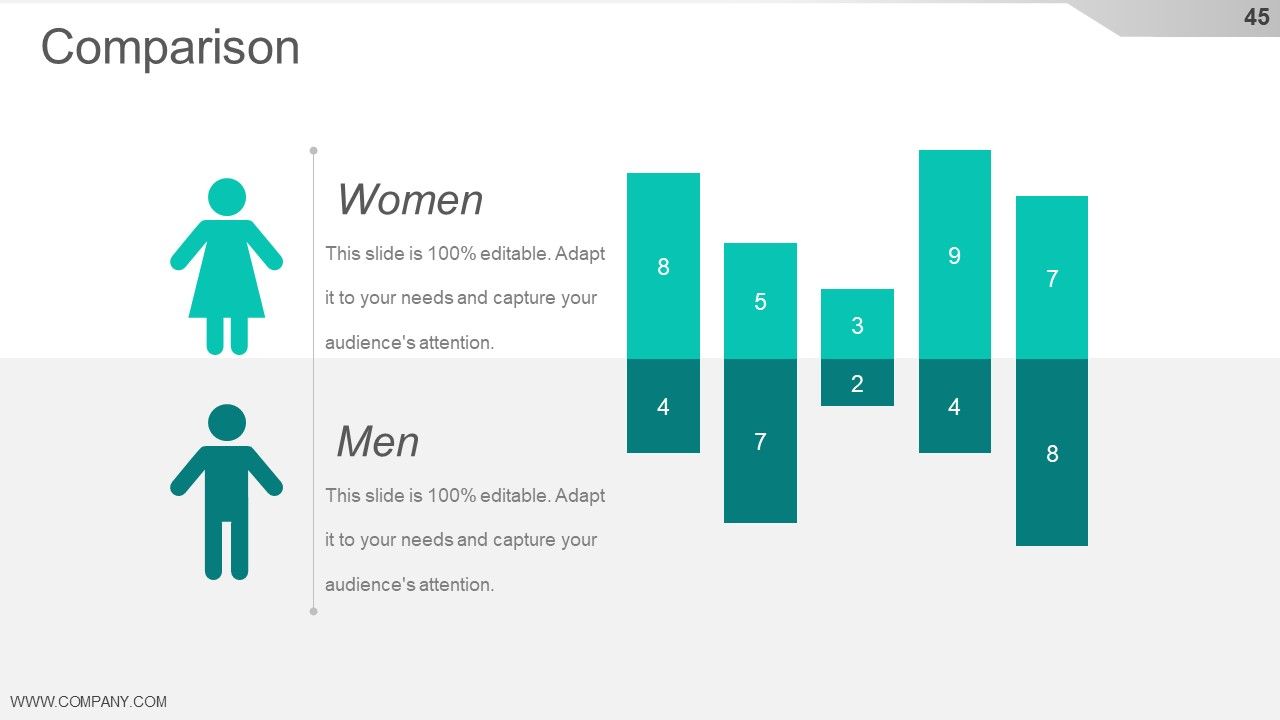
Slide 45: This is a Comparison slide to show comparison, information, specifications etc.
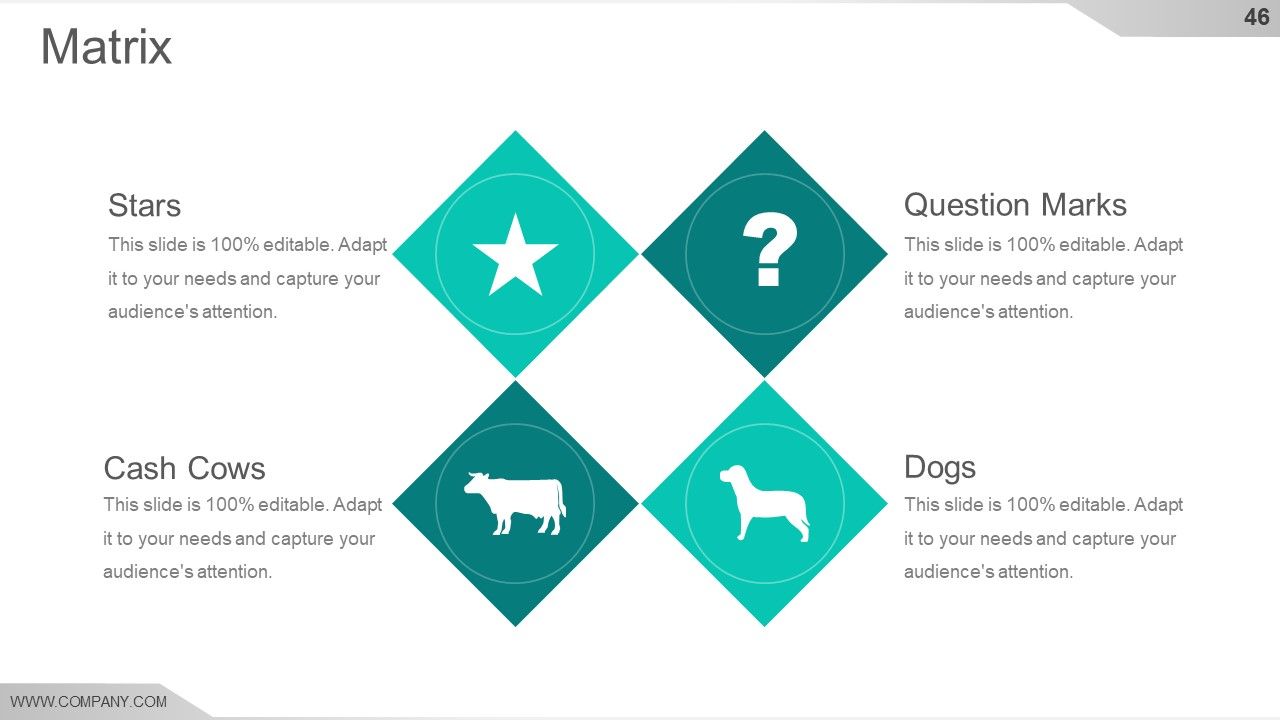
Slide 46: This is a Matrix slide. Put relevant comparing data here.
Slide 47: This is an Our Goal slide. State your important goals here.
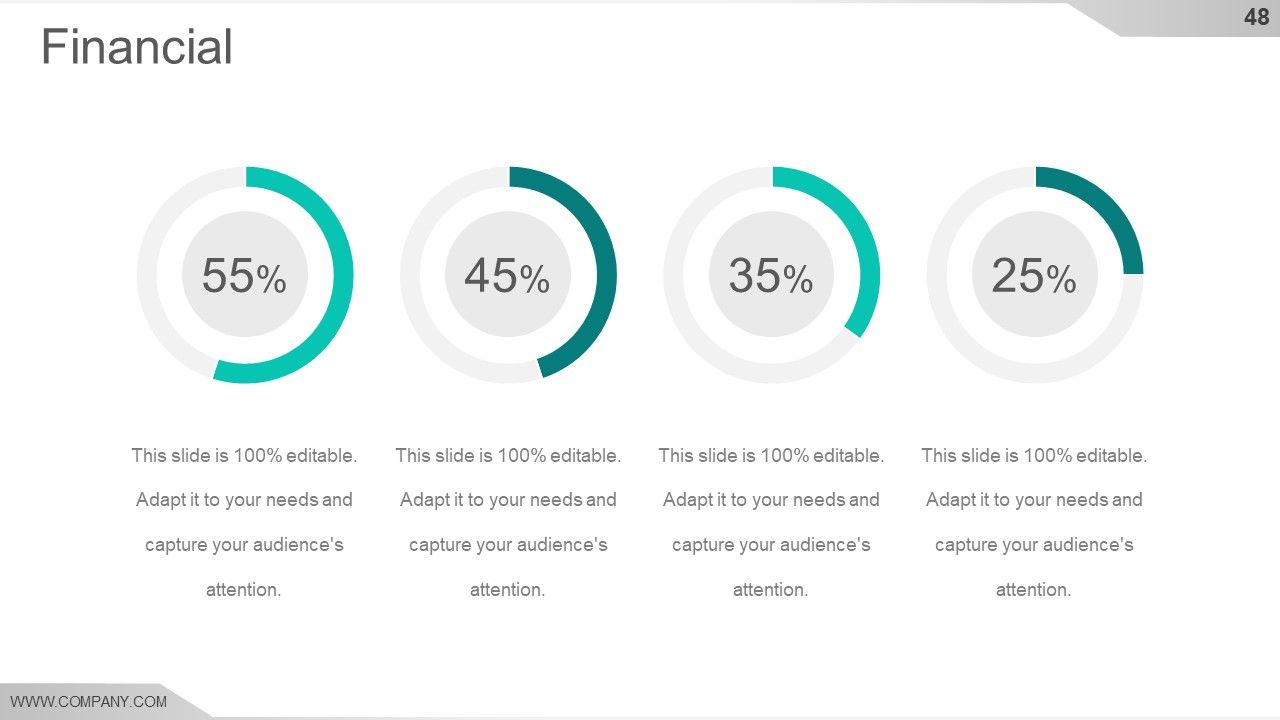
Slide 48: This slide presents Financial scores and stats to display.
Slide 49: This is a Quotes slide to highlight, or state anything specific. You may change the slide content as per need.
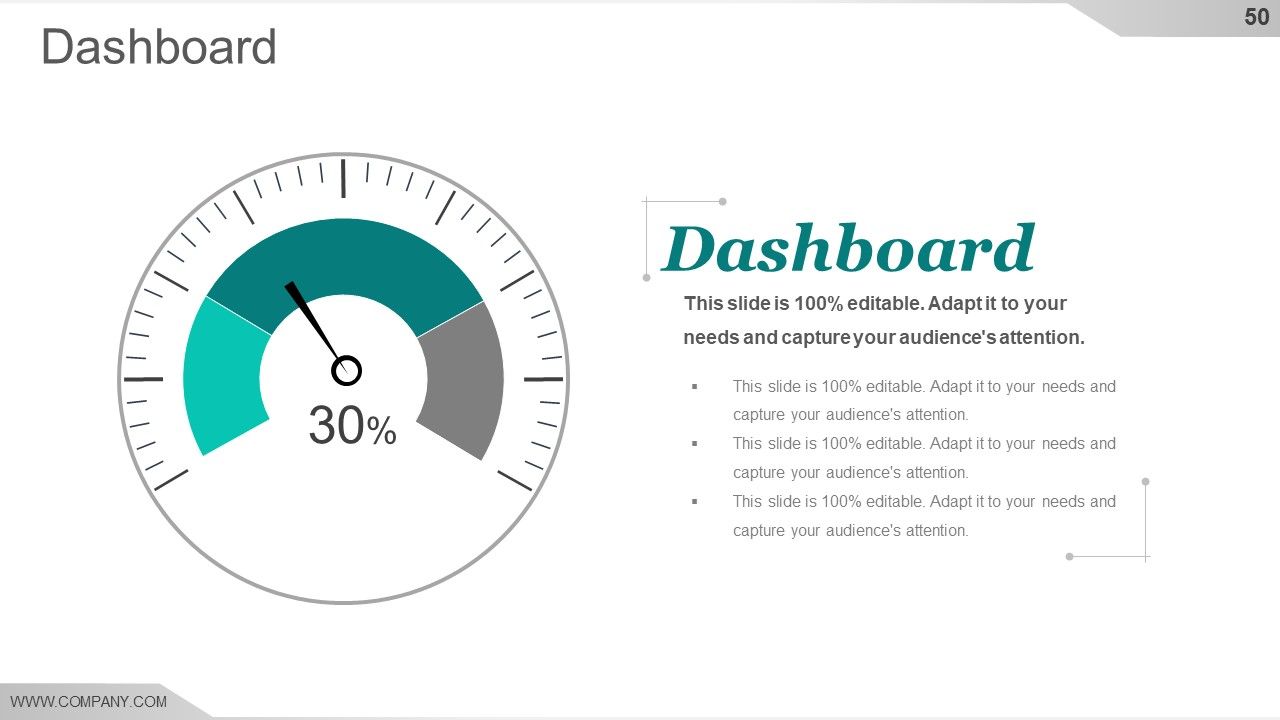
Slide 50: This is a Dashboard slide to state Low, medium and High aspects, kpis, metrics etc.
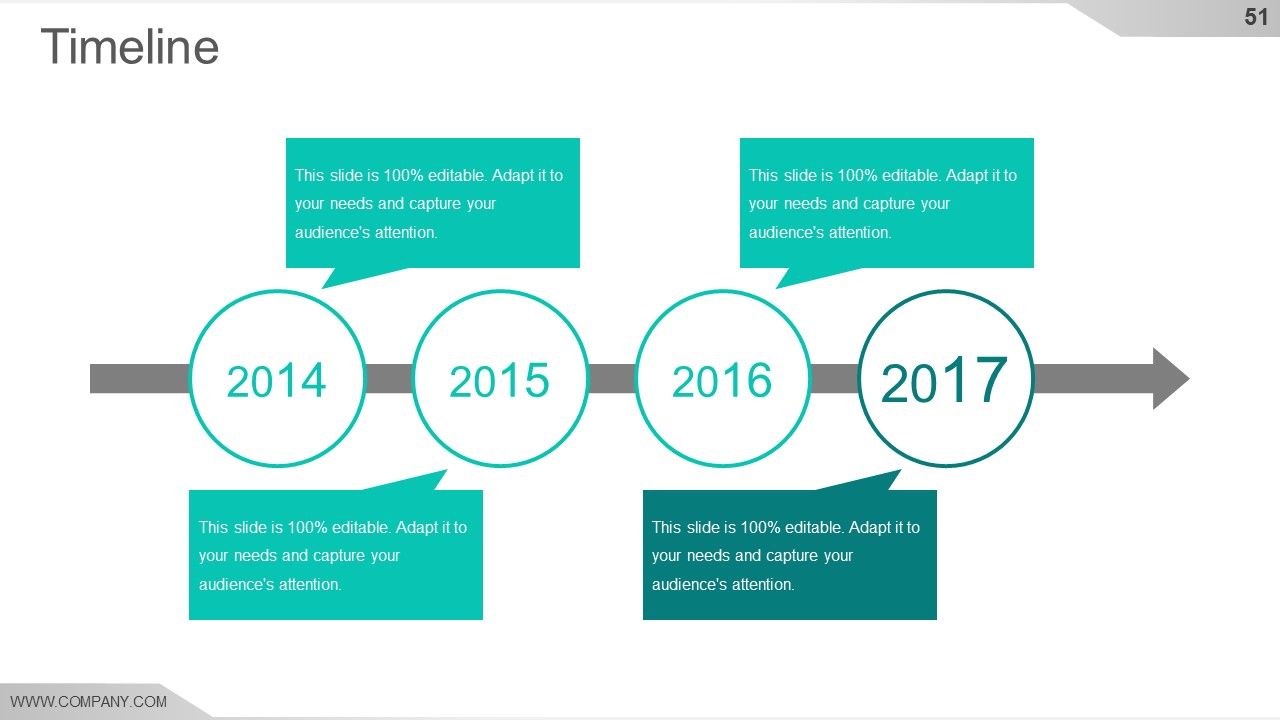
Slide 51: This is a Timeline slide to present important dates, evolution, milestones etc.
Slide 52: This is a Thank You slide with Address# street number, city, state, Contact Number, Email Address.
Competitive Intelligence Analysis And Strategy Powerpoint Presentation Slides with all 52 slides:
Be an example to follow with our Competitive Intelligence Analysis And Strategy Powerpoint Presentation Slides. Display your best to all around.
-
Qualitative and comprehensive slides.
-
Editable templates with innovative design and color combination.


