Quarterly Business Review Framework Powerpoint Presentation Slides
Here is a content ready quarterly business review framework PowerPoint presentation to benefit the professionals overcome restrictions to run a corporate. Highlighting the important facts of this business information review PPT slides, here we have come up with readymade presentation related to your topic. In this quarterly business overview PPT templates, we have included a firm overview, financial performance, CSR, competitor’s analysis, future roadmap, client & project updates etc. You can also use this complete company summary PowerPoint sample slide with related topics like economic assessment, company evaluation, organizational study, company information analysis, enterprise audit, enterprise assessment, organizational appraisal and many more. Organizational summary is required to ensure the challenges of economic and financial performance. This is the most suitable QBR PPT designs for middle and top-level management. This professionally pre-designed quarterly business review framework presentation graphics are available to download. Our Quarterly Business Review Framework Powerpoint Presentation Slides are truly out of this world. Even the MIB duo has been keeping tabs on our team.
- Google Slides is a new FREE Presentation software from Google.
- All our content is 100% compatible with Google Slides.
- Just download our designs, and upload them to Google Slides and they will work automatically.
- Amaze your audience with SlideTeam and Google Slides.
-
Want Changes to This PPT Slide? Check out our Presentation Design Services
- WideScreen Aspect ratio is becoming a very popular format. When you download this product, the downloaded ZIP will contain this product in both standard and widescreen format.
-

- Some older products that we have may only be in standard format, but they can easily be converted to widescreen.
- To do this, please open the SlideTeam product in Powerpoint, and go to
- Design ( On the top bar) -> Page Setup -> and select "On-screen Show (16:9)” in the drop down for "Slides Sized for".
- The slide or theme will change to widescreen, and all graphics will adjust automatically. You can similarly convert our content to any other desired screen aspect ratio.
Compatible With Google Slides

Get This In WideScreen
You must be logged in to download this presentation.
PowerPoint presentation slides
This complete PPT contains 79 slides. Instantly download this slide by just one click. Standard and widescreen see. This template is compatible with Google Slides. This is 100% editable in PowerPoint. This PPT offers premium customer support.
People who downloaded this PowerPoint presentation also viewed the following :
Content of this Powerpoint Presentation
Slide 1: This slide introduces Quarterly Business Review Framework. State Your Company Name and get started.
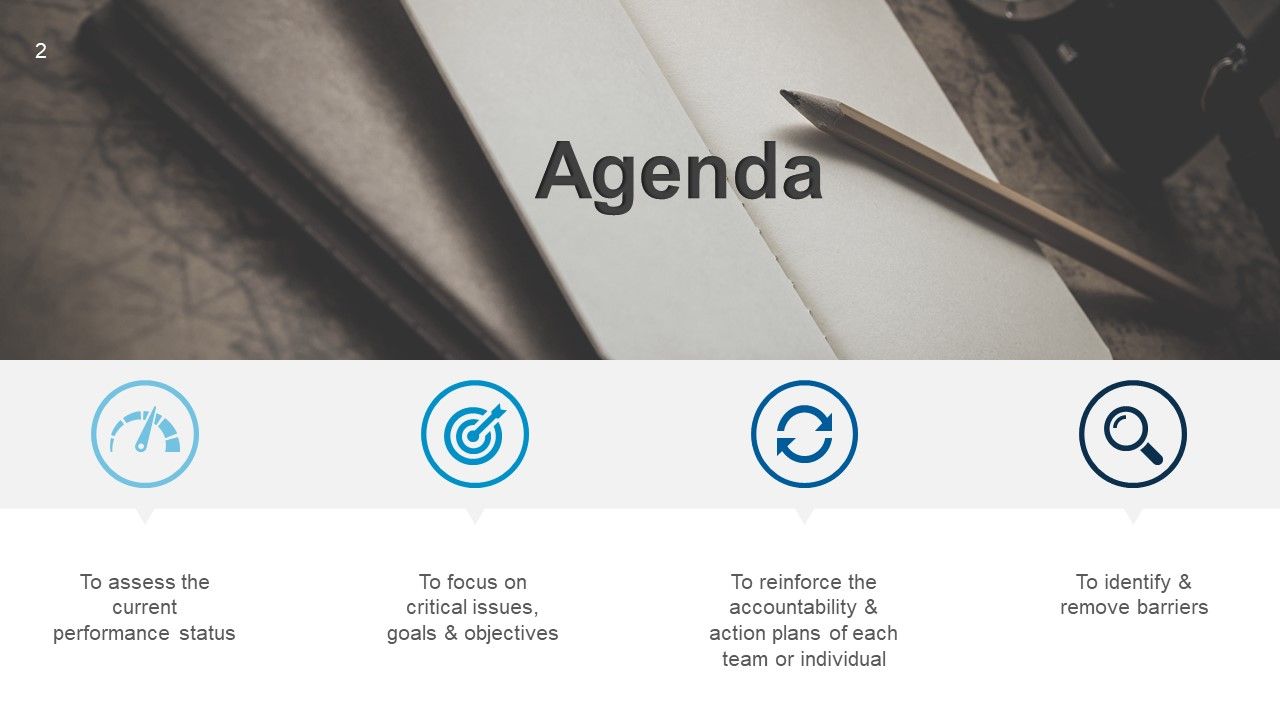
Slide 2: This is an Agenda slide. State agendas such as- To assess the current performance status, To focus on critical issues, goals & objectives, To reinforce the accountability & action plans of each team or individual, To identify & remove barriers.
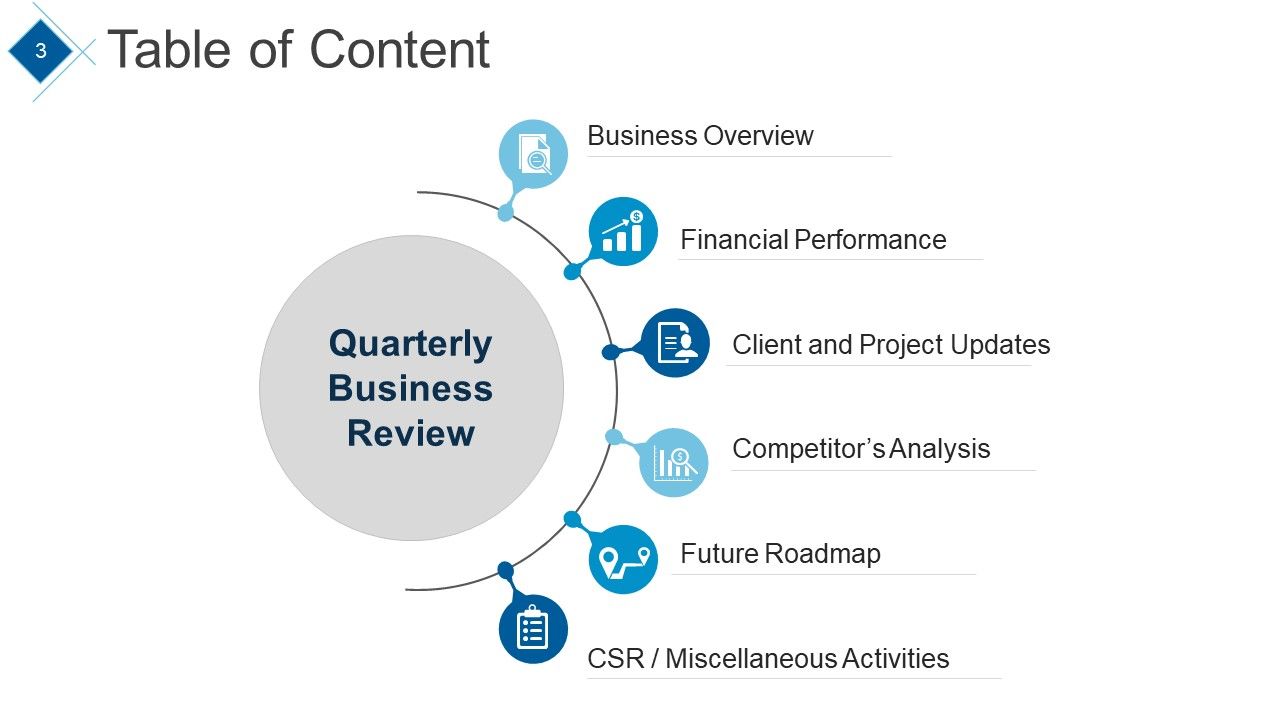
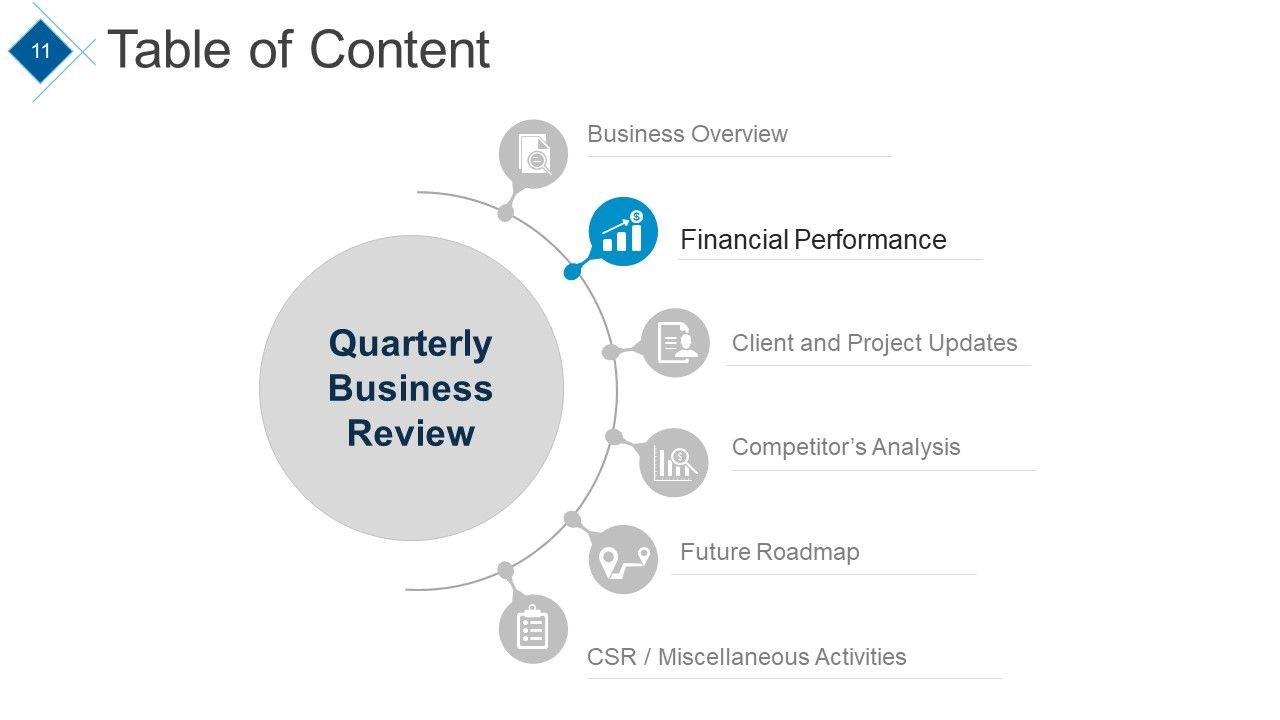
Slide 3: This slide shows Table of Content. The points inlcuded are- Quarterly Business Review, Business Overview, Financial Performance, Client and Project Updates, Competitor’s Analysis, Future Roadmap, CSR / Miscellaneous Activities.
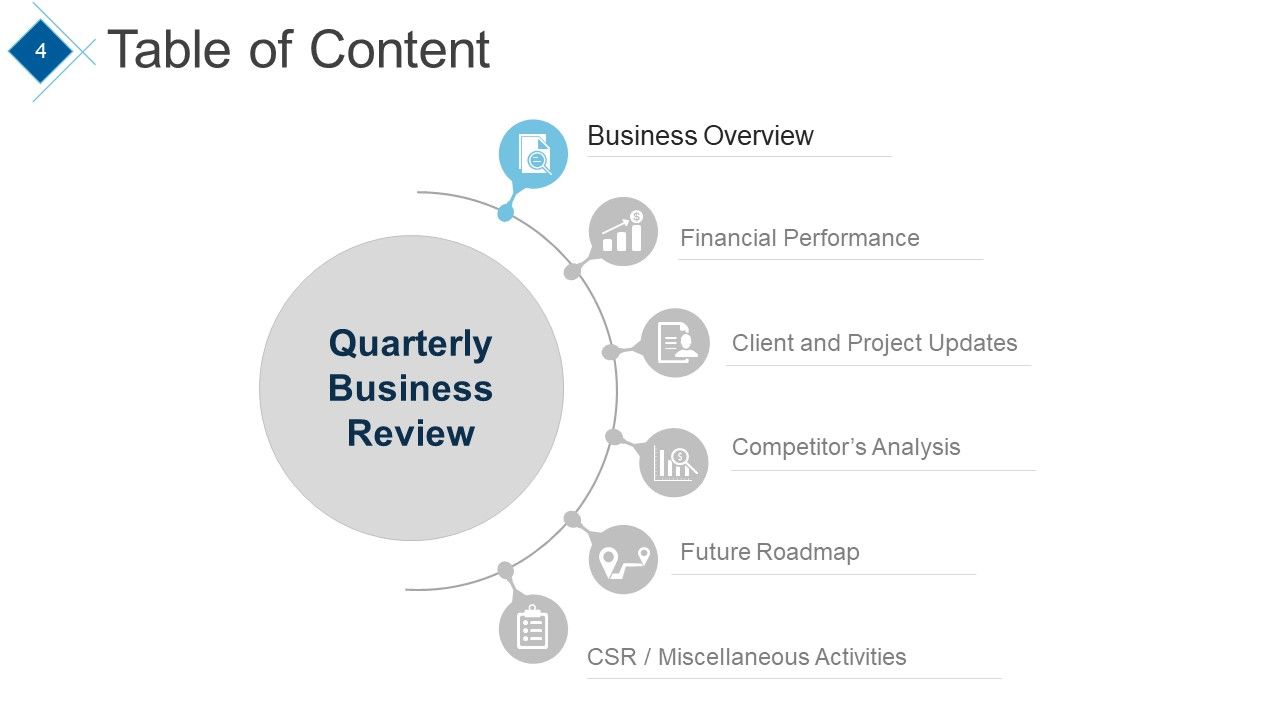
Slide 4: This slide continues Table of Content. The point highlighted is- Business Overview.
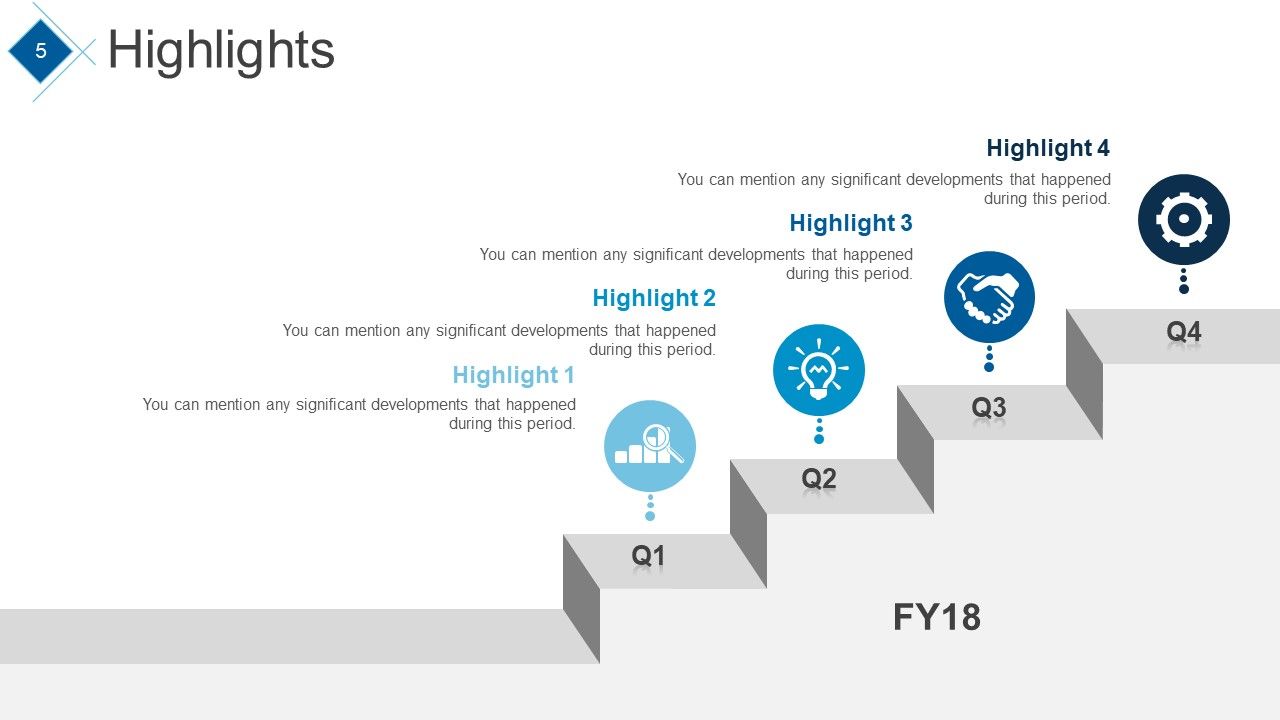
Slide 5: This slide shows Highlights. You can mention any significant developments that happened during this period.
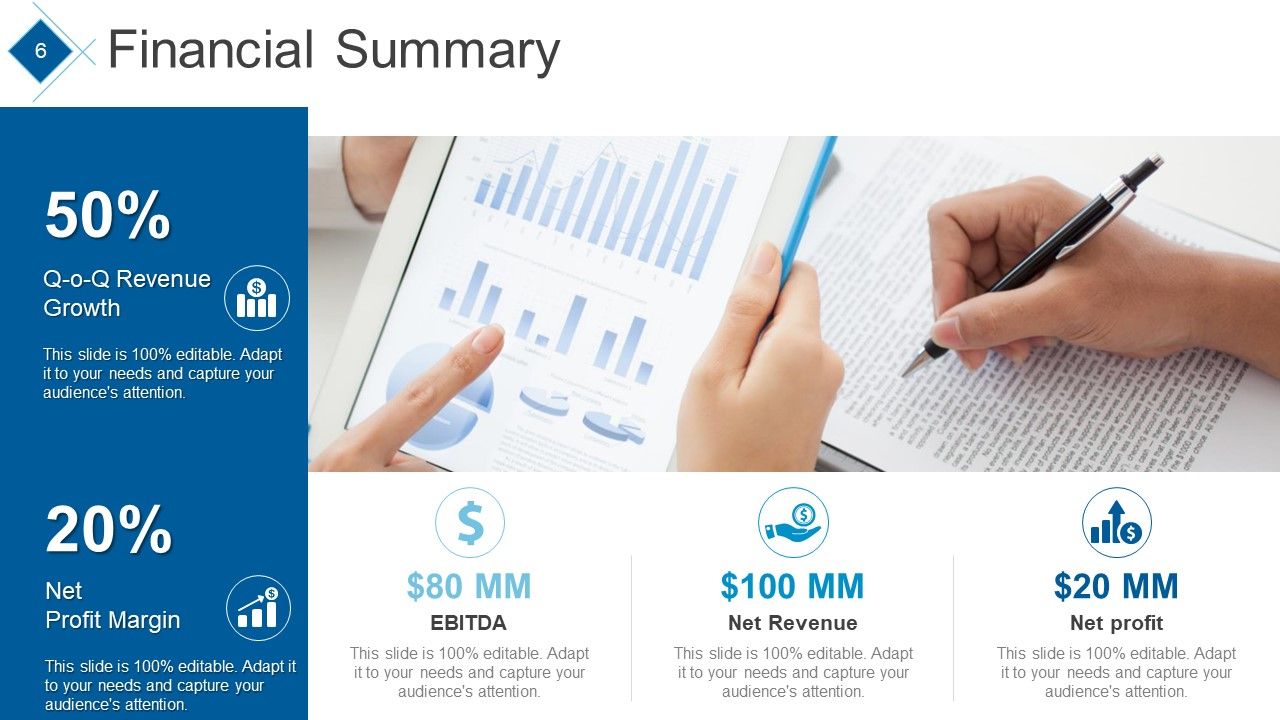
Slide 6: This slide presents the Financial Summary with the following points- Net profit, EBITDA, Net Revenue, Net Profit Margin, Q-o-Q Revenue Growth.
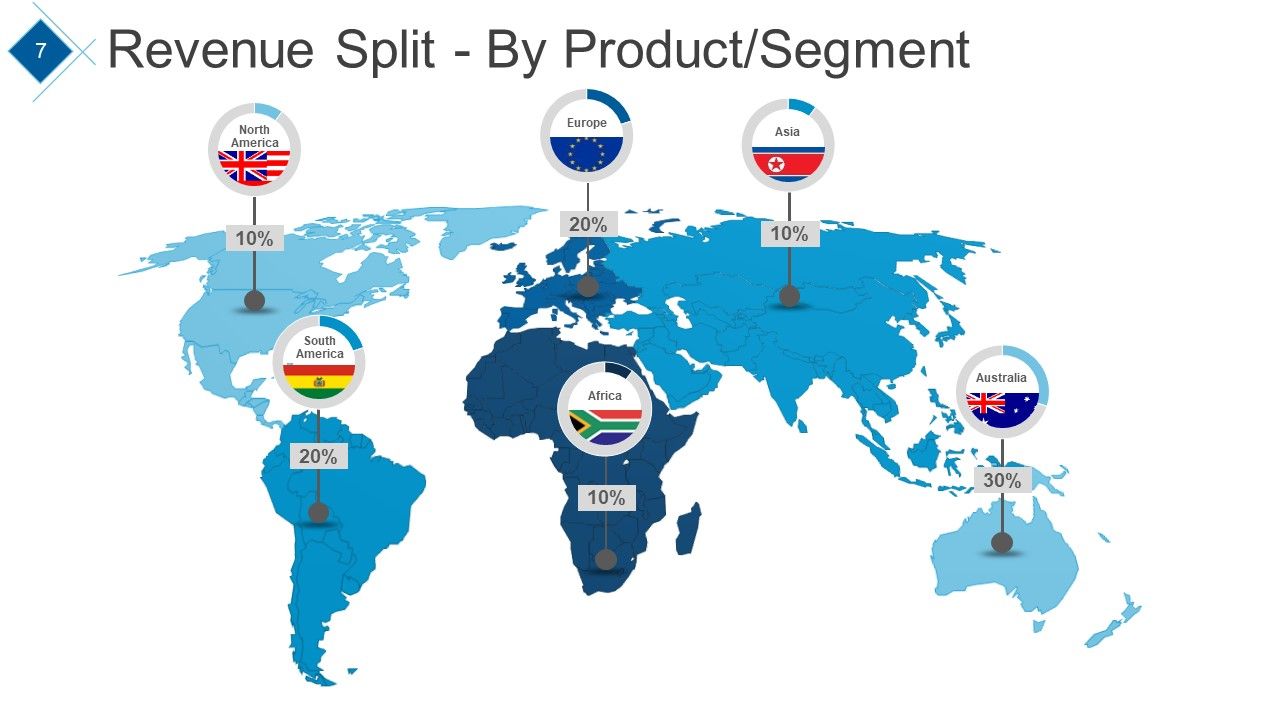
Slide 7: This slide shows Revenue Split - By Product/Segment in world map image to show global segregation.
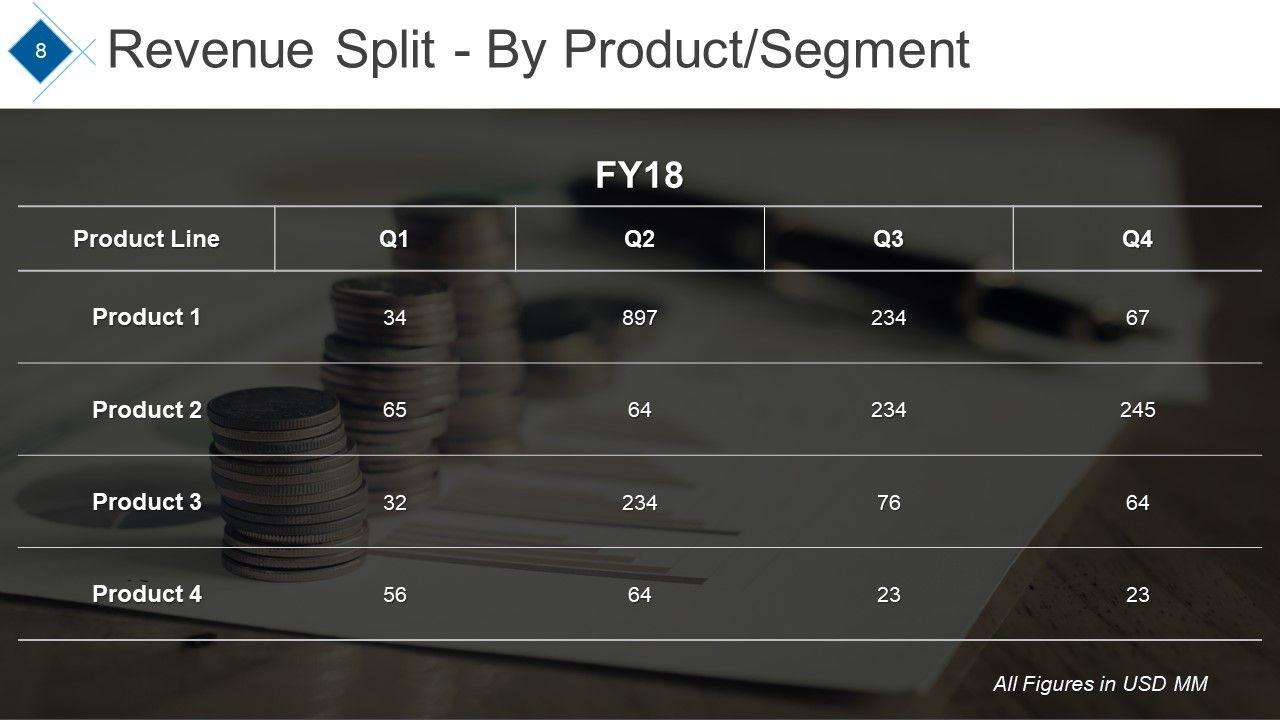
Slide 8: This slide shows Revenue Split - By Product/Segment table of different products.
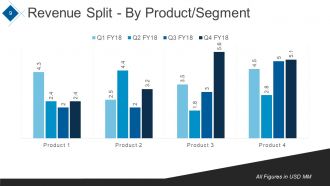
Slide 9: This slide shows Revenue Split - By Product/Segment in graph form.
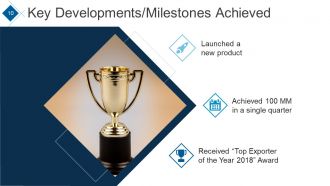
Slide 10: This slide shows Key Developments/Milestones Achieved with examples such as- Launched a new product, Achieved 100 MM in a single quarter, Received “Top Exporter of the Year 2018” Award.
Slide 11: This slide shows Table of Content highlighting Financial Performance.
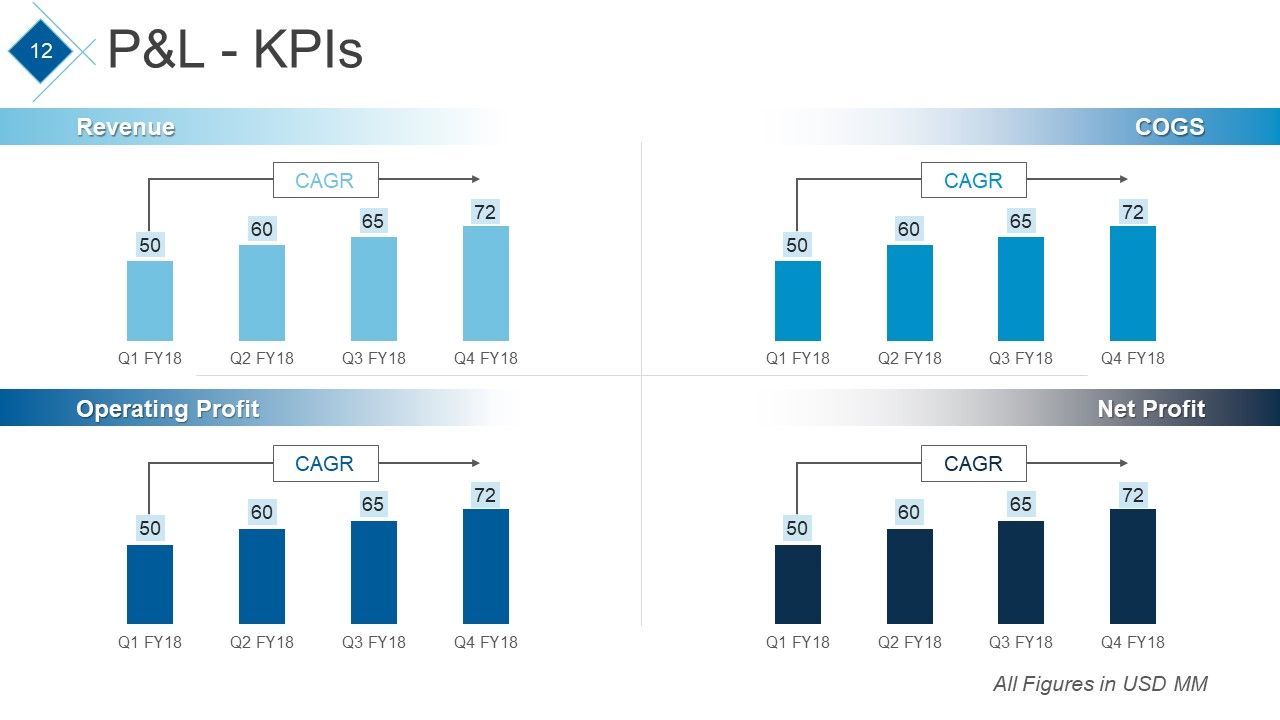
Slide 12: This slide presents P&L - KPIs CAGR graphs of Revenue, Operating Profit, COGS, Net Profit.
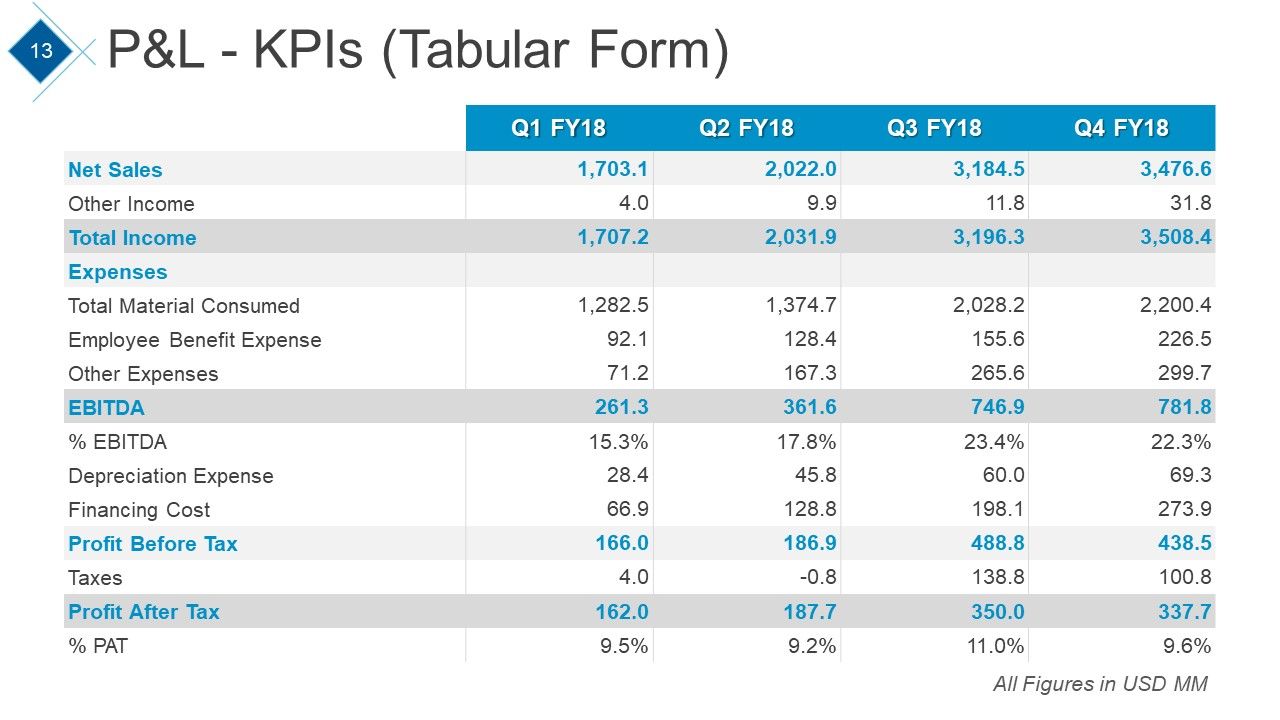
Slide 13: This slide presents P&L - KPIs CAGR in tabular form.
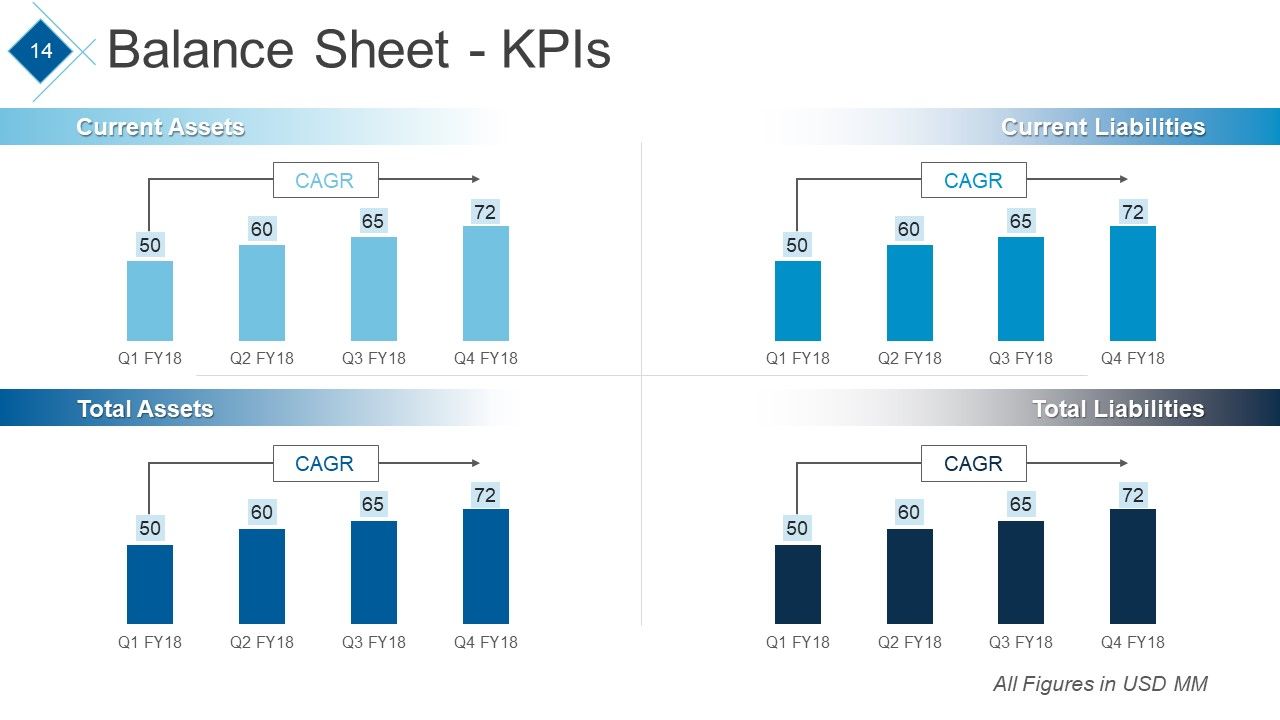
Slide 14: This slide shows Balance Sheet - KPIs showing- Current Assets, Total Assets, Current Liabilities, Total Liabilities.
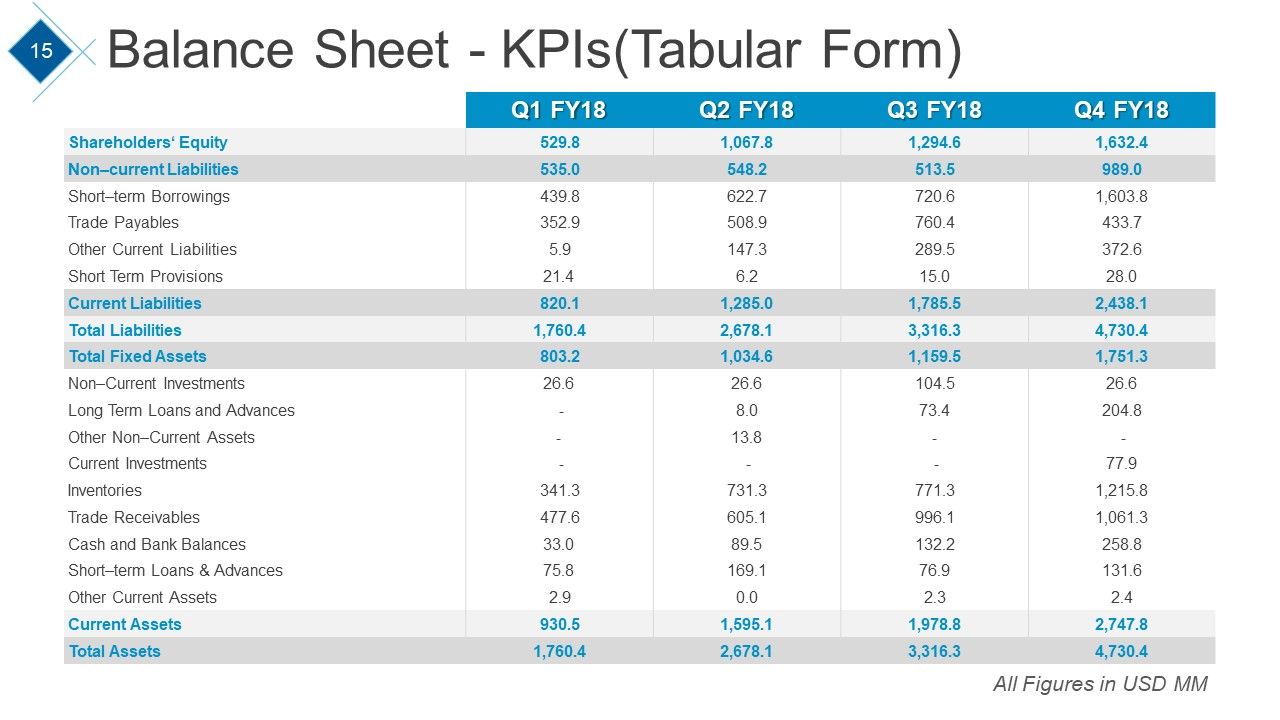
Slide 15: This slide shows Balance Sheet - KPIs in tabular form.
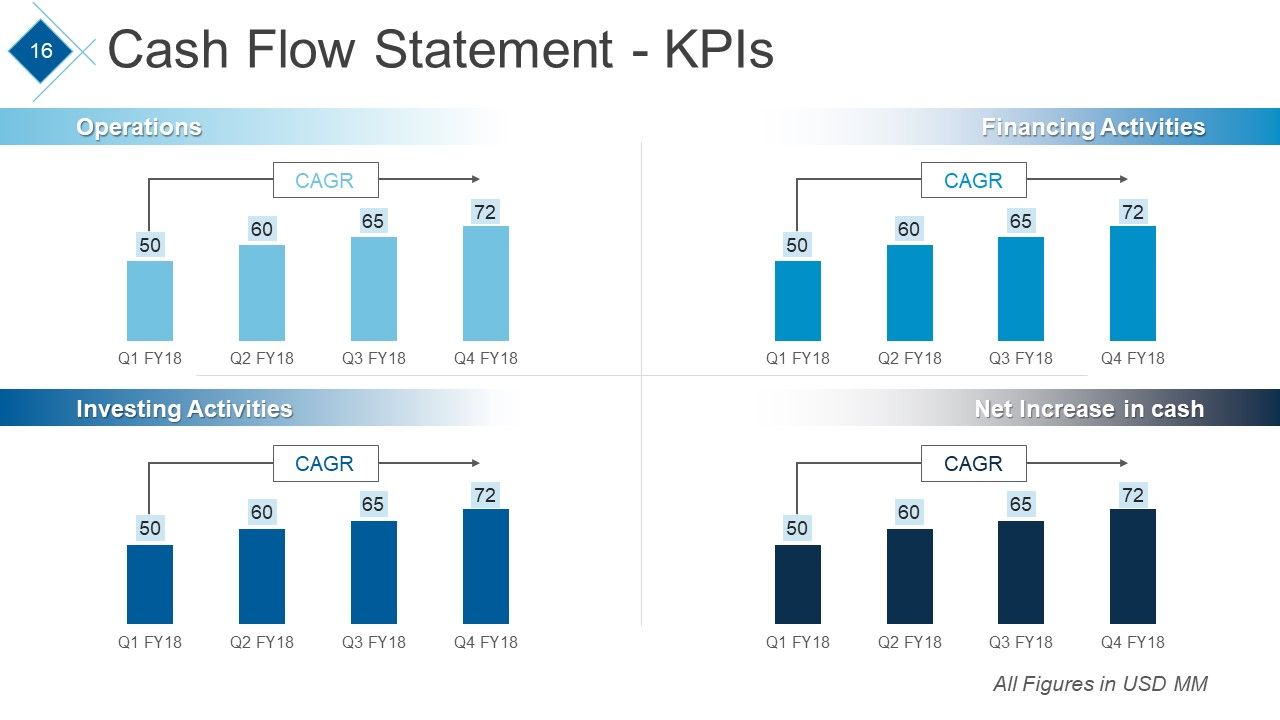
Slide 16: This slide showcases Cash Flow Statement - KPIs graphs of Operations, Investing Activities, Financing Activities, Net Increase in cash.
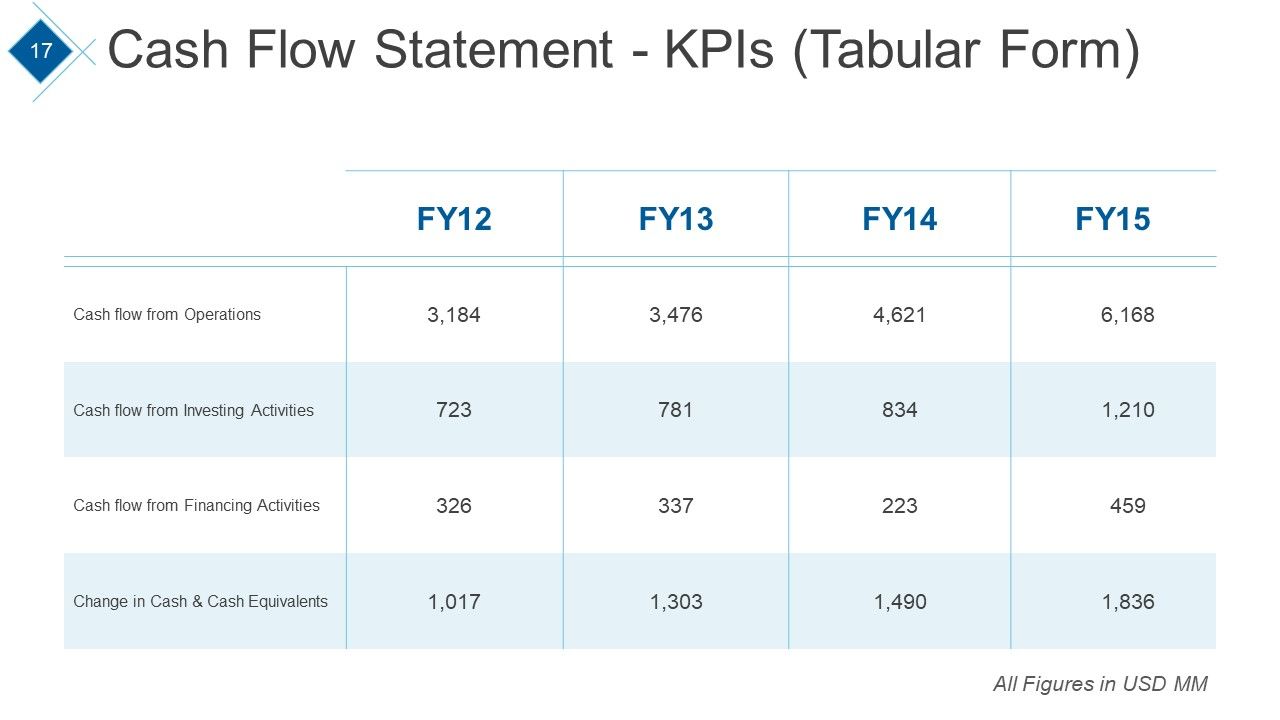
Slide 17: This slide showcases Cash Flow Statement in tabular form.
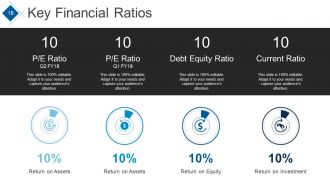
Slide 18: This slide presents Key Financial Ratios of- P/E Ratio, Debt Equity Ratio, Current Ratio with- Return on Assets, Return on Equity, Return on Investment, Return on Assets.
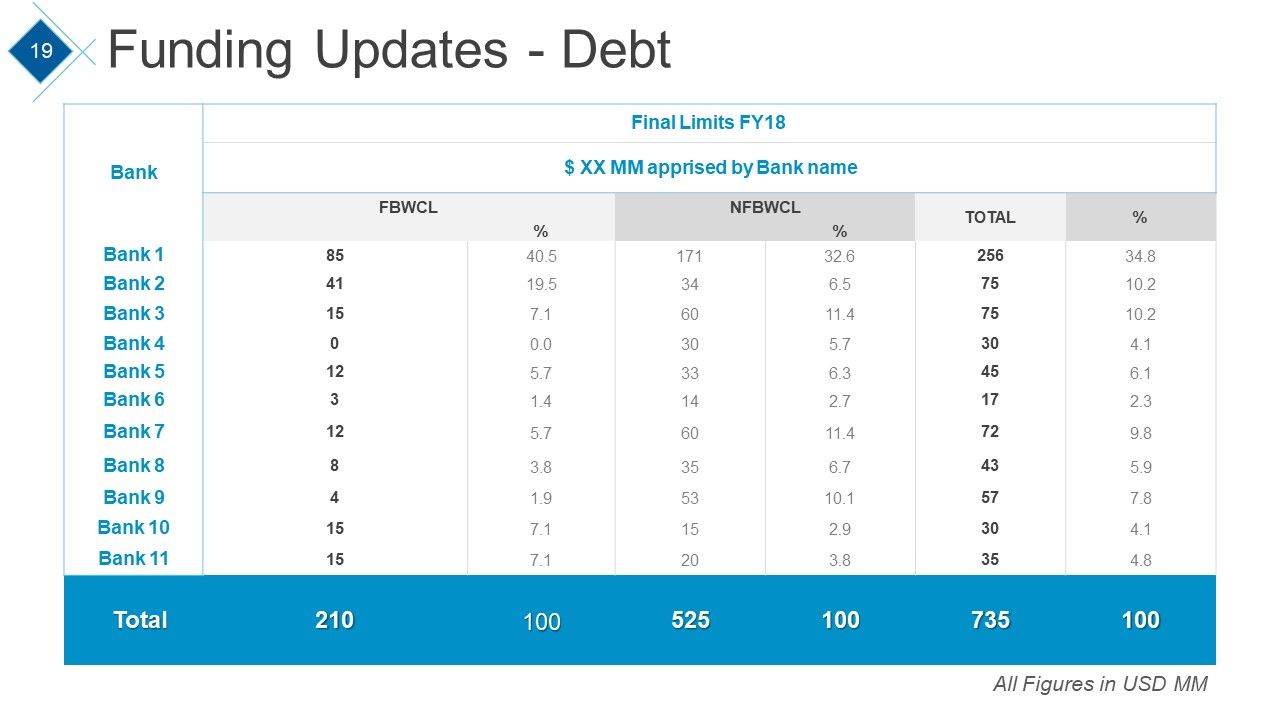
Slide 19: This slide presents Funding Updates - Debt in tabular form.
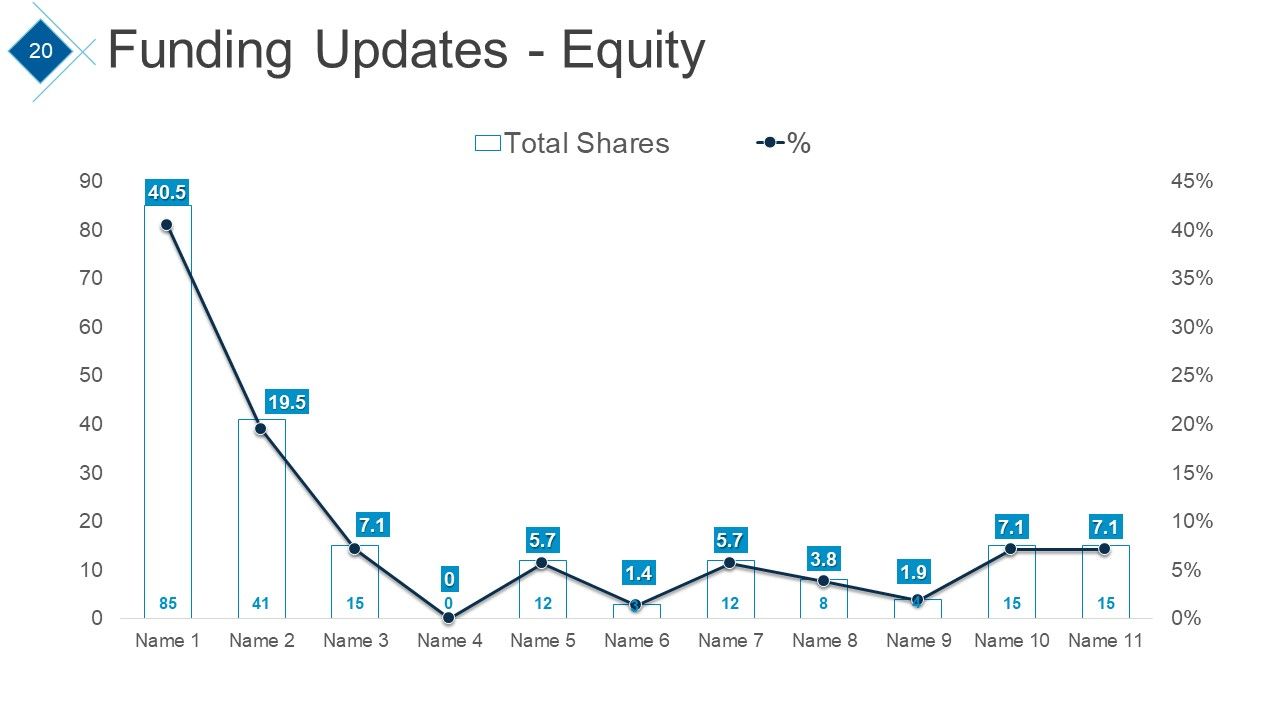
Slide 20: This slide presents Funding Updates - Equity in graph form.
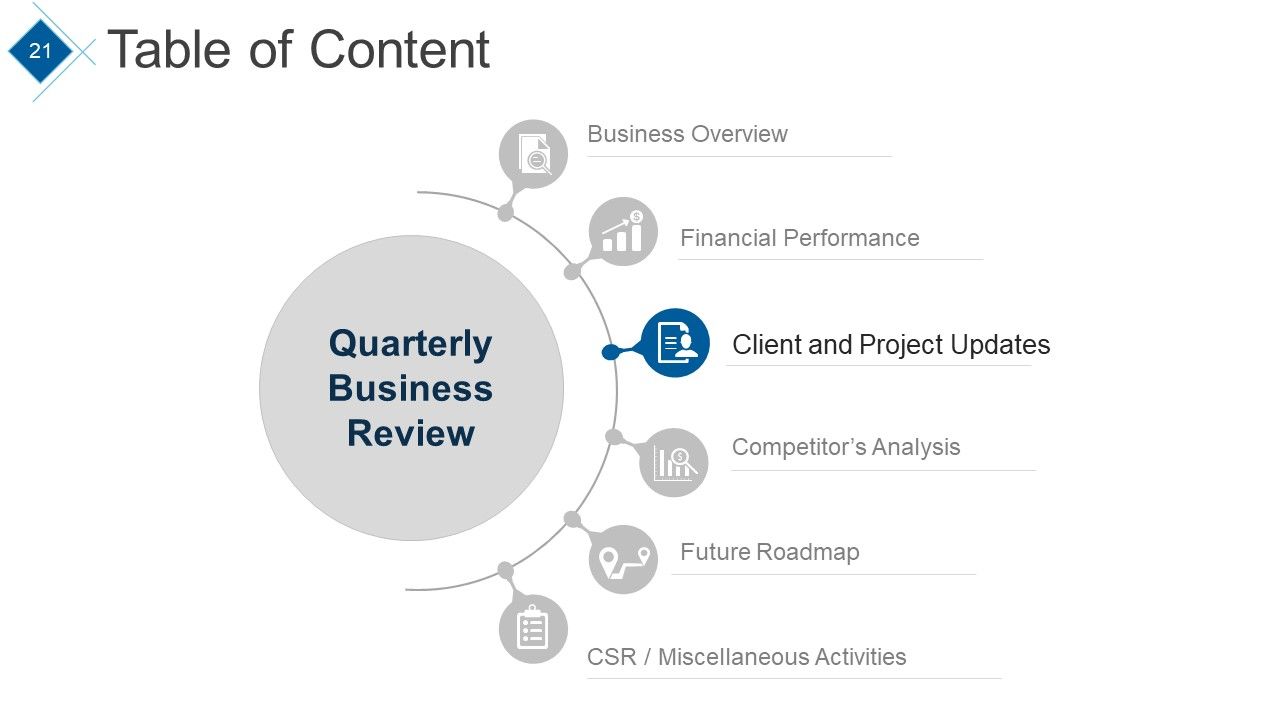
Slide 21: This slide showcases Table of Content with the highlighted point- Client and Project Updates.
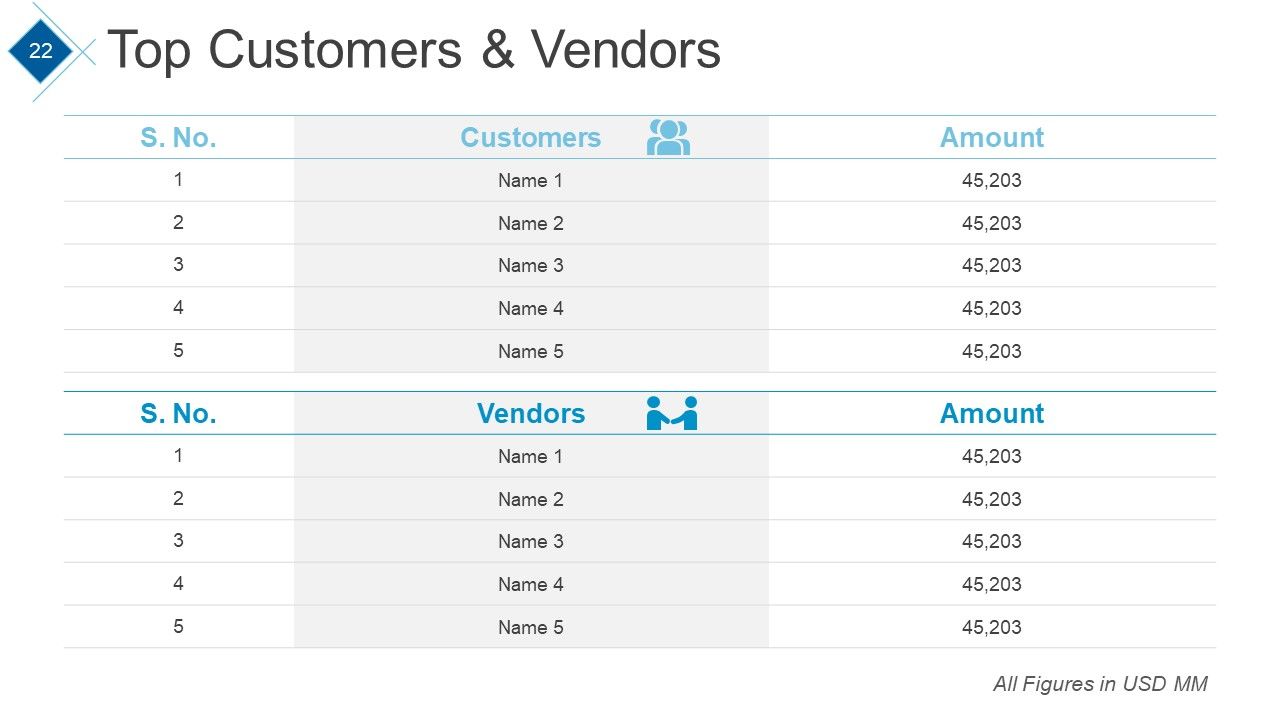
Slide 22: This slide shows the table for Top Customers & Vendors.
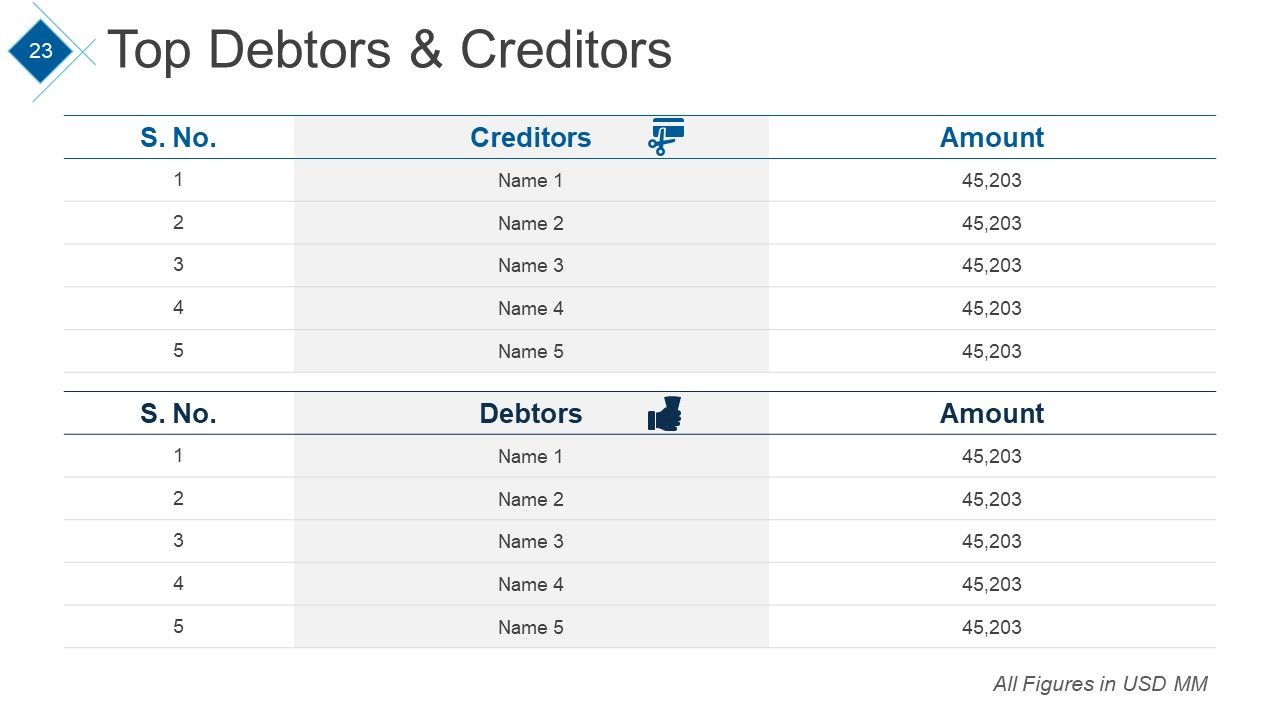
Slide 23: This slide shows the table for Top Debtors & Creditors.
Slide 24: This slide presents Client Updates with- New Clients Acquired, Major Clients Acquired.
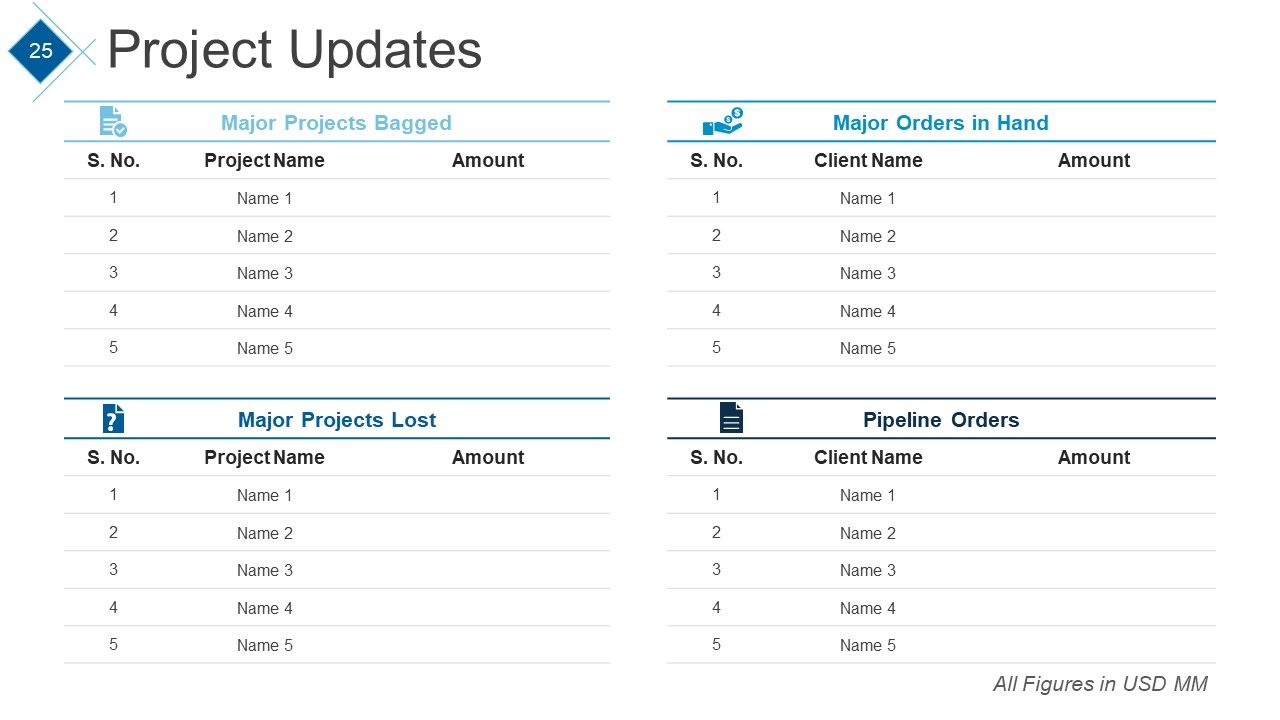
Slide 25: This slide showcases Project Updates table.
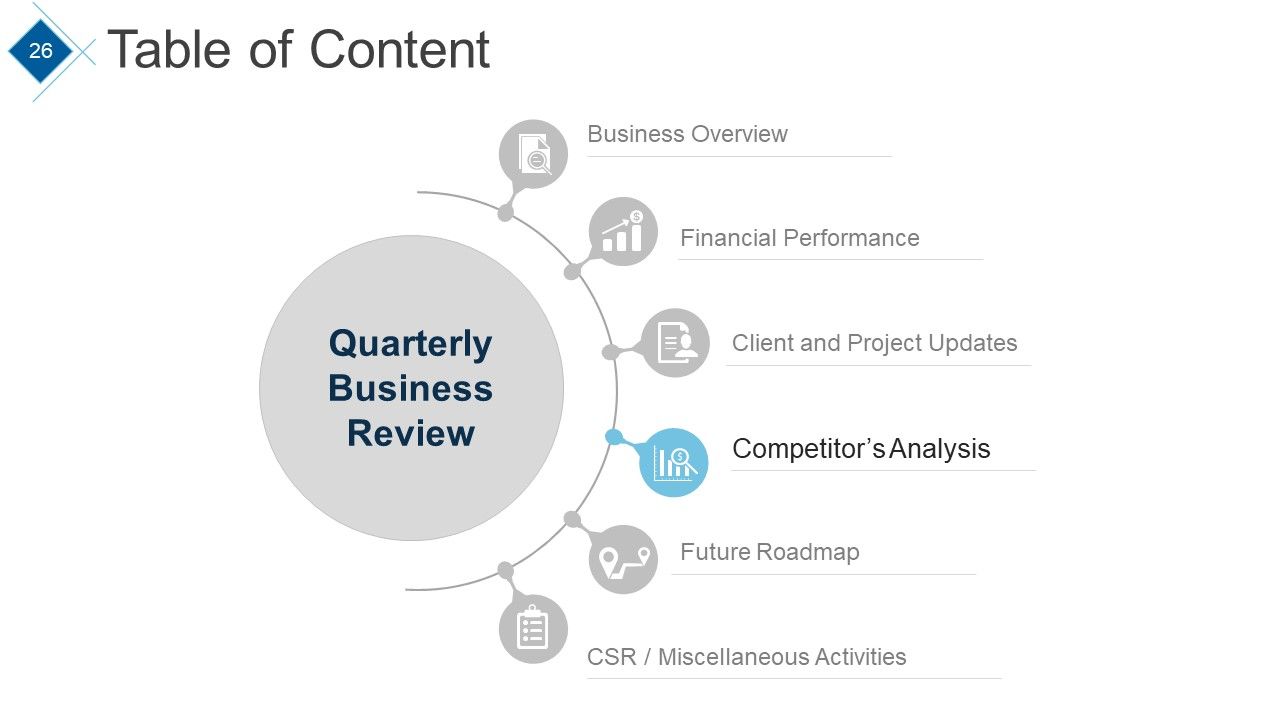
Slide 26: This slide showcases Table of Content with the highlighted point- Competitor’s Analysis.
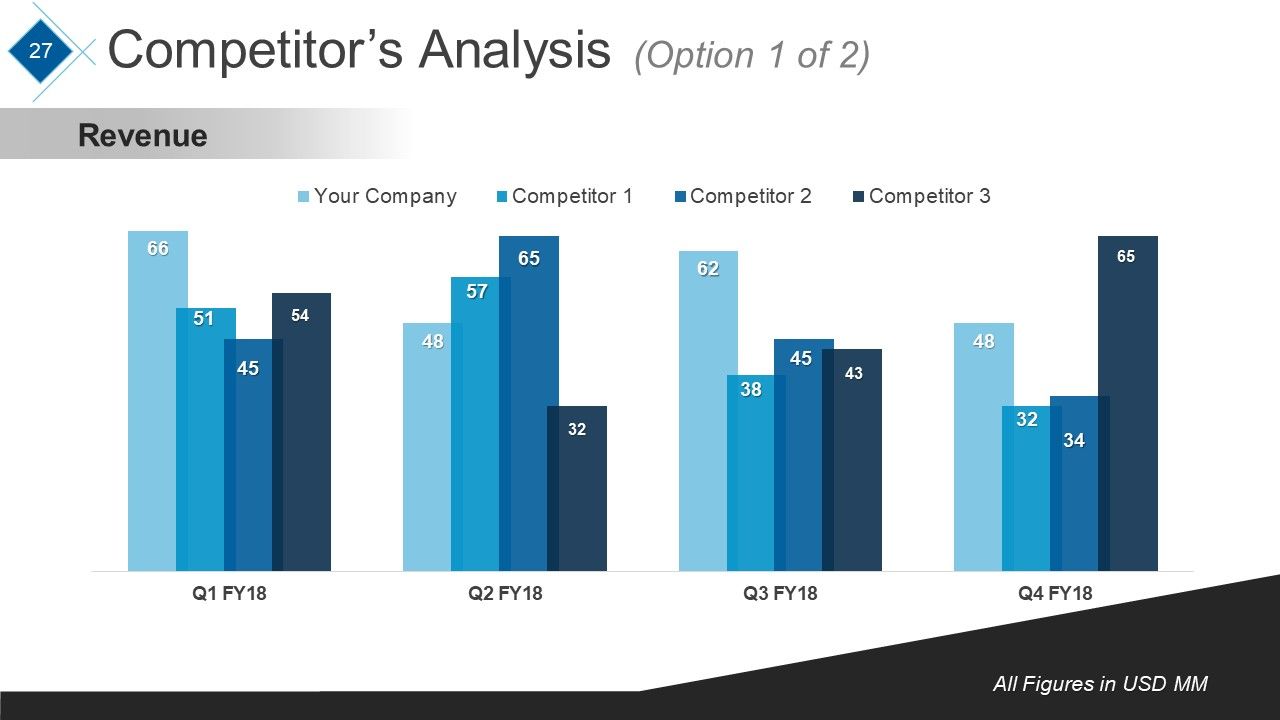
Slide 27: This slide presents Competitor’s Analysis graph of-0 Revenue.
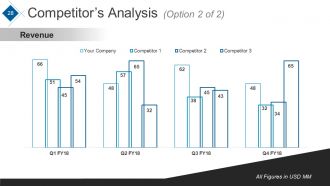
Slide 28: This slide presents another Competitor’s Analysis graph of-0 Revenue.
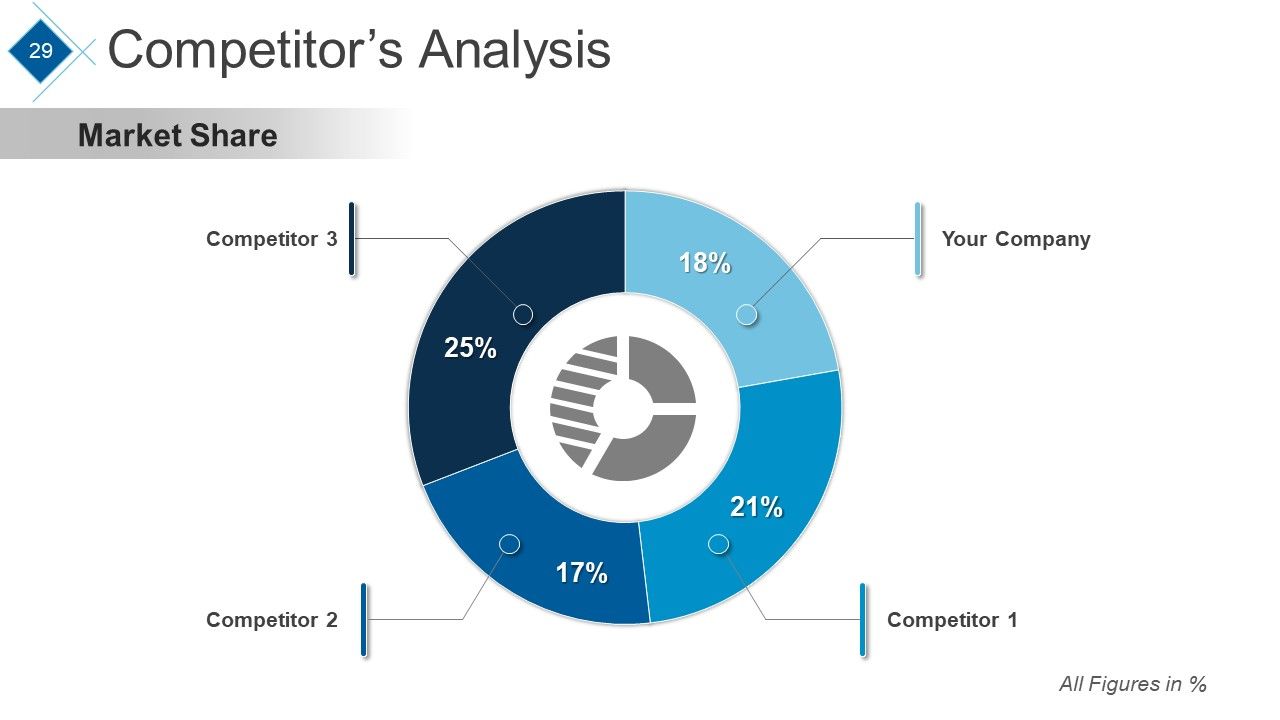
Slide 29: This slide presents Competitor’s Analysis Market Share.
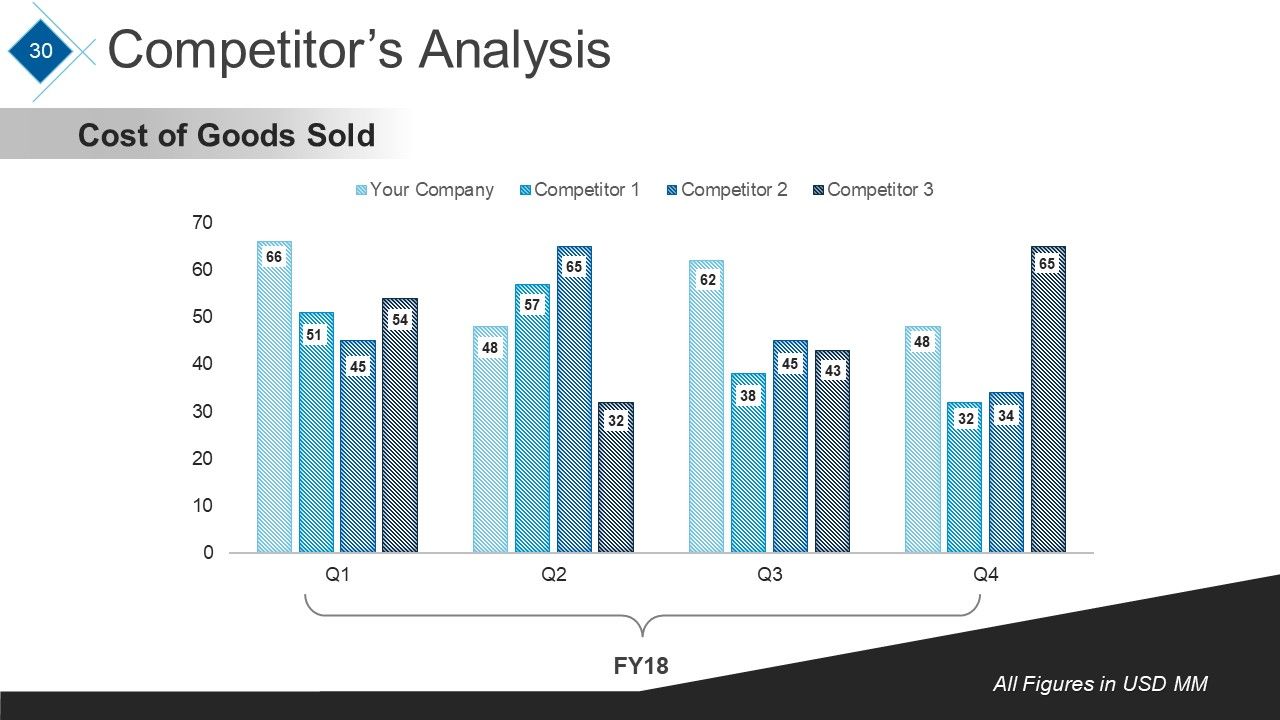
Slide 30: This slide presents Competitor’s Analysis graph of- Cost of Goods Sold.
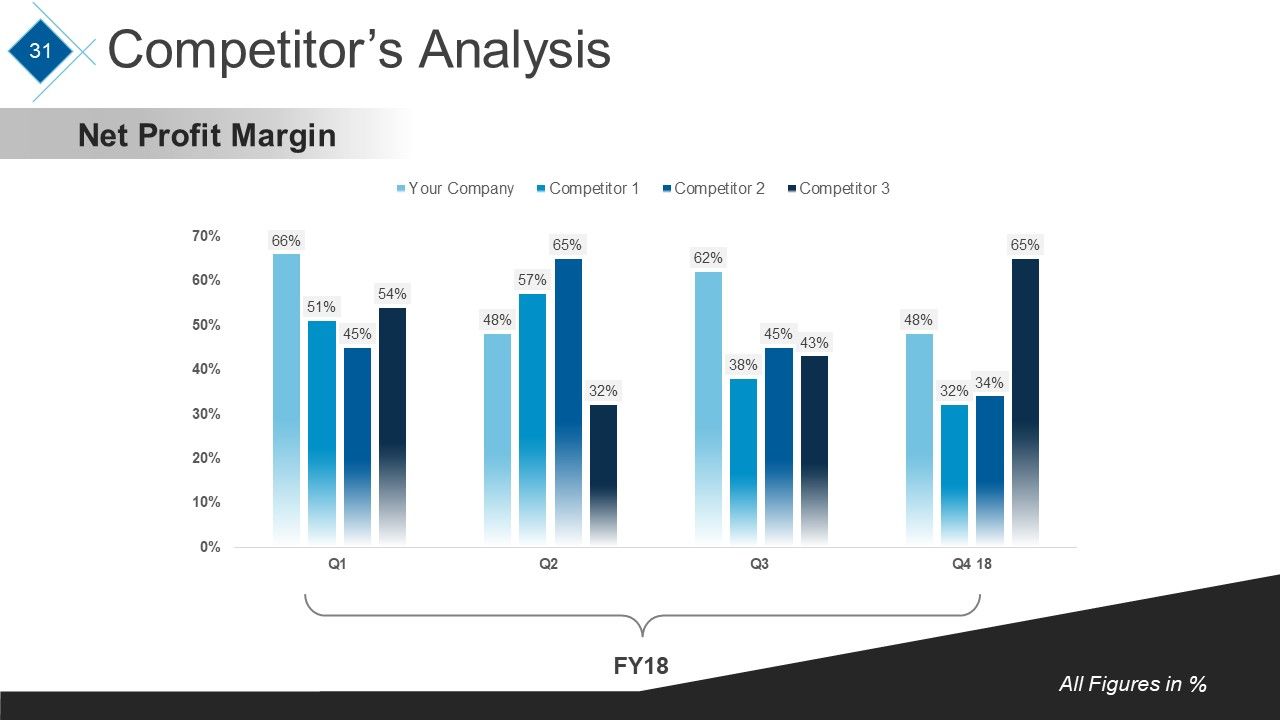
Slide 31: This slide presents Competitor’s Analysis graph of- Net Profit Margin.
Slide 32: This is Coffee Break Time slide to halt. You may change the slide content as per need.
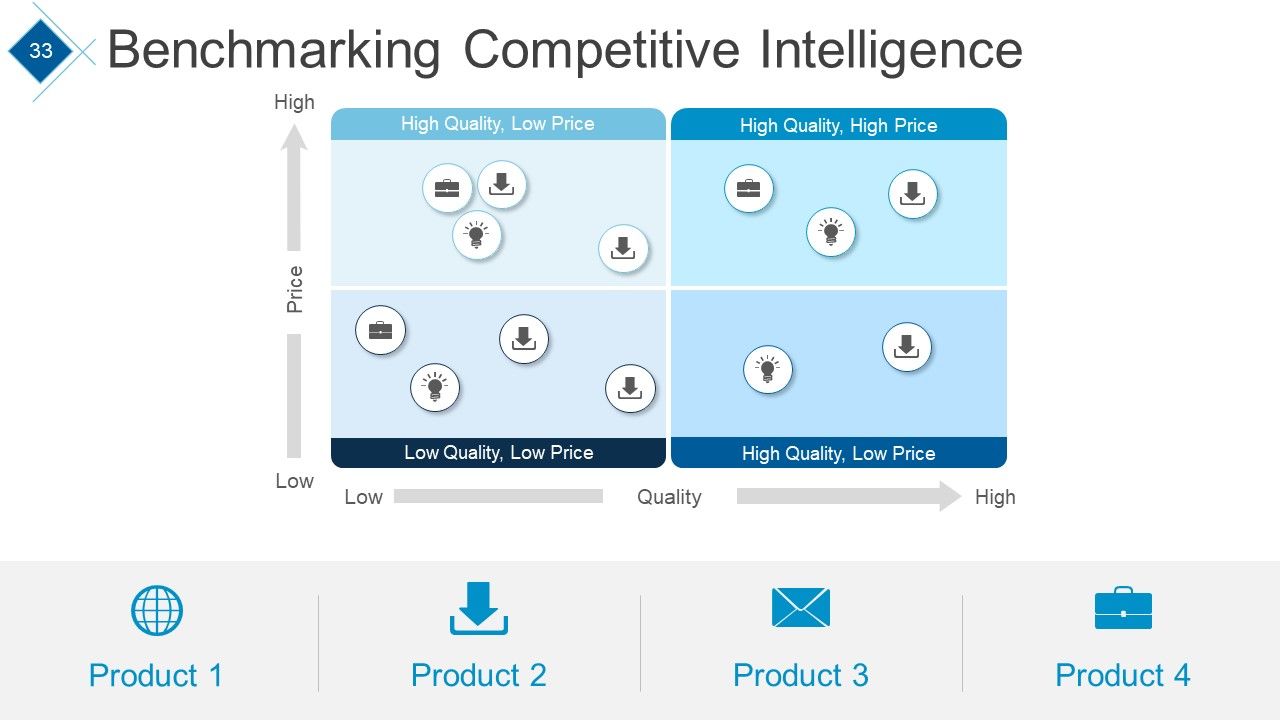
Slide 33: This slide shows Benchmarking Competitive Intelligence in terms of High and Low.
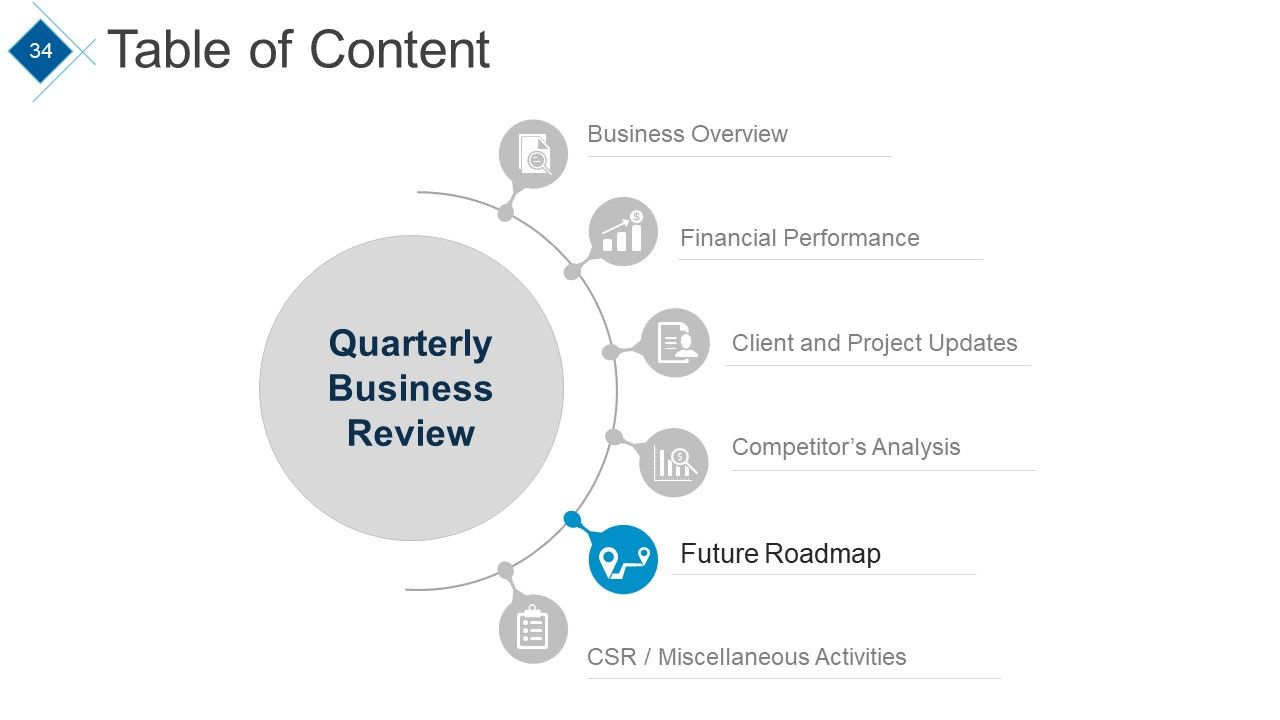
Slide 34: This slide presents Table of Content with the highlighted point- Future Roadmap.
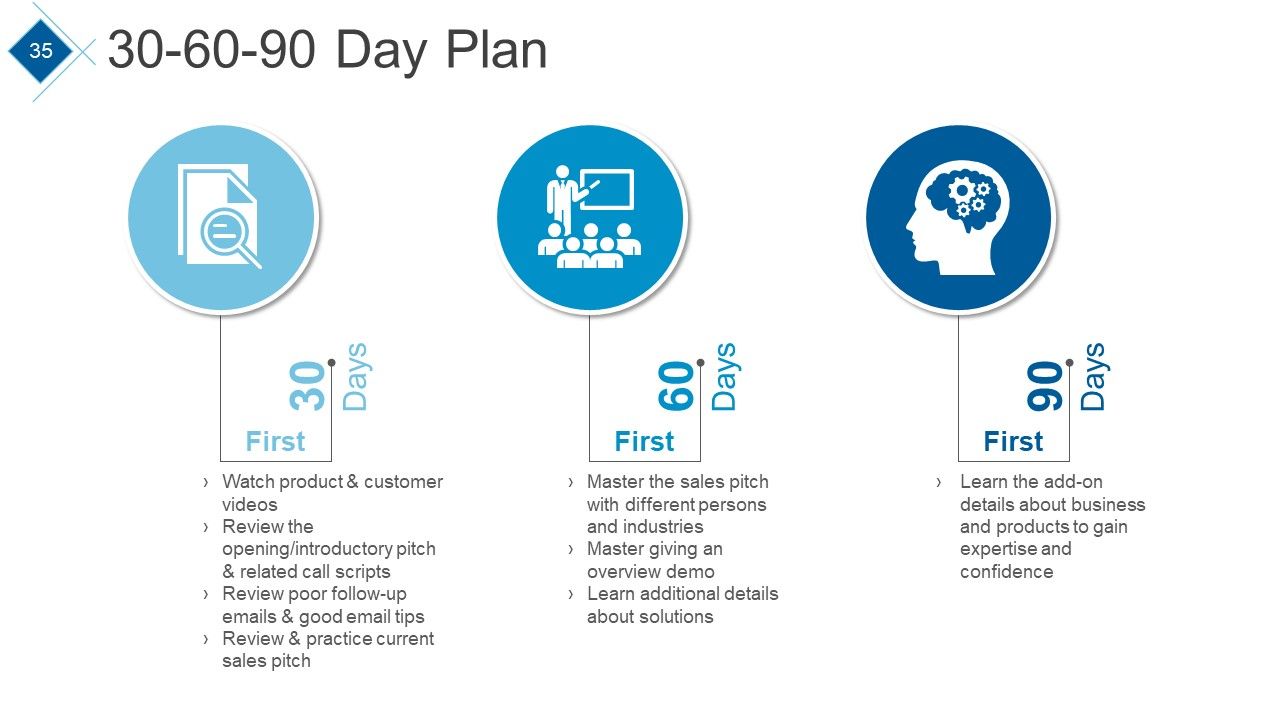
Slide 35: This slide displays 30-60-90 Day Plan with the following points- Watch product & customer videos, Review the opening/introductory pitch & related call scripts, Review poor follow-up emails & good email tips, Review & practice current sales pitch, Master the sales pitch with different persons and industries, Master giving an overview demo, Learn additional details about solutions, Learn the add-on details about business and products to gain expertise and confidence.
Slide 36: This slide shows Light Bulb With Time Planning Ideas image with text boxes.
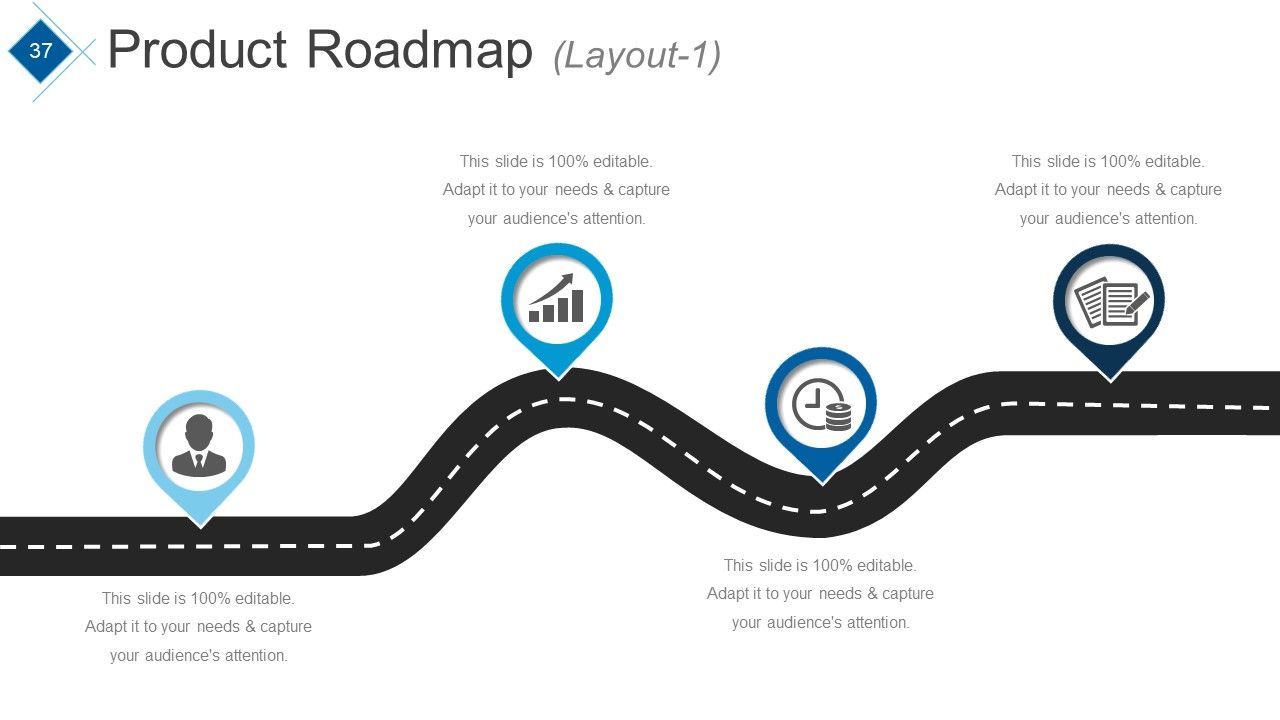
Slide 37: This is a Product Roadmap Layout slide.
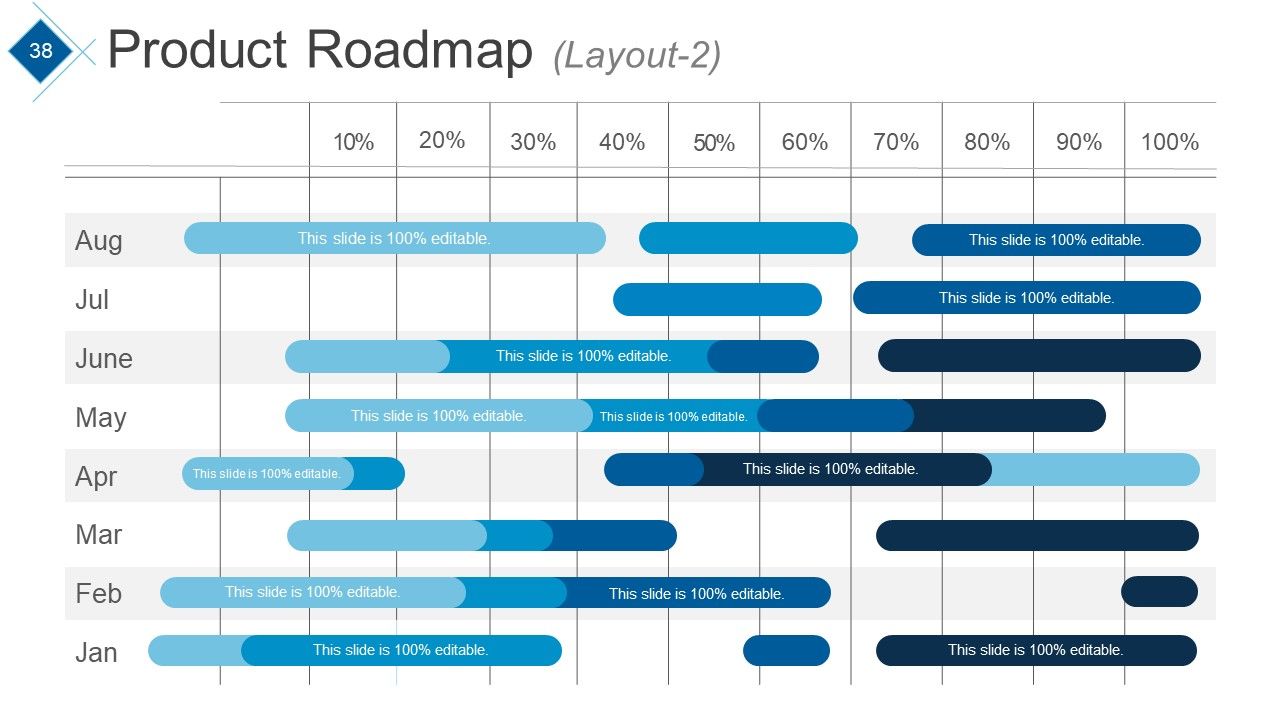
Slide 38: This is the second slideProduct Roadmap Layout.
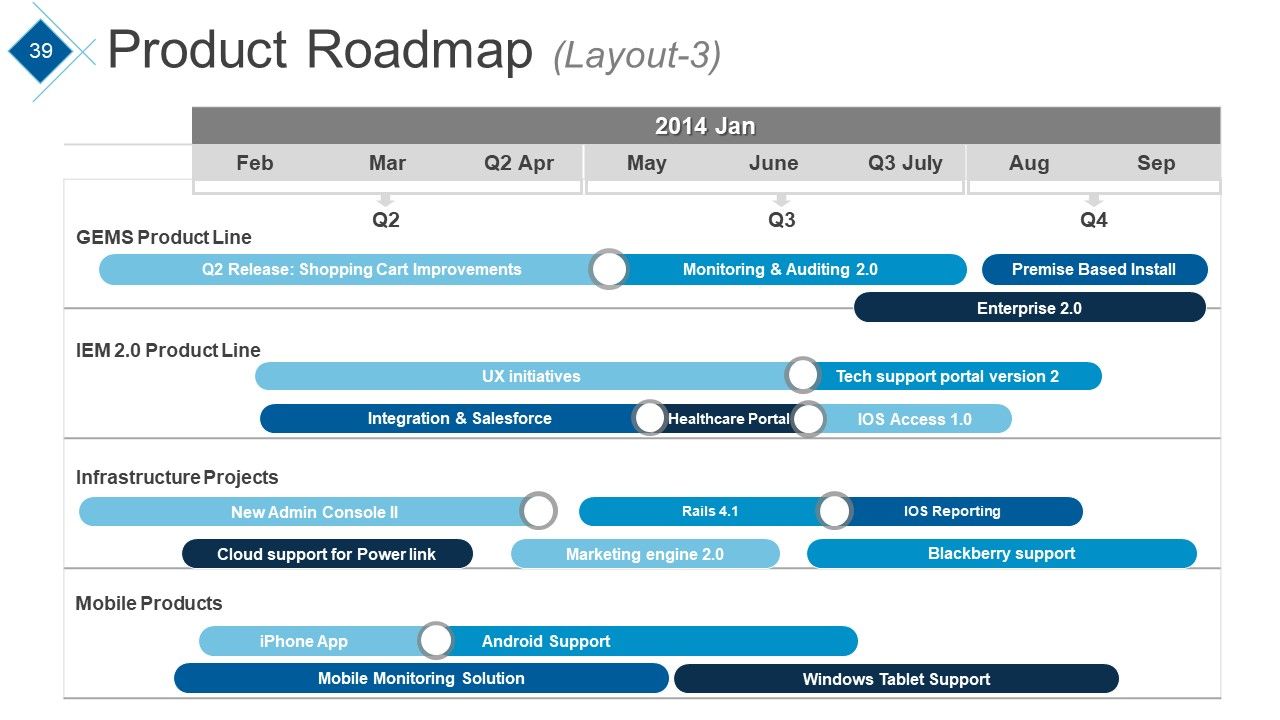
Slide 39: This slide presents a Product Roadmap in Swimlane form.
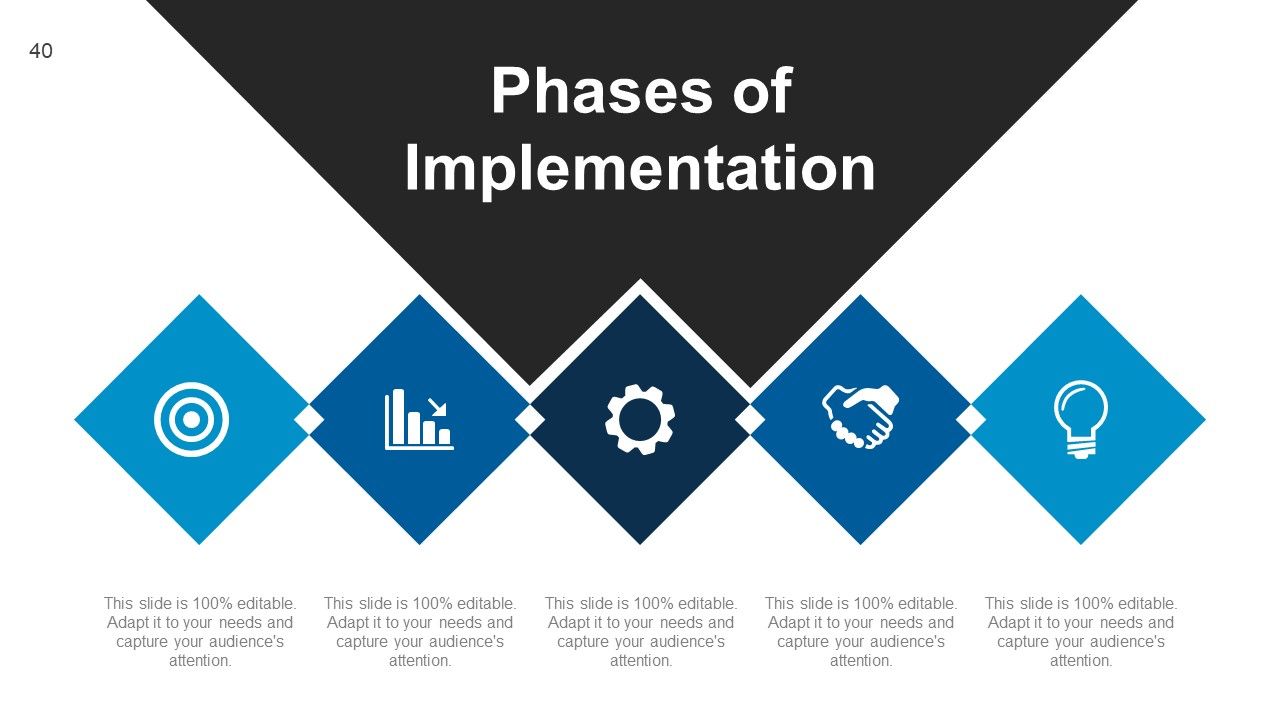
Slide 40: This slide shows Phases of Implementation.
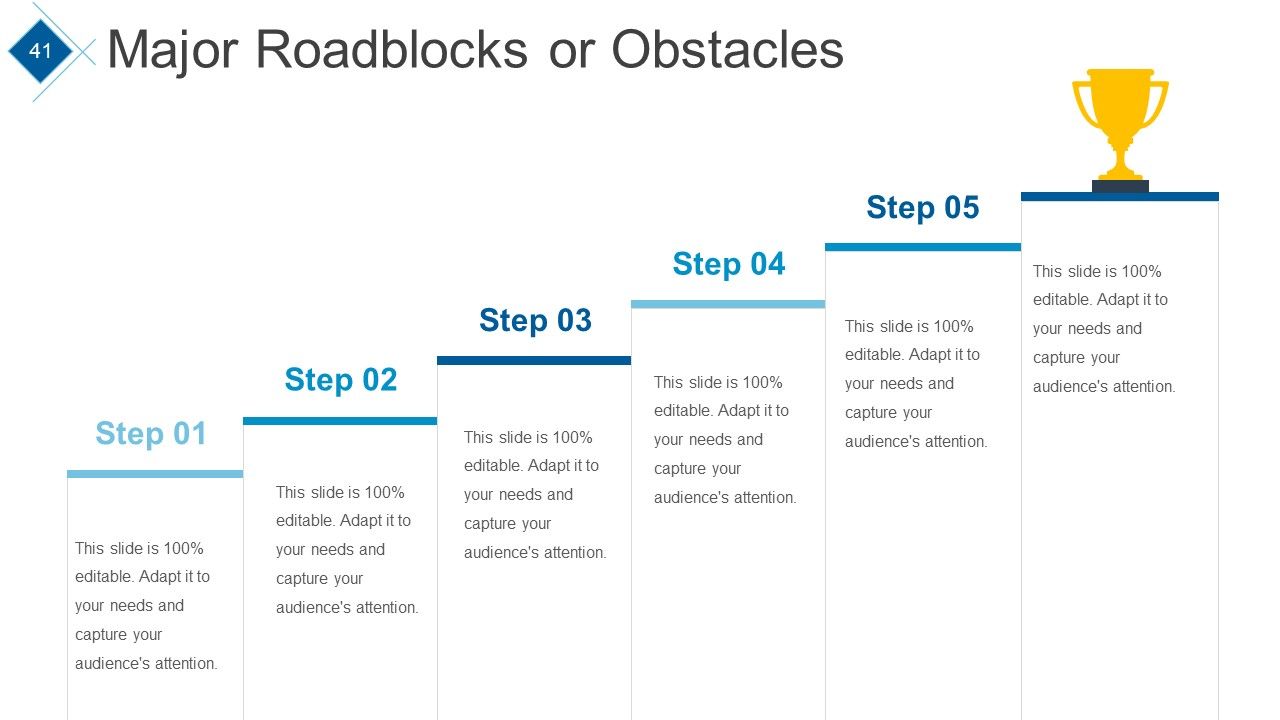
Slide 41: This slide showcases Major Roadblocks or Obstacles faced.
Slide 42: This slide showcases another variation image Major Roadblocks or Obstacles faced.
Slide 43: This slide displays SWOT Analysis For Personal Skills.
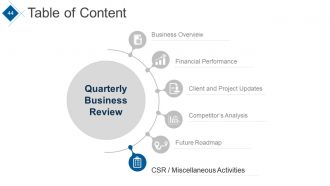
Slide 44: This slide showcases Table of Content with the highlighted point- CSR / Miscellaneous Activities
Slide 45: This slide shows Corporate Social Responsibility. State specifications etc. here.
Slide 46: This is an Icons Slide Quarterly Business Review Framework. Use them as per need.
Slide 47: This slide is titled Additional Slides to move forward.
Slide 48: This is a Vision slide with Mission and Goals. State them here.
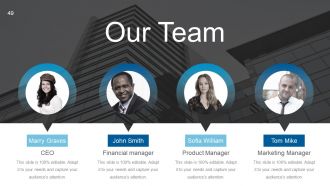
Slide 49: This is Our Team slide with names, deisgnation and image boxes.
Slide 50: This is an About Us slide. State team/company specifications etc. here.
Slide 51: This is My Goals slide. State goals etc. here.
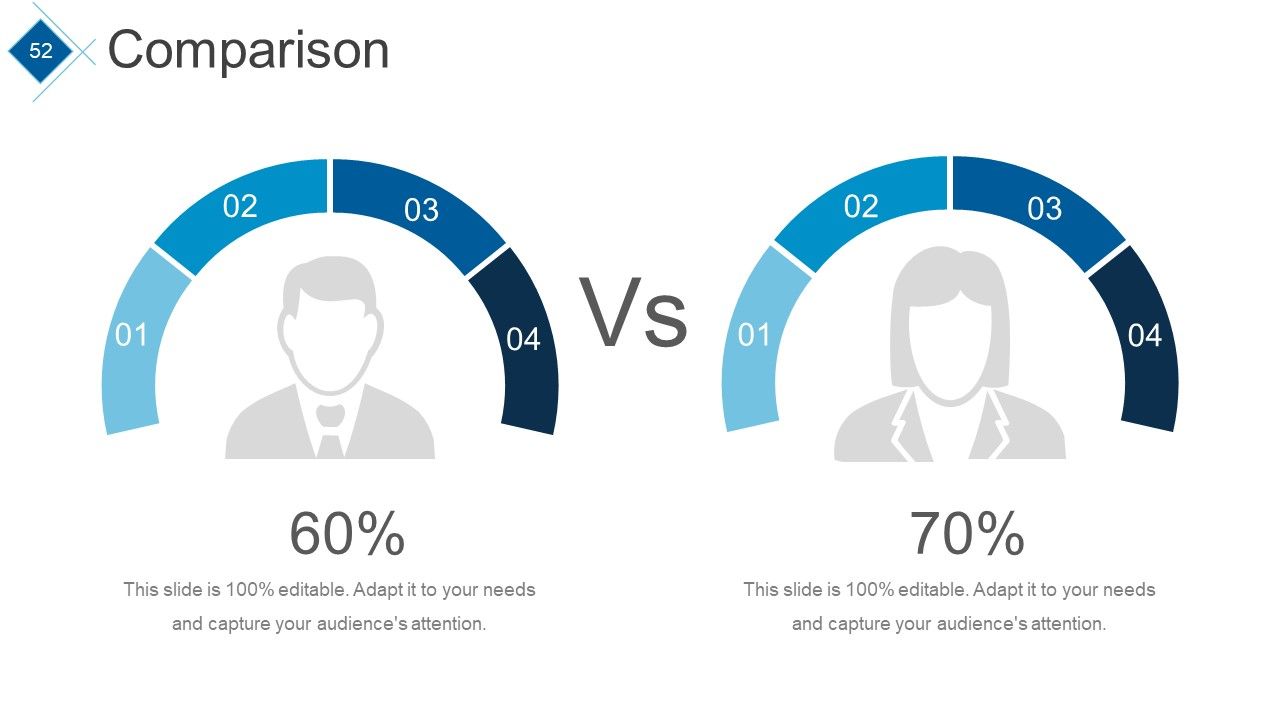
Slide 52: This is a Comparison slide to show comparison of entities etc.
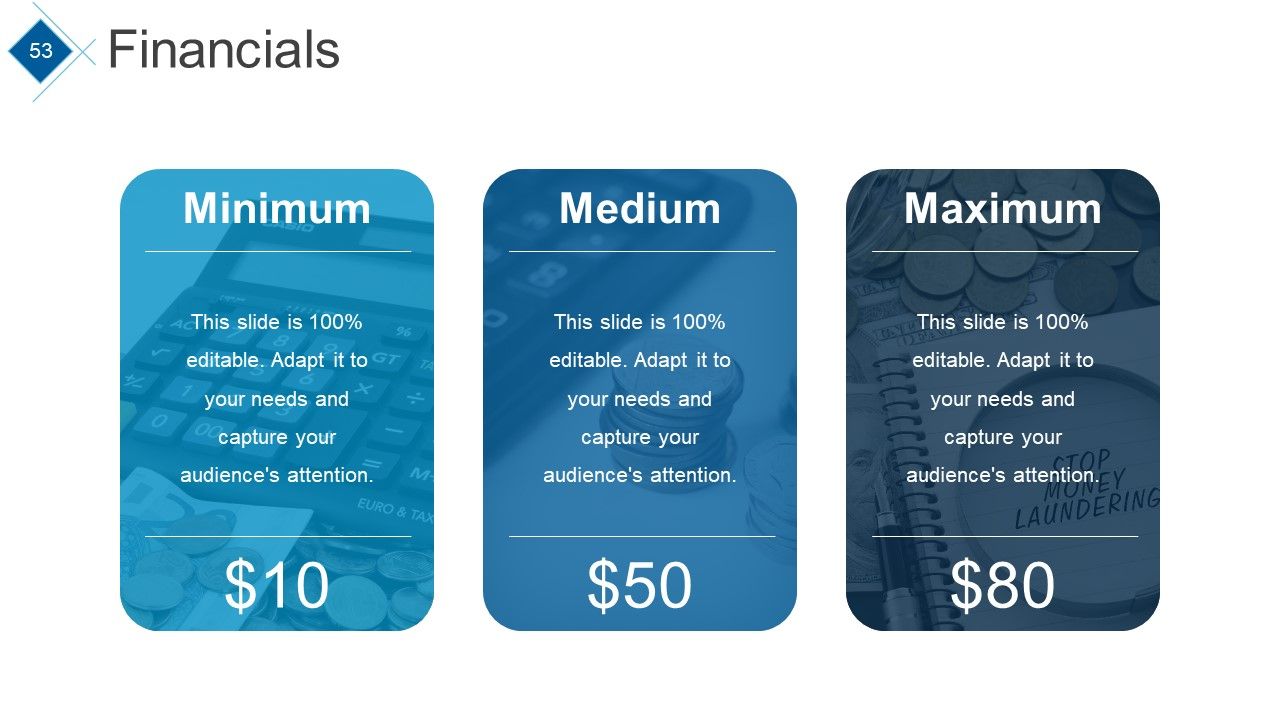
Slide 53: This is a Financials score slide to show financial aspects in terms of medium, minimum maximum.
Slide 54: This is a Quotes slide to convey company beliefs, messages etc.
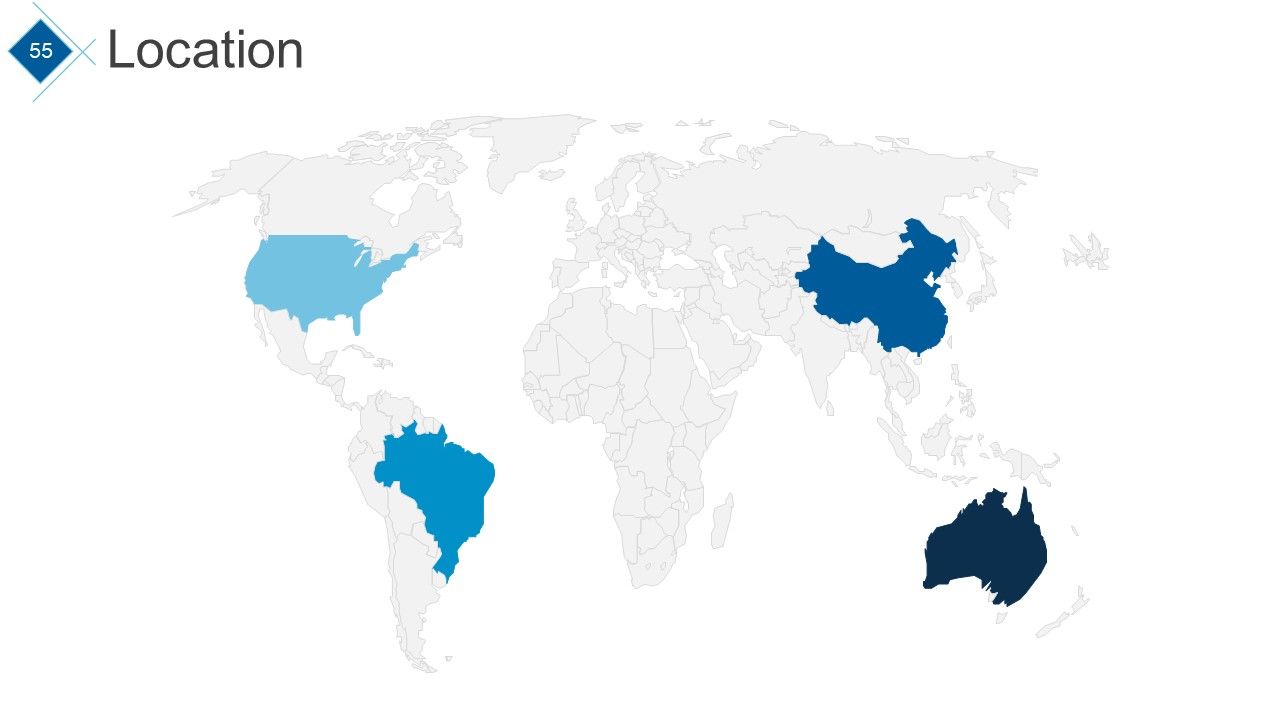
Slide 55: This is a Location slide to show global presence, growth etc.
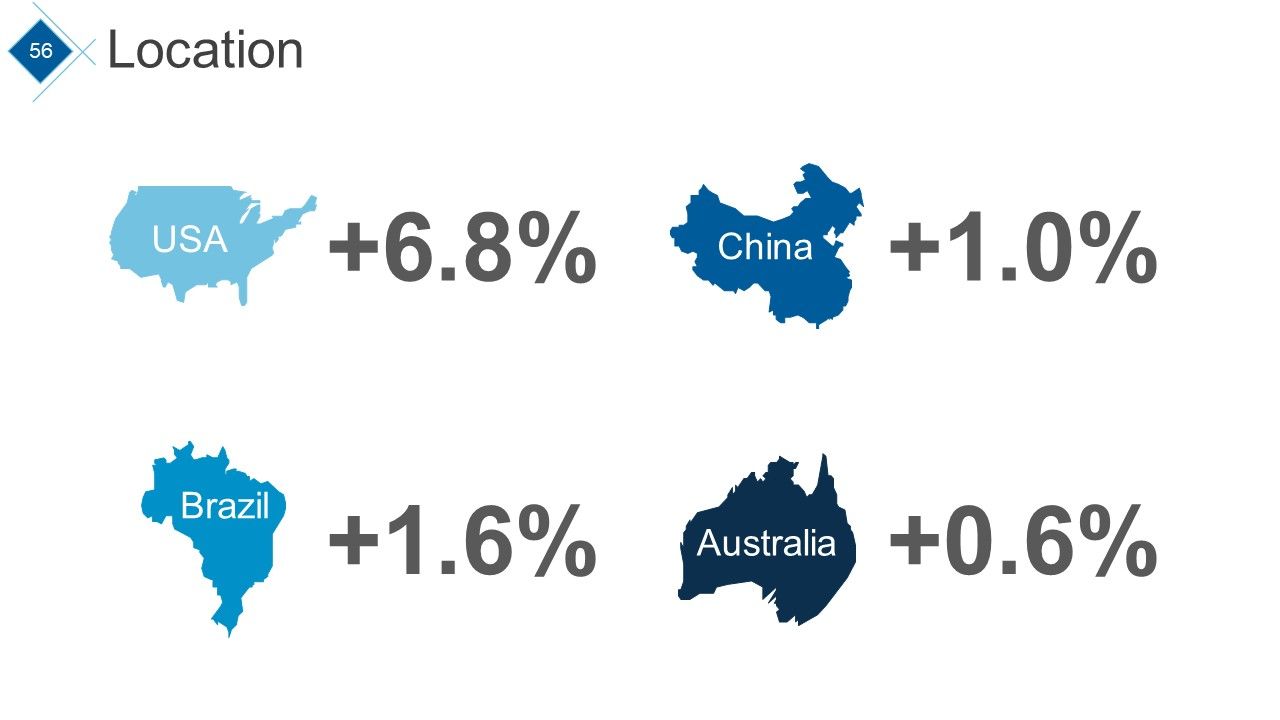
Slide 56: This is a Location slide showing different countries with percentage. State growth etc. in percentage here.
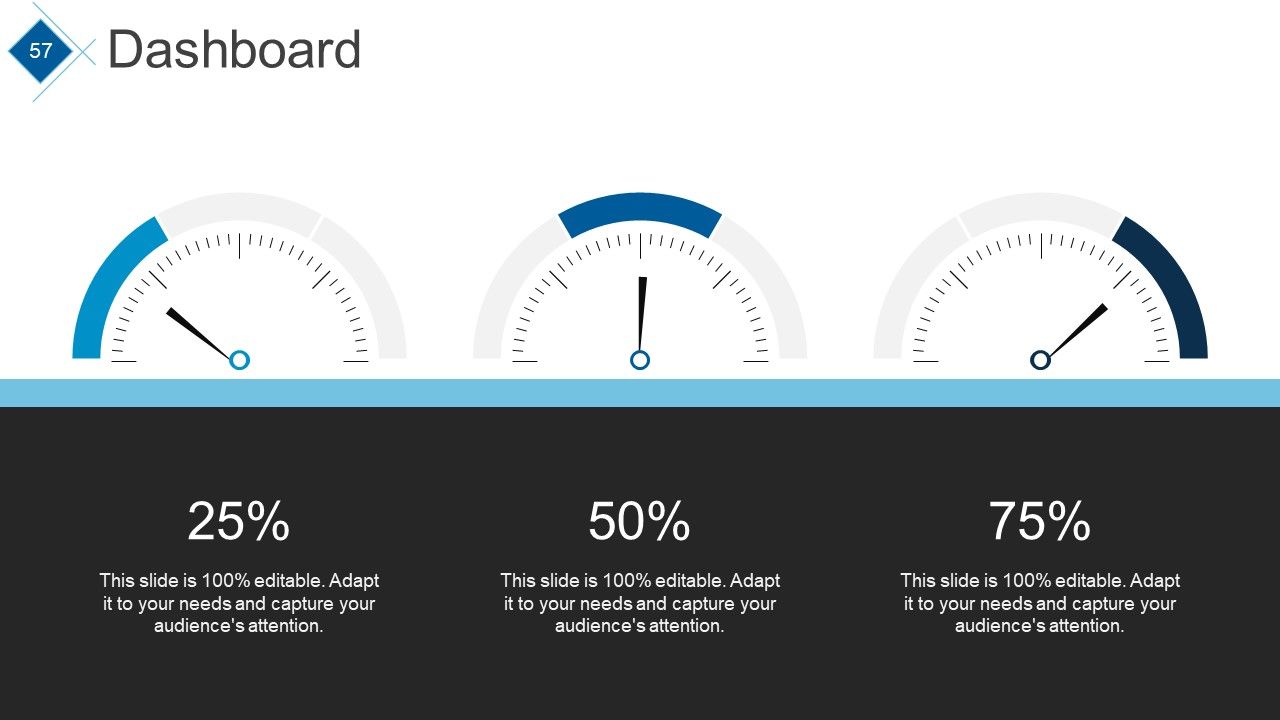
Slide 57: This is a Dashboard slide to show metrics, Kpis etc.
Slide 58: This is an Important Notes slide to show important/highlighted information etc.
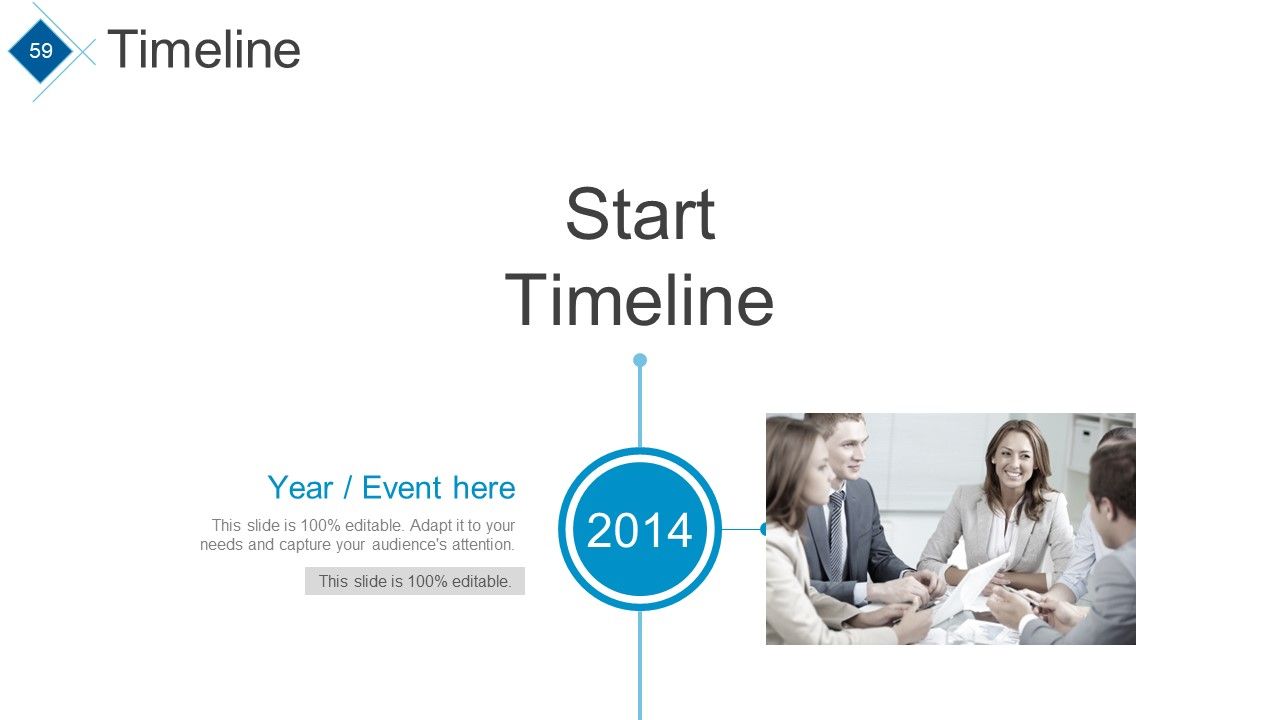
Slide 59: This slide shows a Timeline. State highligting factors etc. here.
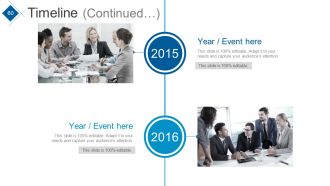
Slide 60: This slide also presents a Timeline. State highligting factors etc. here.
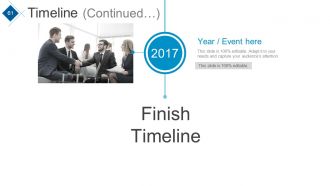
Slide 61: This slide too showcases a Timeline. State highligting factors etc. here.
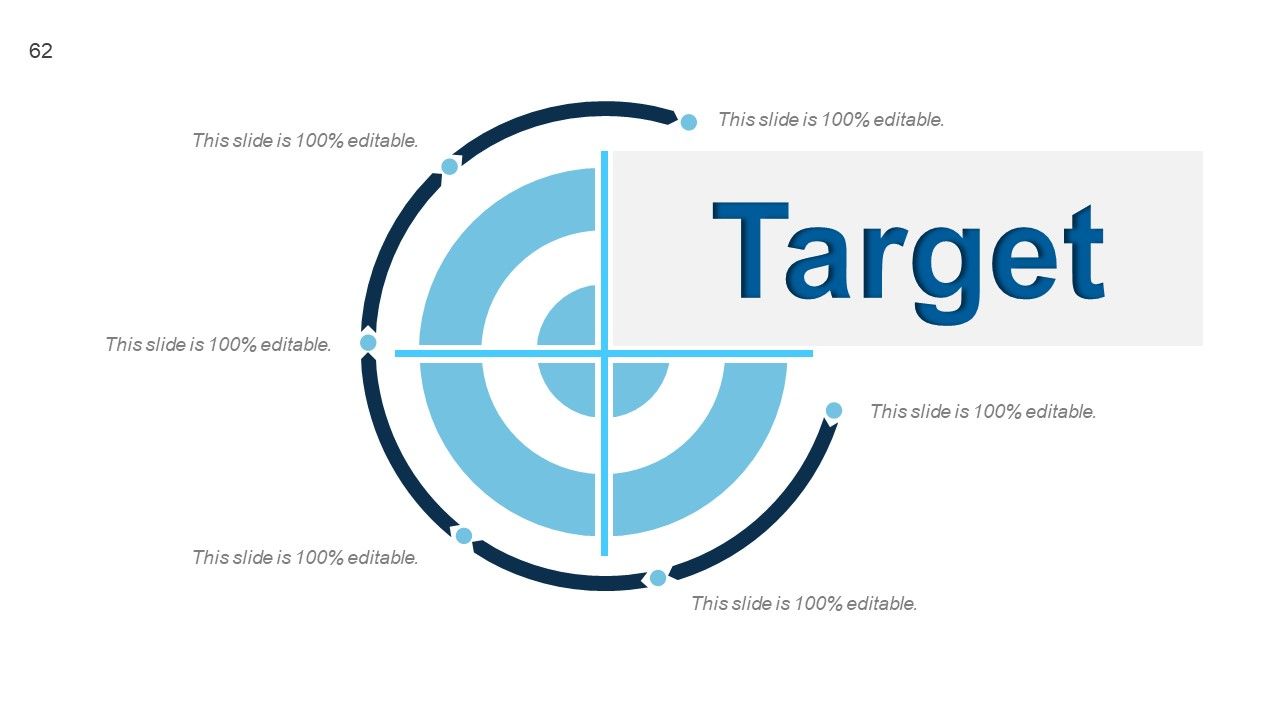
Slide 62: This is a Target image slide. State targets, goals, etc. here.
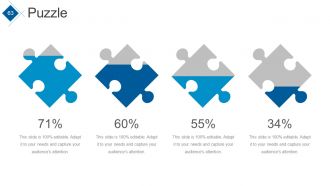
Slide 63: This is a Puzzle image slide. State information, specificiations etc. here.
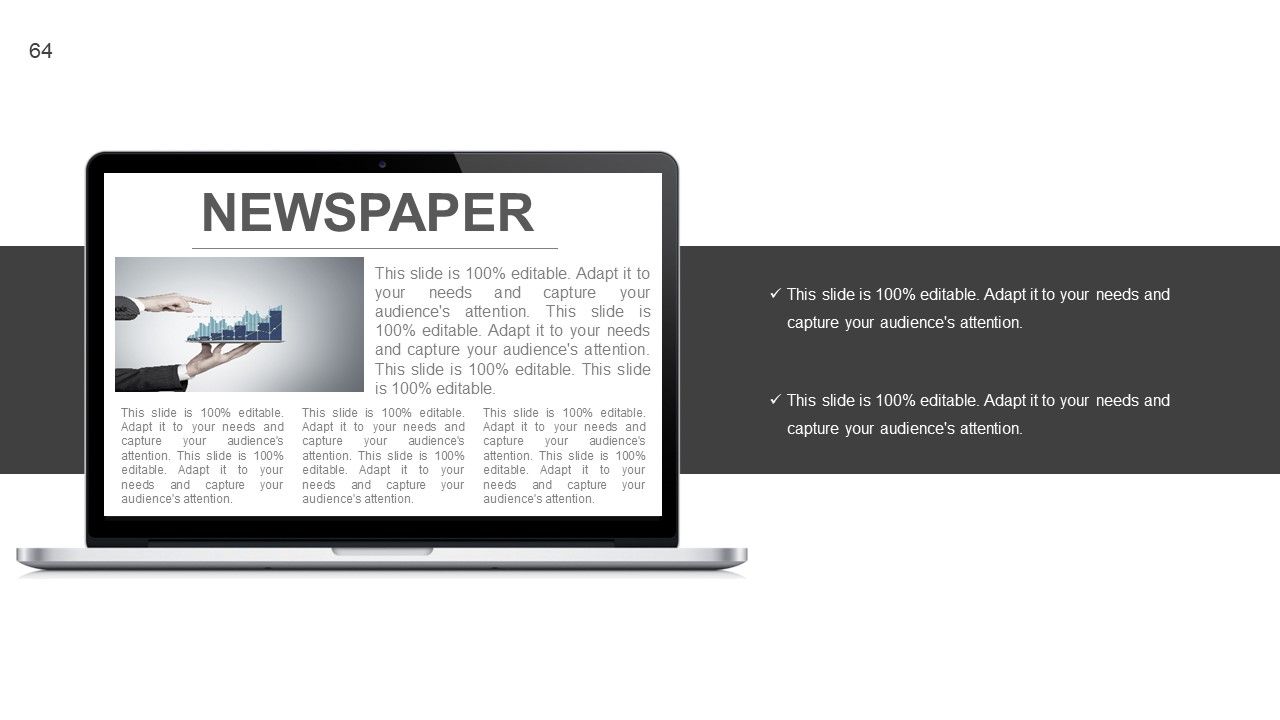
Slide 64: This is a Newspaper image slide. State news, events, etc. here. You can change the slide contents as per need.
Slide 65: This is a Mind map image slide. State information, specificiations etc. here.
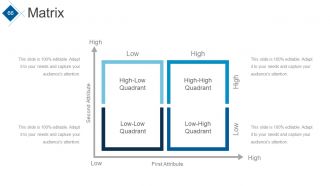
Slide 66: This is a Matrix image slide. State information, specificiations etc. in terms of high-low here.
Slide 67: This is a Lego image slide. State information, specificiations etc. here.
Slide 68: This is a Venn diagram image slide. State information, specificiations etc. here.
Slide 69: This slide is titled Our Charts to move forward.
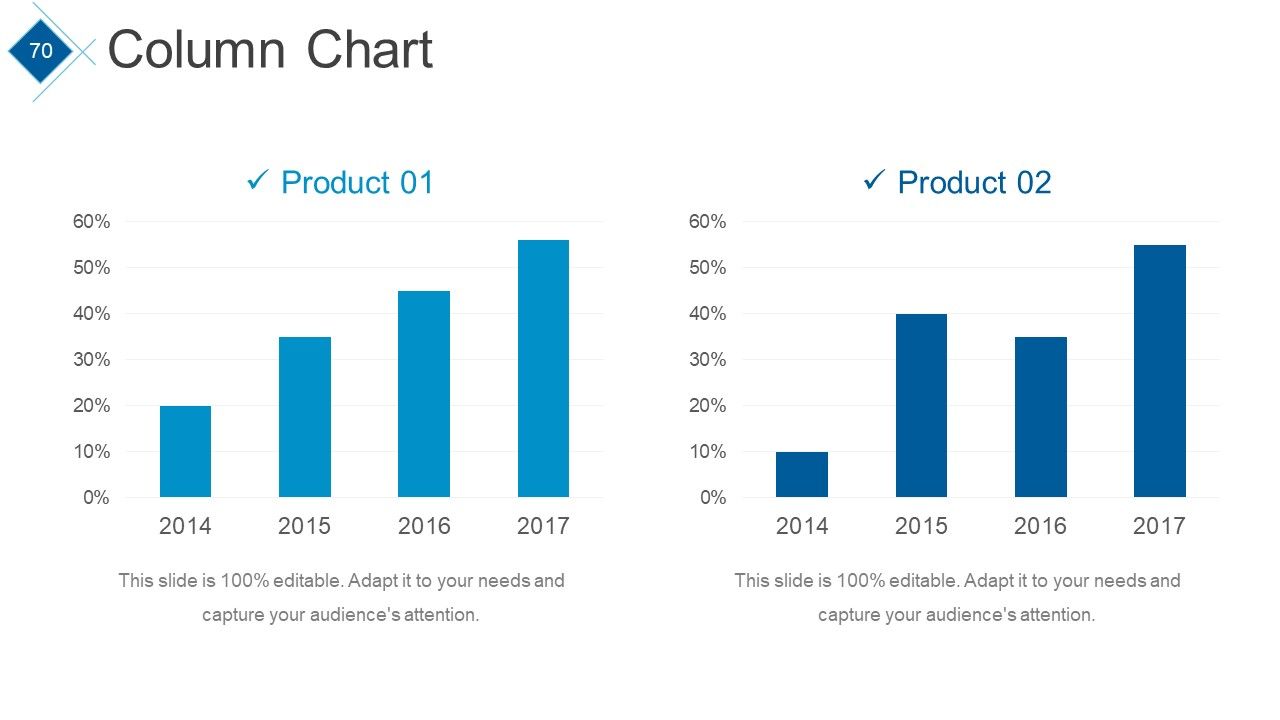
Slide 70: This slide presents a Column Chart for entity/product comparison.
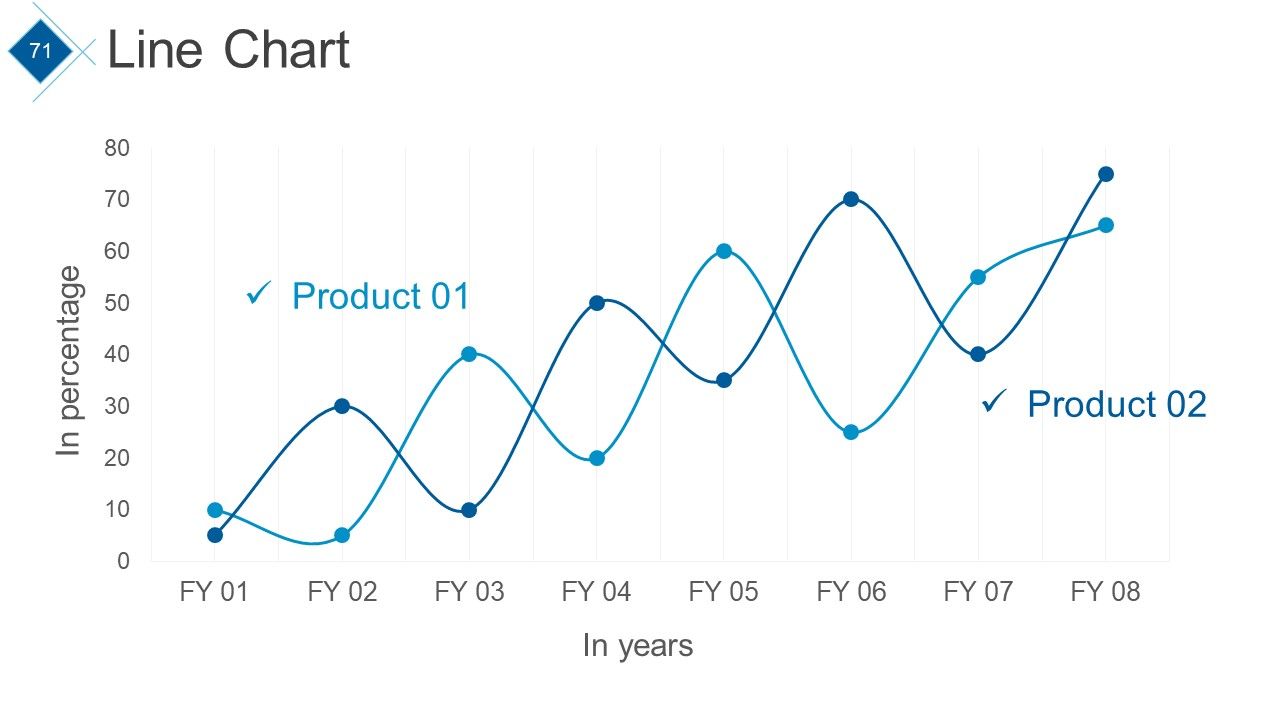
Slide 71: This slide presents a Line Chart for entity/product comparison.
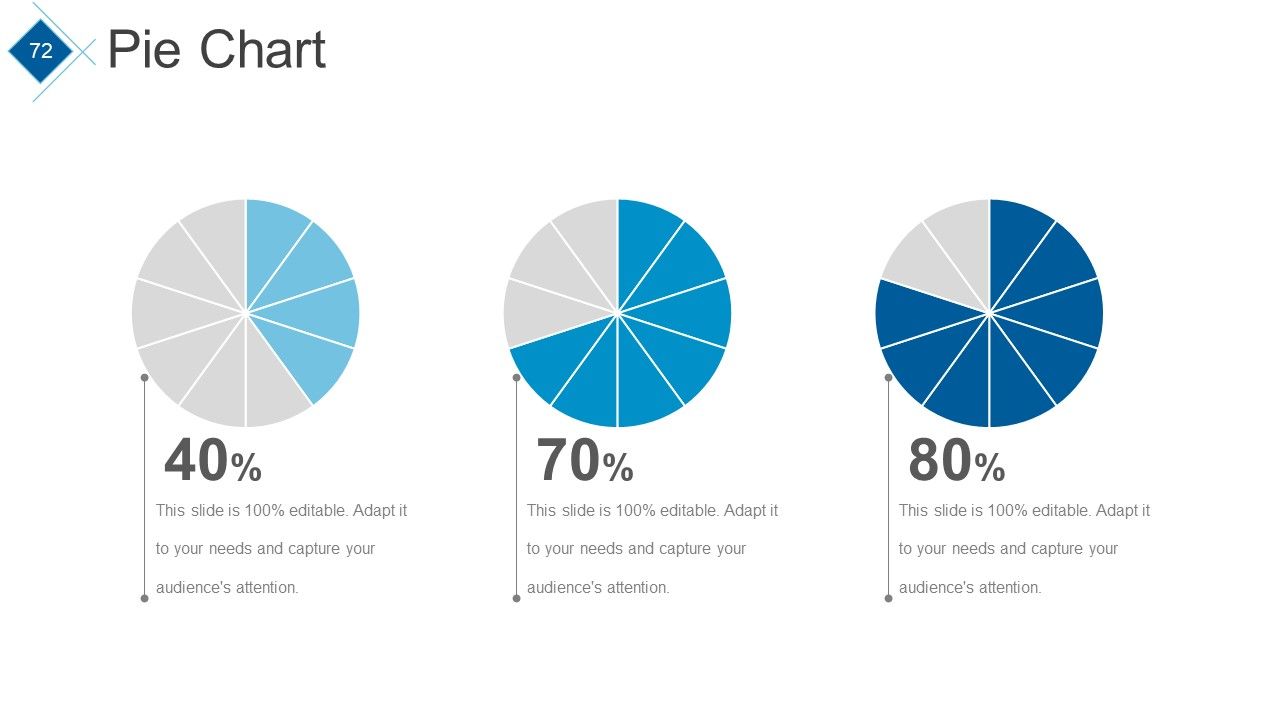
Slide 72: This slide presents a Pie Chart for entity/product comparison.
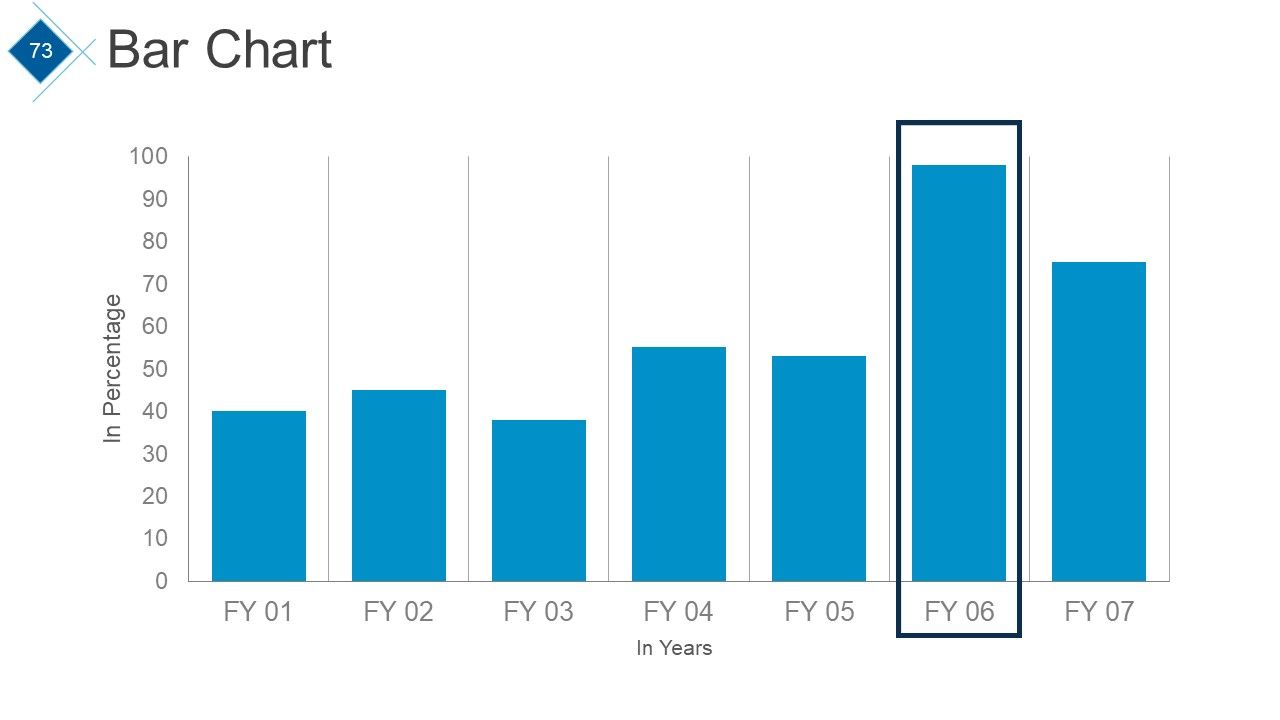
Slide 73: This slide presents a Bar Chart for entity/product comparison.
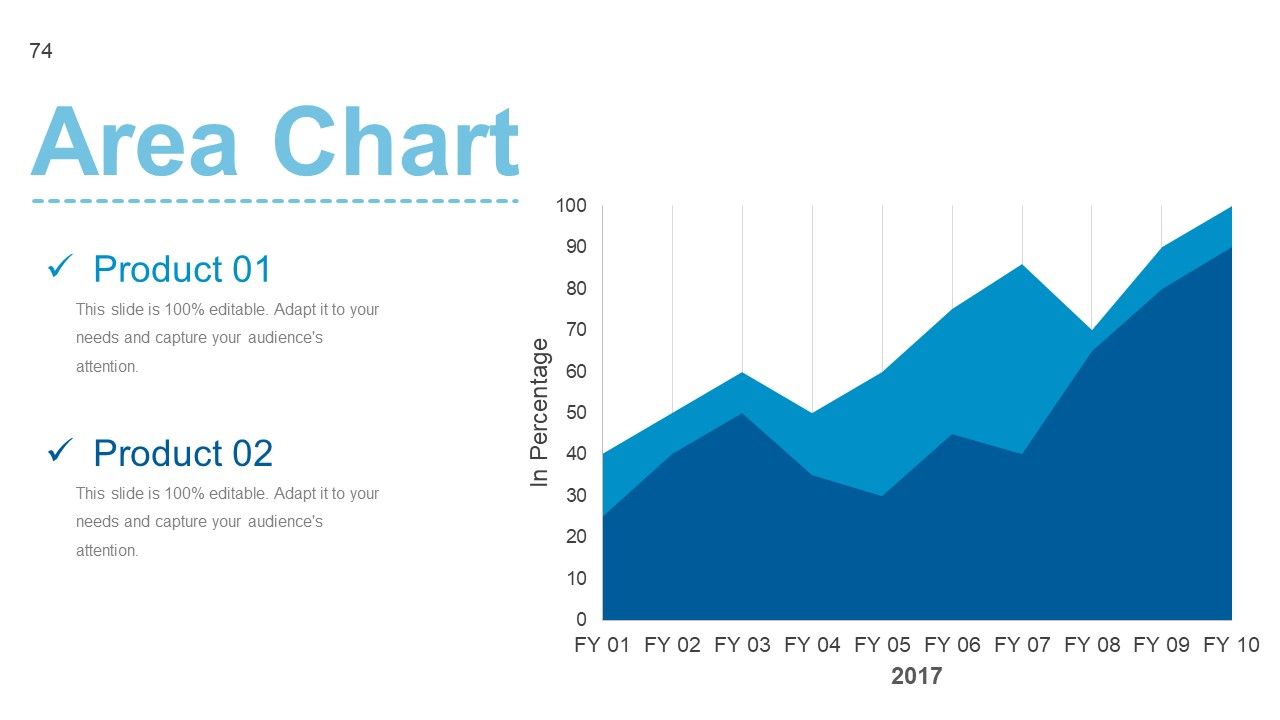
Slide 74: This slide presents an Area Chart for entity/product comparison.
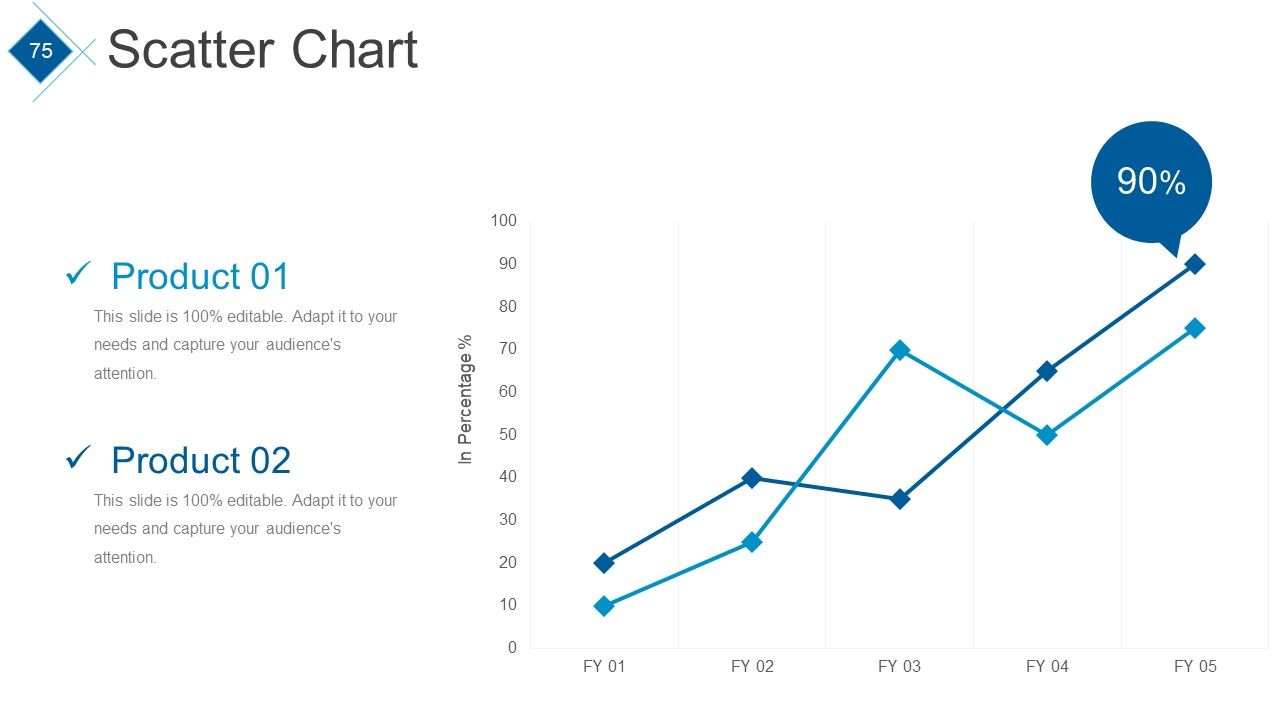
Slide 75: This slide presents a Scatter Chart for entity/product comparison.
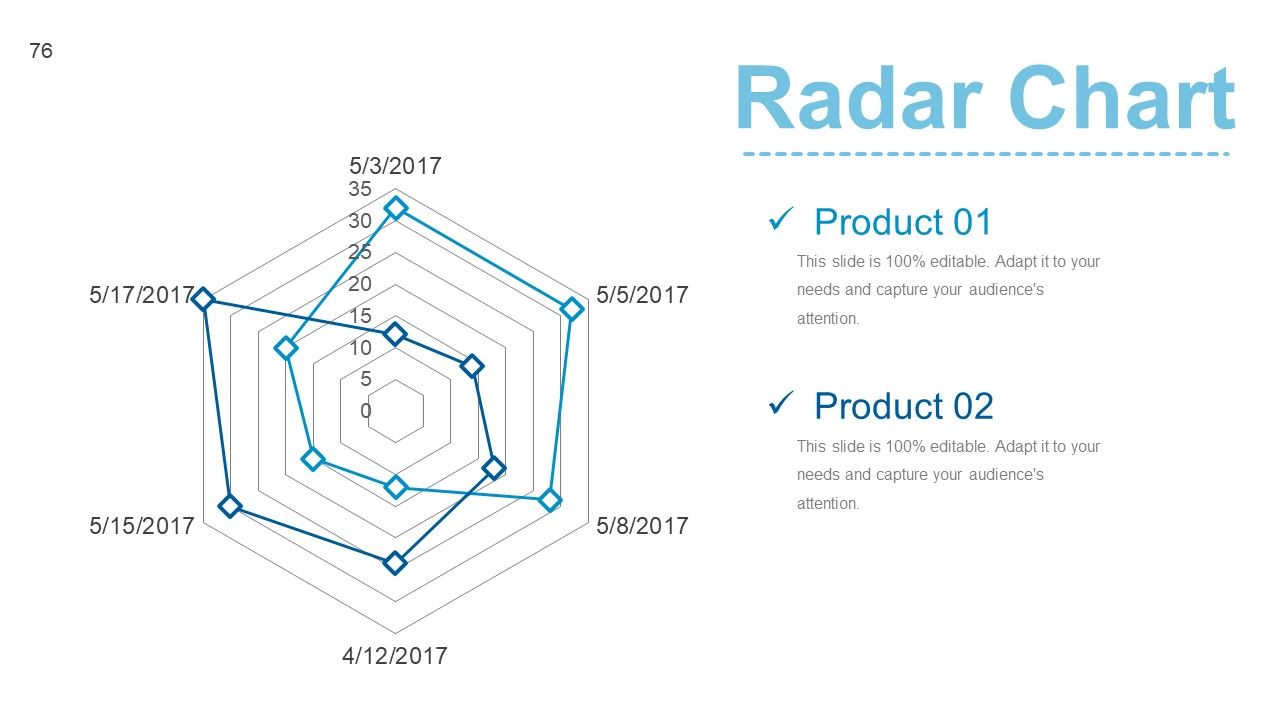
Slide 76: This slide presents a Radar Chart for entity/product comparison.
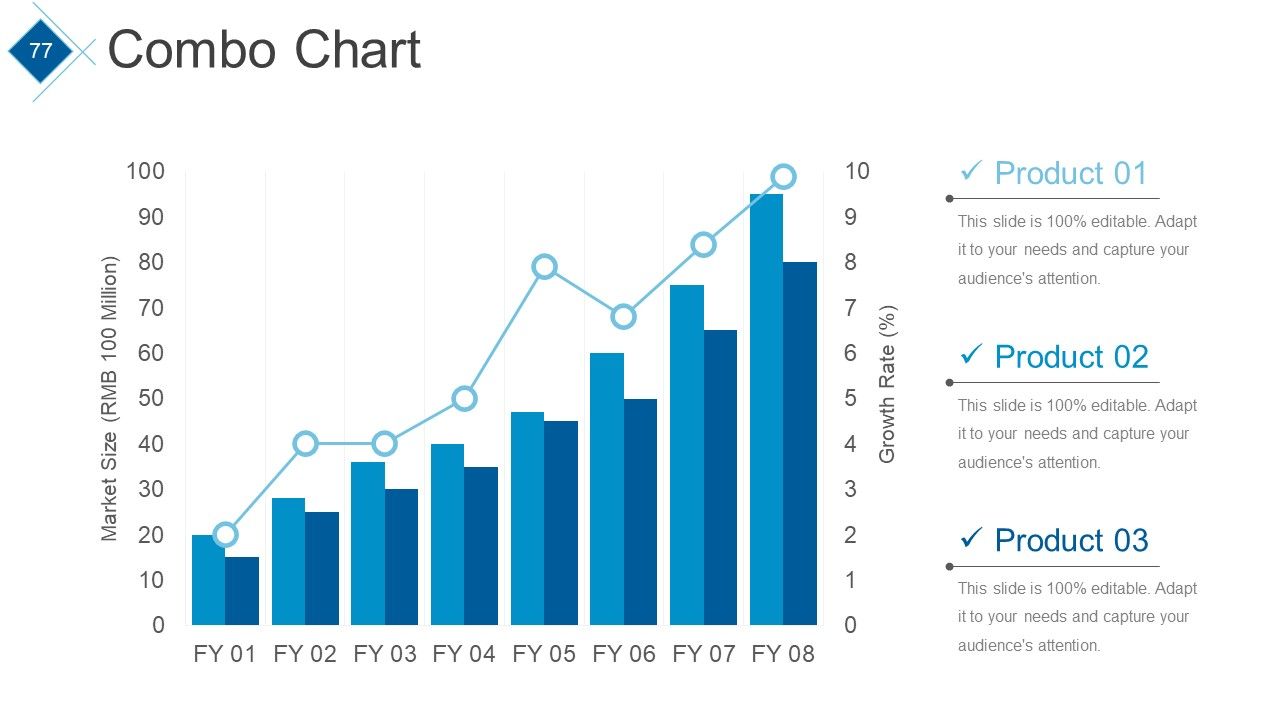
Slide 77: This slide presents a Combo Chart for entity/product comparison.
Slide 78: This is a Contact Us slide with Address# Street number, city, state, Email address, Contact numbers.
Slide 79: This is a Thank You slide for acknowledgement.
Quarterly Business Review Framework Powerpoint Presentation Slides with all 79 slides:
Put your thoughts on the line. Our Quarterly Business Review Framework Powerpoint Presentation Slides will take up the challenge.
FAQs
The Quarterly Business Review Framework is a framework used by companies to review their performance and progress every quarter. It includes an analysis of the company's financial performance, client and project updates, competitor analysis, and future roadmap.
The purpose of the Agenda slide is to outline the topics that will be covered during the Quarterly Business Review, such as assessing current performance, identifying critical issues, reinforcing accountability, and identifying and removing barriers.
The Financial Summary slide provides an overview of the company's financial performance during the quarter. It includes metrics such as net profit, EBITDA, net revenue, net profit margin, and Q-o-Q revenue growth.
The purpose of the Competitor's Analysis slide is to analyze the company's performance relative to its competitors. It includes graphs and charts of revenue, market share, cost of goods sold, and net profit margin.
The Key Financial Ratios slide provides an overview of the company's financial health by measuring key financial ratios such as P/E ratio, debt equity ratio, and current ratio. It also includes metrics such as return on assets, return on equity, return on investment, and return on assets.
-
Very well designed and informative templates.
-
Top Quality presentations that are easily editable.


