Sales and profitability decrease in a telecom company case competition complete deck
Our Sales And Profitability Decrease In A Telecom Company Case Competition Complete Deck are topically designed to provide an attractive backdrop to any subject. Use them to look like a presentation pro.
- Google Slides is a new FREE Presentation software from Google.
- All our content is 100% compatible with Google Slides.
- Just download our designs, and upload them to Google Slides and they will work automatically.
- Amaze your audience with SlideTeam and Google Slides.
-
Want Changes to This PPT Slide? Check out our Presentation Design Services
- WideScreen Aspect ratio is becoming a very popular format. When you download this product, the downloaded ZIP will contain this product in both standard and widescreen format.
-

- Some older products that we have may only be in standard format, but they can easily be converted to widescreen.
- To do this, please open the SlideTeam product in Powerpoint, and go to
- Design ( On the top bar) -> Page Setup -> and select "On-screen Show (16:9)” in the drop down for "Slides Sized for".
- The slide or theme will change to widescreen, and all graphics will adjust automatically. You can similarly convert our content to any other desired screen aspect ratio.
Compatible With Google Slides

Get This In WideScreen
You must be logged in to download this presentation.
PowerPoint presentation slides
Presenting our Sales And Profitability Decrease In A Telecom Company Case Competition Complete Deck. This is a 100% editable and adaptable PPT slide. You can save it in different formats like PDF, JPG, and PNG. It can be edited with different colors, fonts, font sizes, and font types of the template as per your requirements. This template supports the standard (4:3) and widescreen (16:9) format. It is also compatible with Google Slides.
People who downloaded this PowerPoint presentation also viewed the following :
Content of this Powerpoint Presentation
Slide 1: This is a cover slide of Sales And Profitability Decrease In A Telecom Company (Case Competition) PowerPoint Presentation.
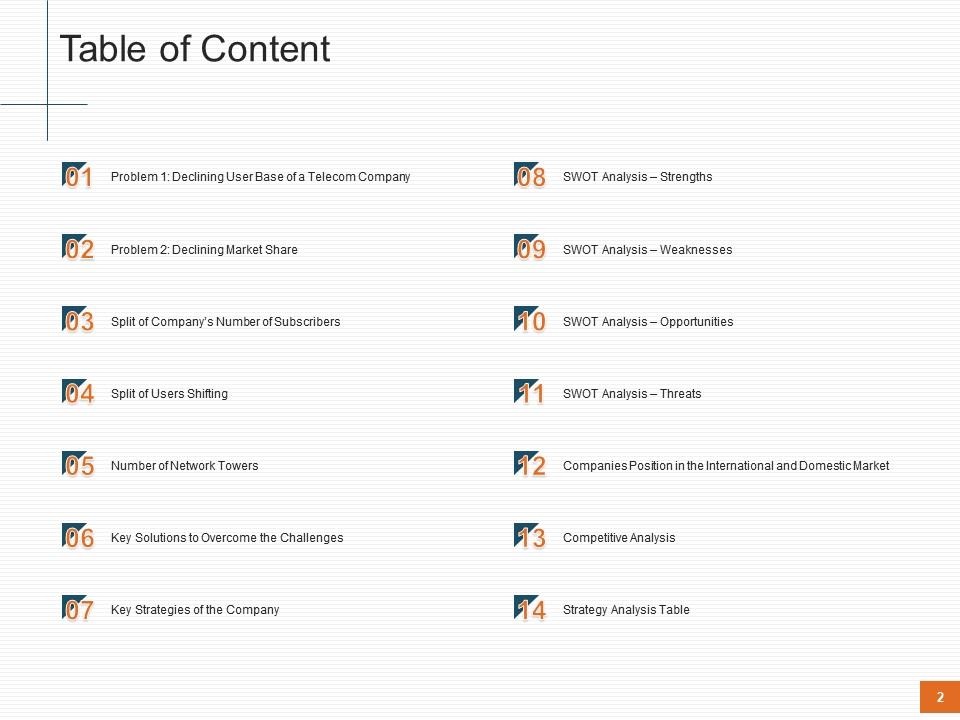
Slide 2: This is the Table of Contents slide that lists out all the essential elements covered in the deck.
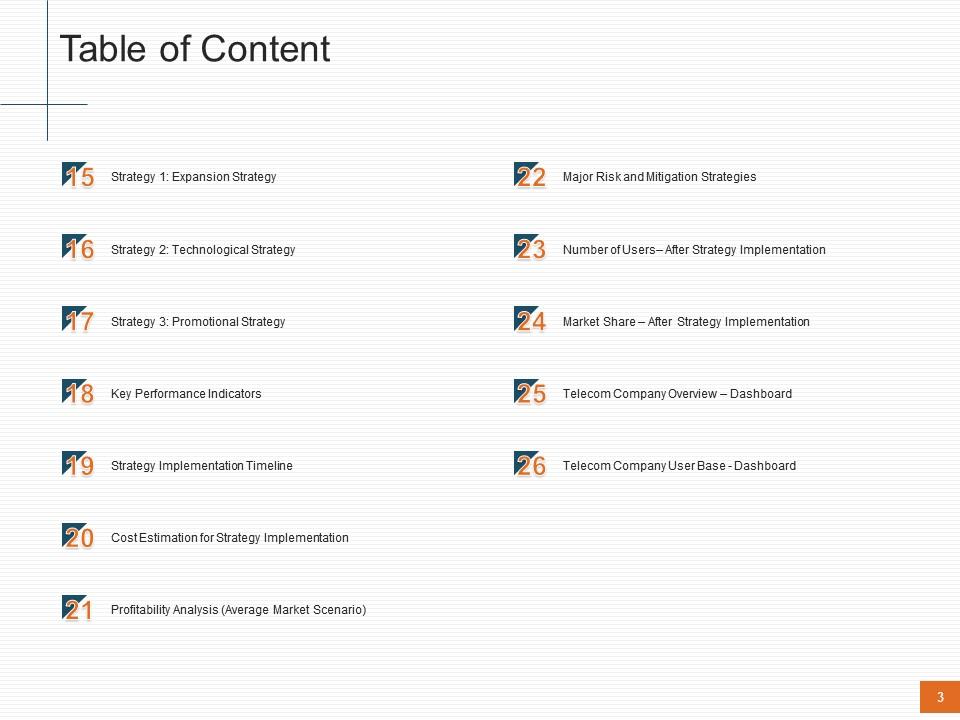
Slide 3: This is the Table of Contents slide that lists out all the essential elements covered in the deck.
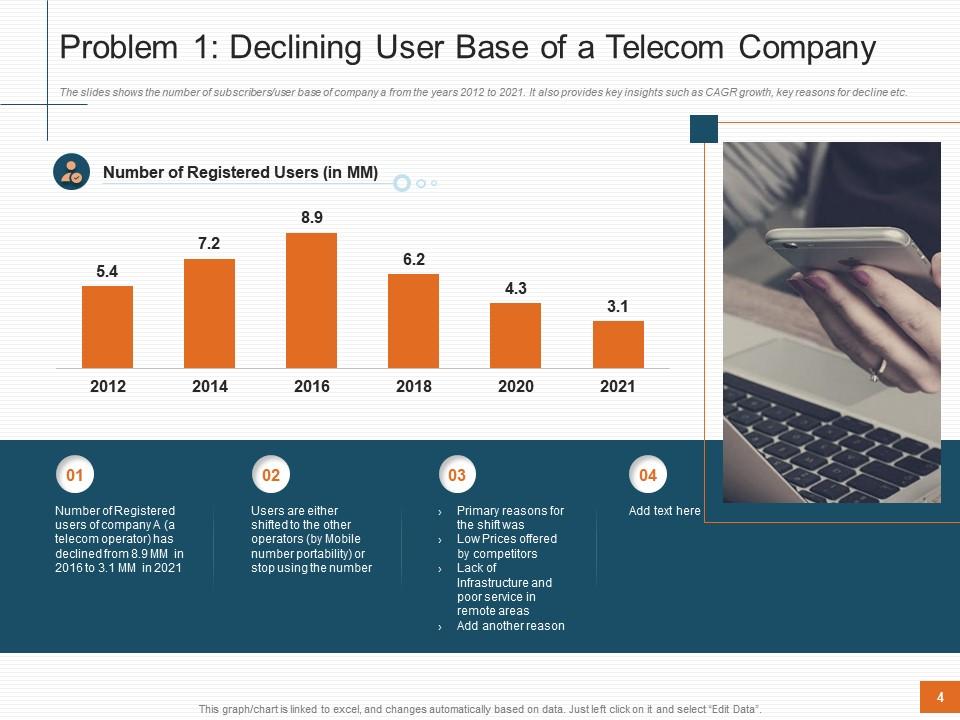
Slide 4: This slide presents Number of Registered users of company A (a telecom operator) has declined from 8.9 MM in 2016 to 3.1 MM in 2021
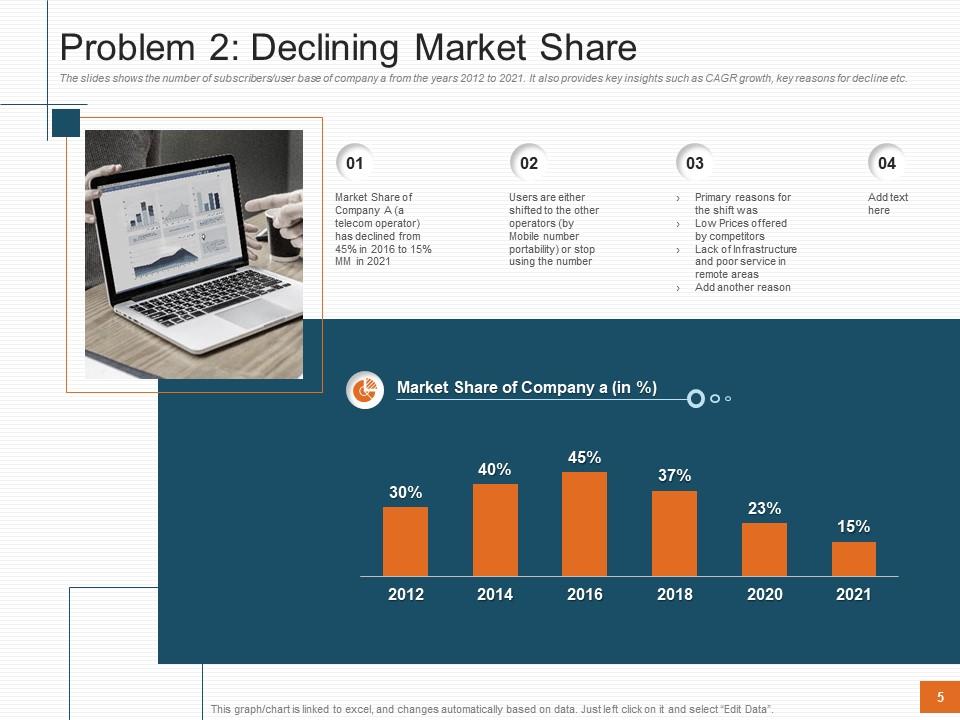
Slide 5: The slides shows the number of subscribers/user base of company a from the years 2012 to 2021. It also provides key insights such as CAGR growth, key reasons for decline etc.
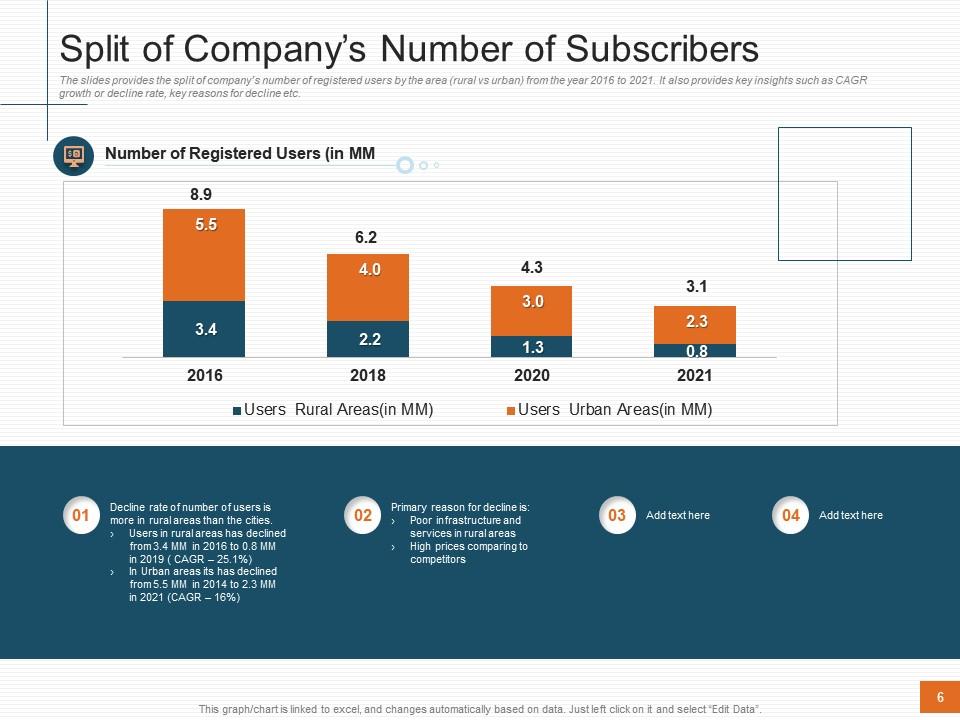
Slide 6: The slides provides the split of company’s number of registered users by the area (rural vs urban) from the year 2016 to 2021. It also provides key insights such as CAGR growth or decline rate, key reasons for decline etc.
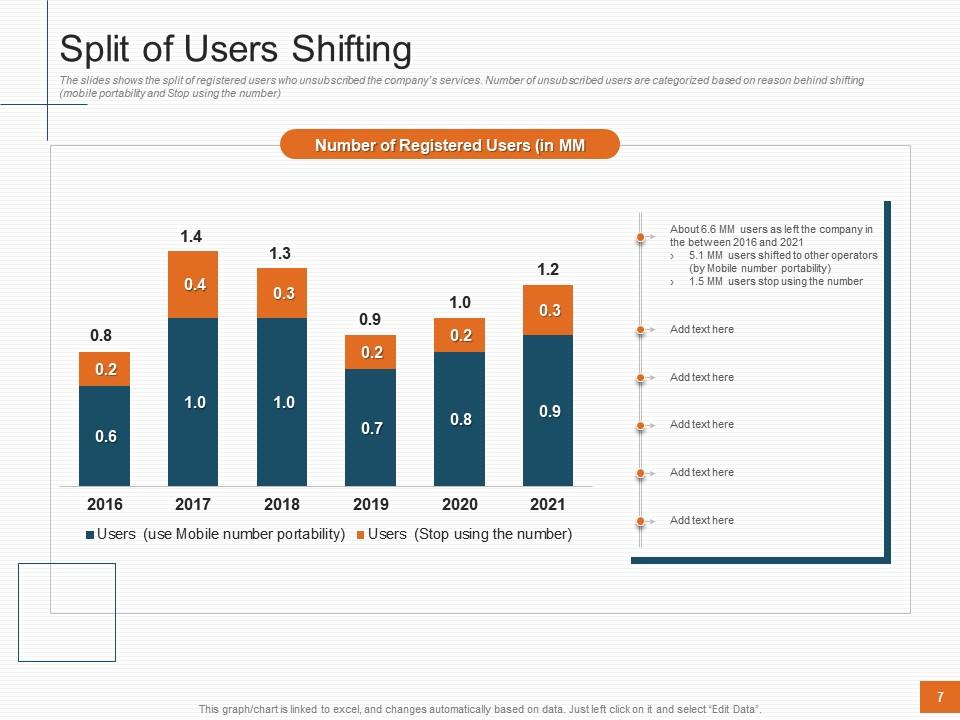
Slide 7: The slides shows the split of registered users who unsubscribed the company’s services. Number of unsubscribed users are categorized based on reason behind shifting (mobile portability and Stop using the number)
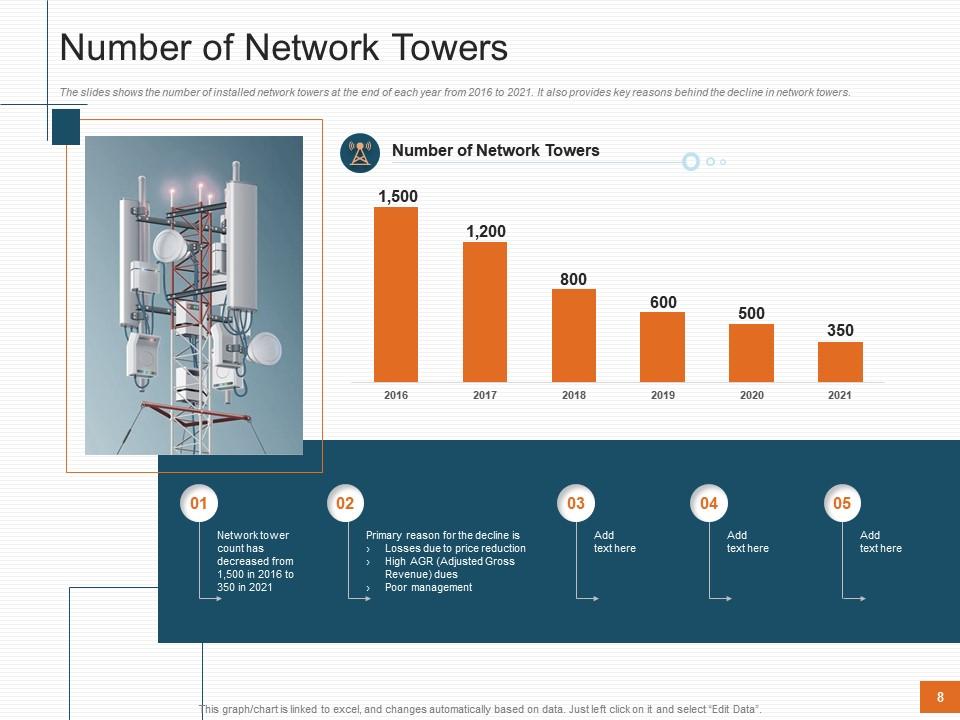
Slide 8: The slides shows the number of installed network towers at the end of each year from 2016 to 2021. It also provides key reasons behind the decline in network towers.
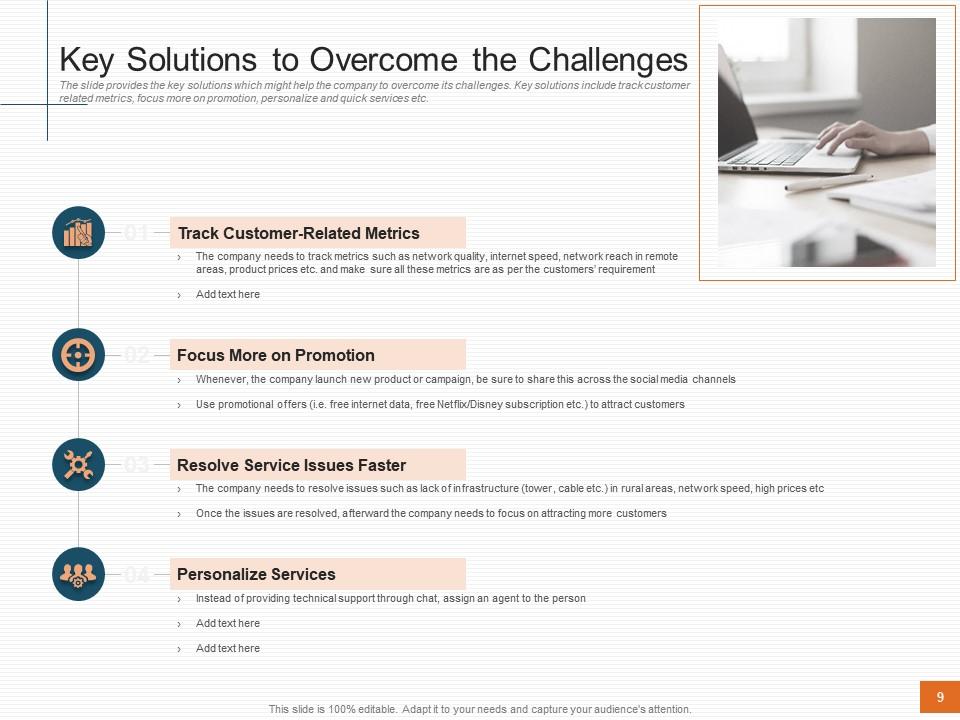
Slide 9: The slide provides the key solutions which might help the company to overcome its challenges. Key solutions include track customer related metrics, focus more on promotion, personalize and quick services etc.
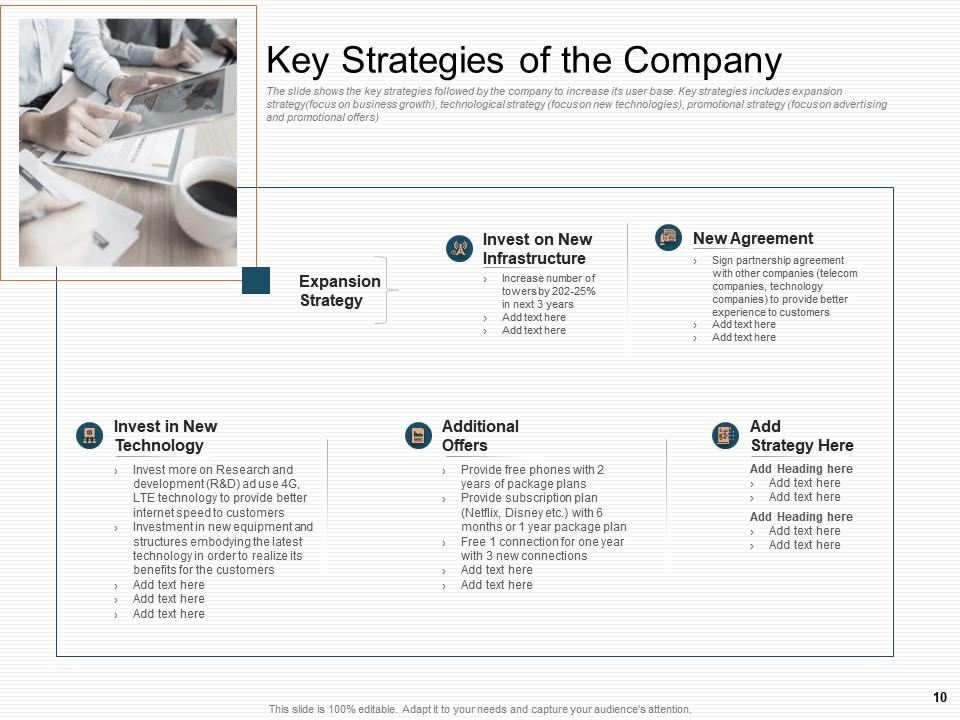
Slide 10: The slide shows the key strategies followed by the company to increase its user base. Key strategies includes expansion strategy(focus on business growth), technological strategy (focus on new technologies), promotional strategy (focus on advertising and promotional offers)
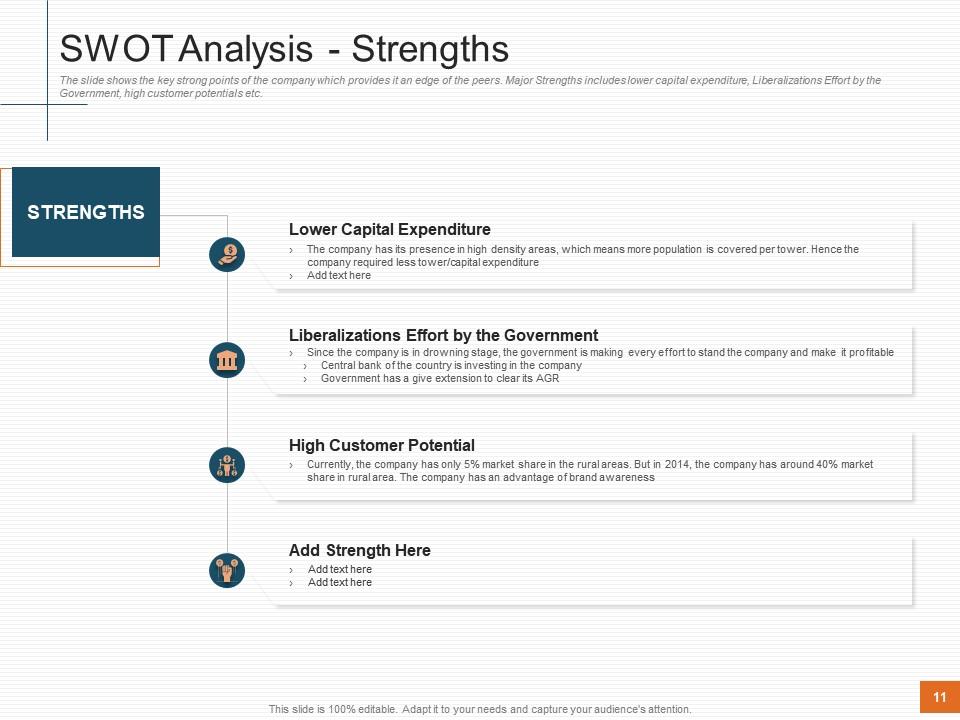
Slide 11: The slide shows the key strong points of the company which provides it an edge of the peers. Major Strengths includes lower capital expenditure, Liberalizations Effort by the Government, high customer potentials etc.
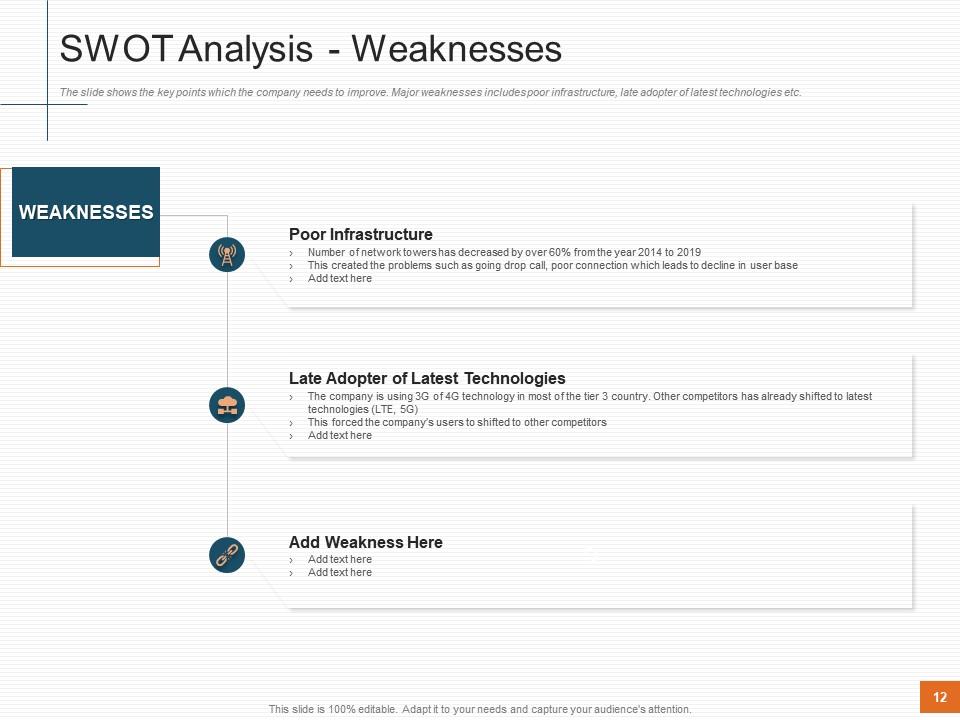
Slide 12: The slide shows the key points which the company needs to improve. Major weaknesses includes poor infrastructure, late adopter of latest technologies etc.
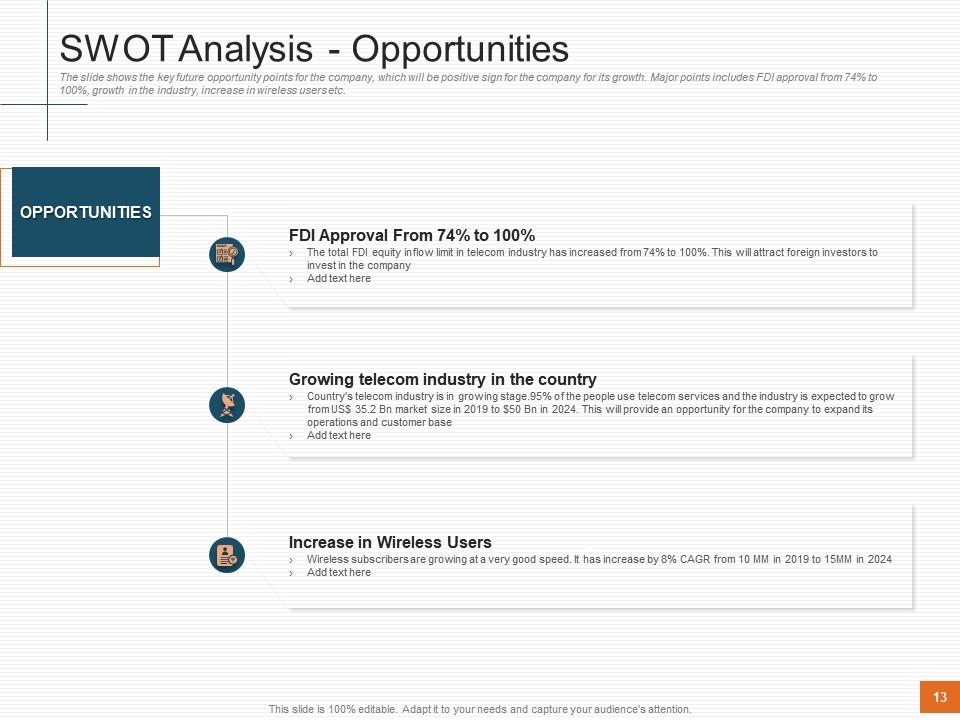
Slide 13: The slide shows the key future opportunity points for the company, which will be positive sign for the company for its growth. Major points includes FDI approval from 74% to 100%, growth in the industry, increase in wireless users etc.
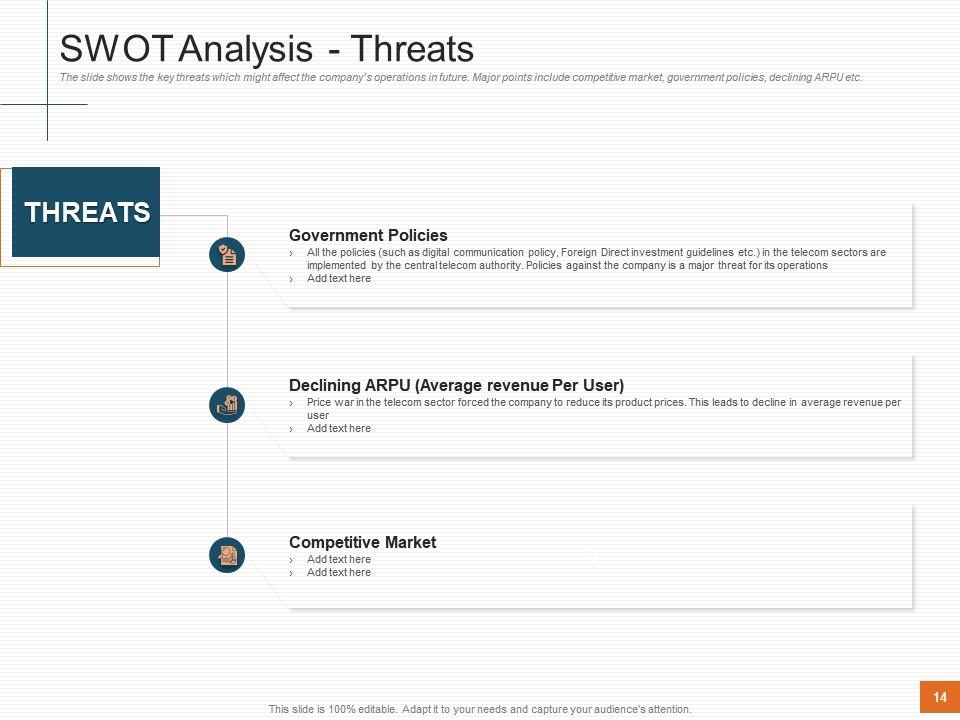
Slide 14: The slide shows the key threats which might affect the company’s operations in future. Major points include competitive market, government policies, declining ARPU etc.
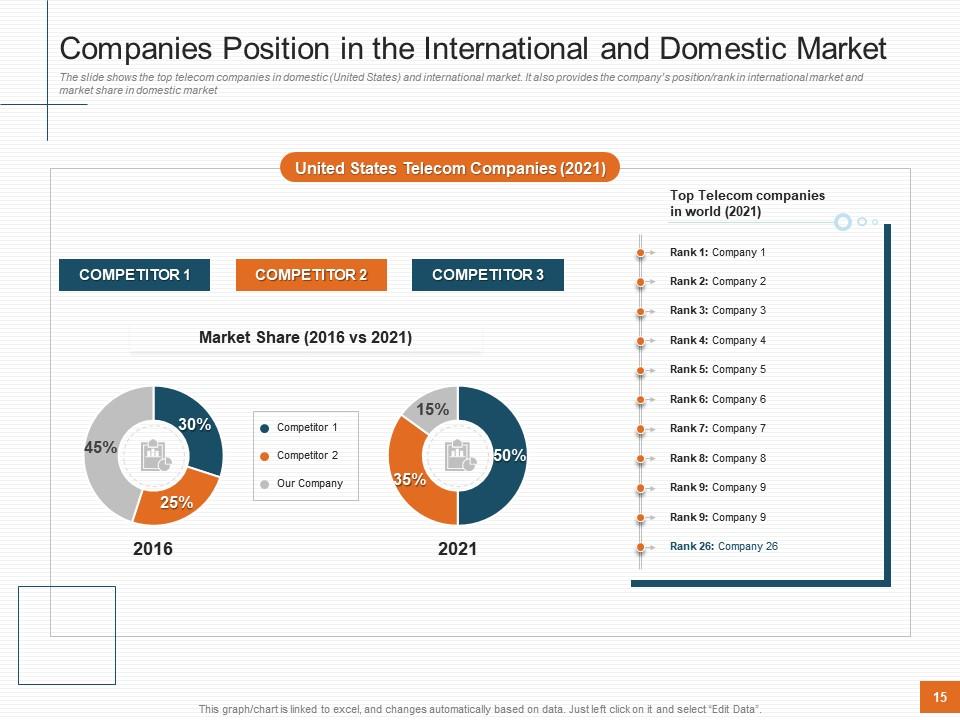
Slide 15: The slide shows the top telecom companies in domestic (United States) and international market. It also provides the company’s position/rank in international market and market share in domestic market
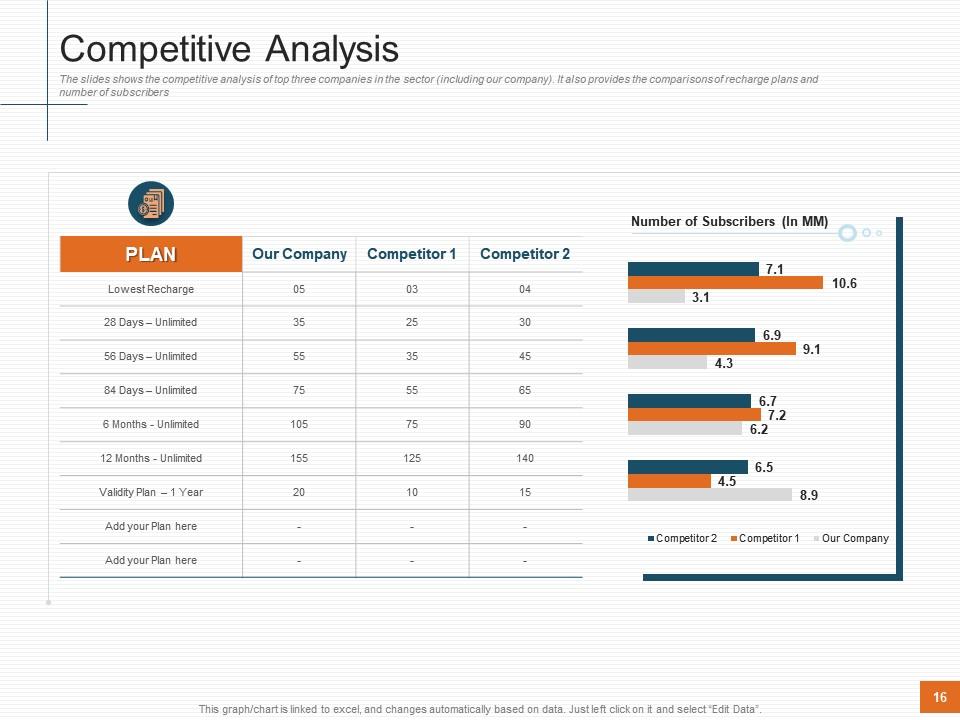
Slide 16: The slides shows the competitive analysis of top three companies in the sector (including our company). It also provides the comparisons of recharge plans and number of subscribers
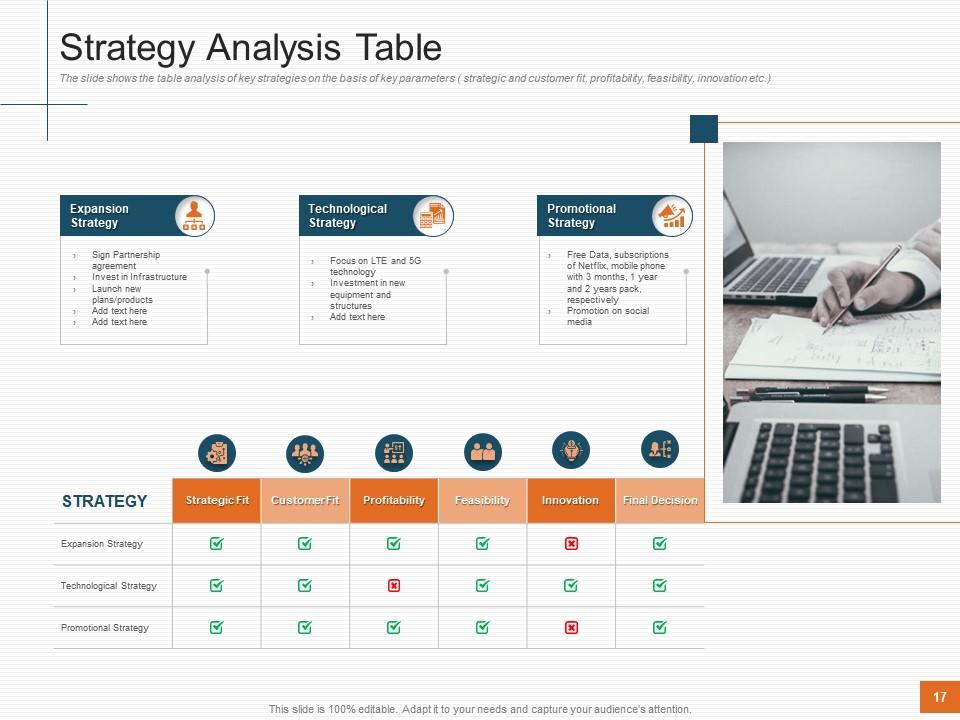
Slide 17: The slide shows the table analysis of key strategies on the basis of key parameters ( strategic and customer fit, profitability, feasibility, innovation etc.)
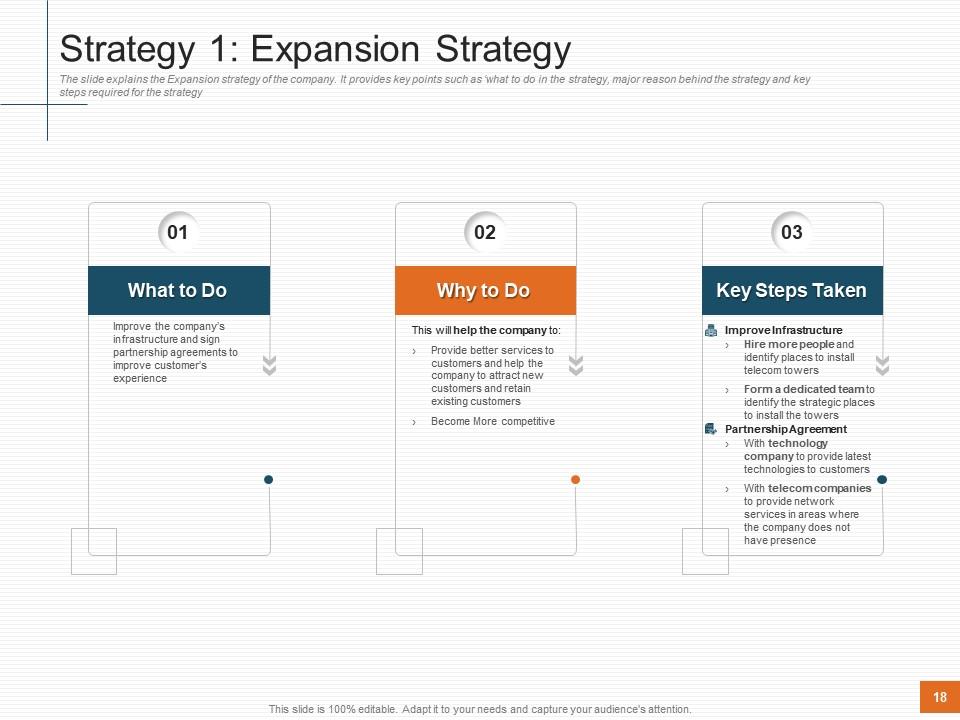
Slide 18: The slide explains the Expansion strategy of the company. It provides key points such as ‘what to do in the strategy, major reason behind the strategy and key steps required for the strategy
Slide 19: The slide explains the diversified technological strategy of the company. It provides key points such as ‘what to do in the strategy, major reason behind the strategy and key steps required for the strategy
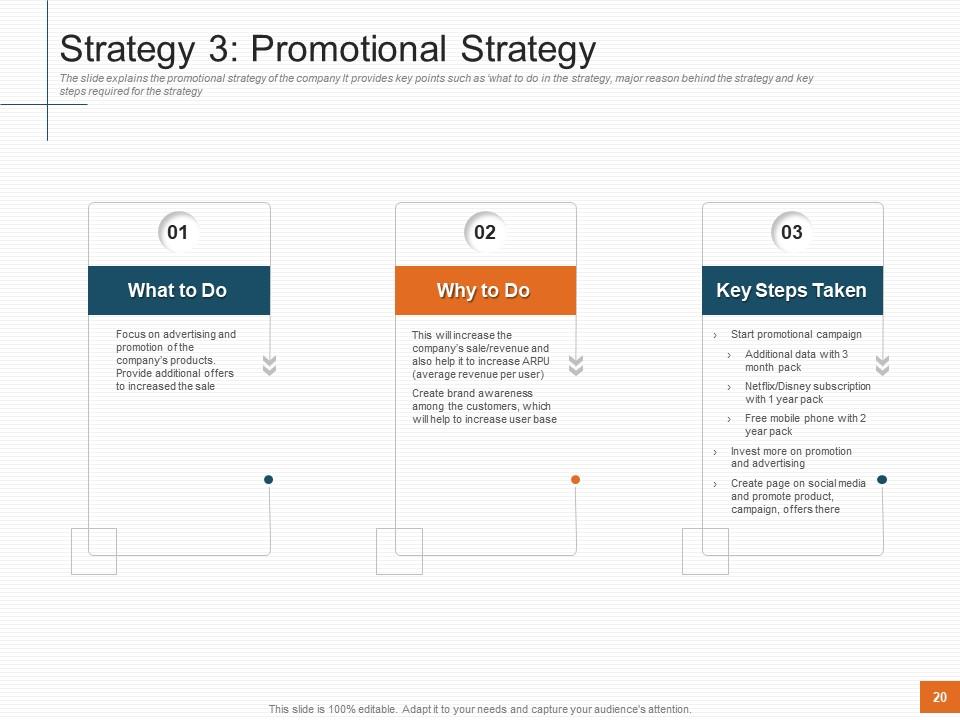
Slide 20: The slide explains the promotional strategy of the company It provides key points such as ‘what to do in the strategy, major reason behind the strategy and key steps required for the strategy
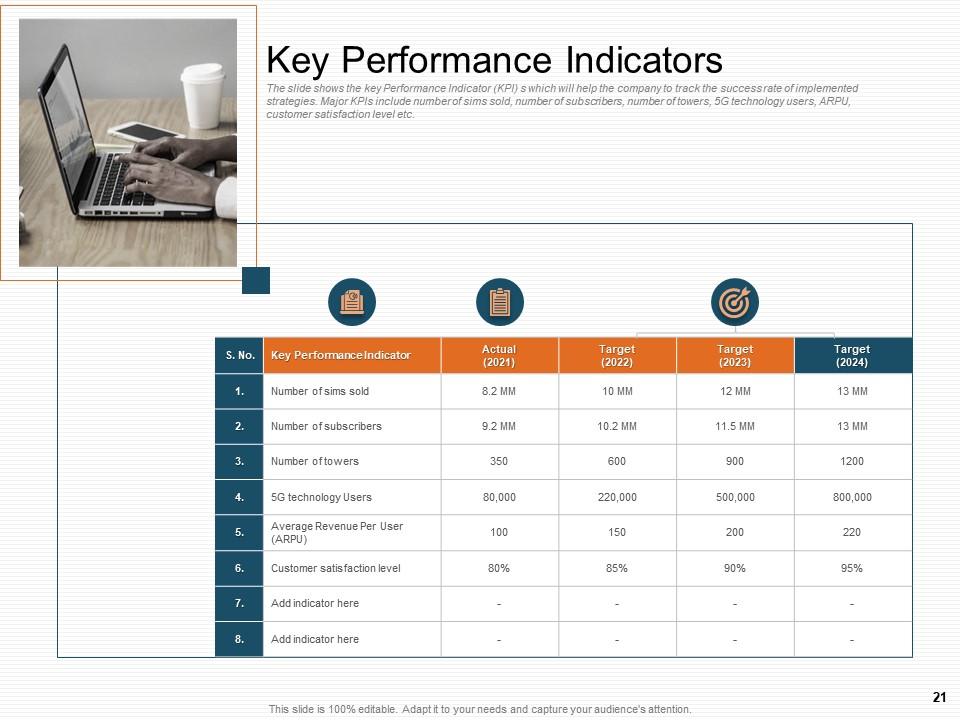
Slide 21: The slide shows the key Performance Indicator (KPI) s which will help the company to track the success rate of implemented strategies. Major KPIs include number of sims sold, number of subscribers, number of towers, 5G technology users, ARPU, customer satisfaction level etc.
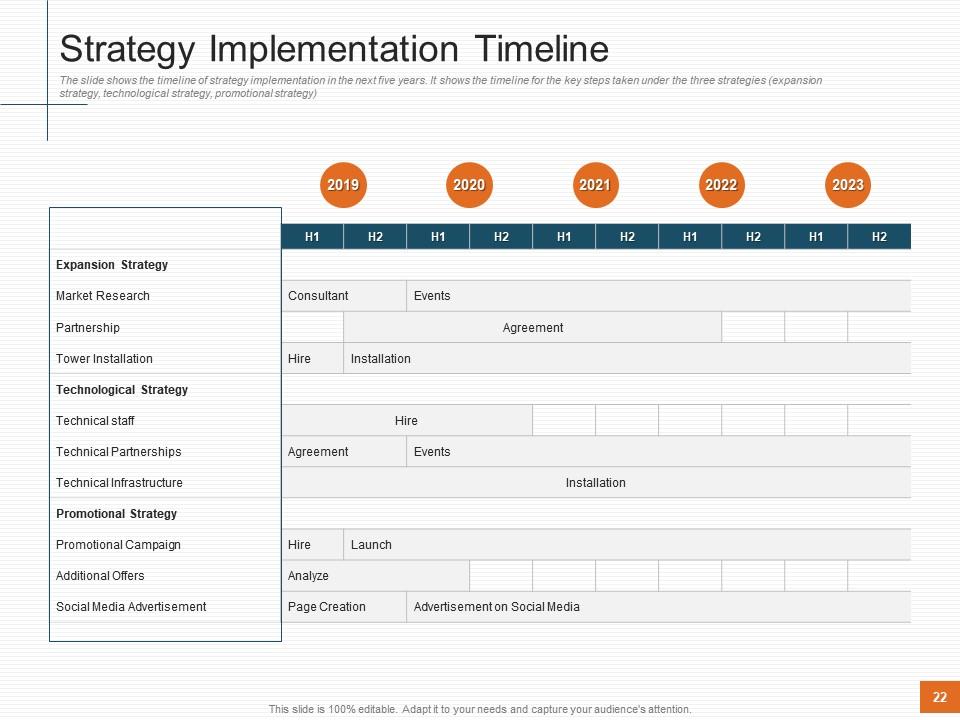
Slide 22: The slide shows the timeline of strategy implementation in the next five years. It shows the timeline for the key steps taken under the three strategies (expansion strategy, technological strategy, promotional strategy)
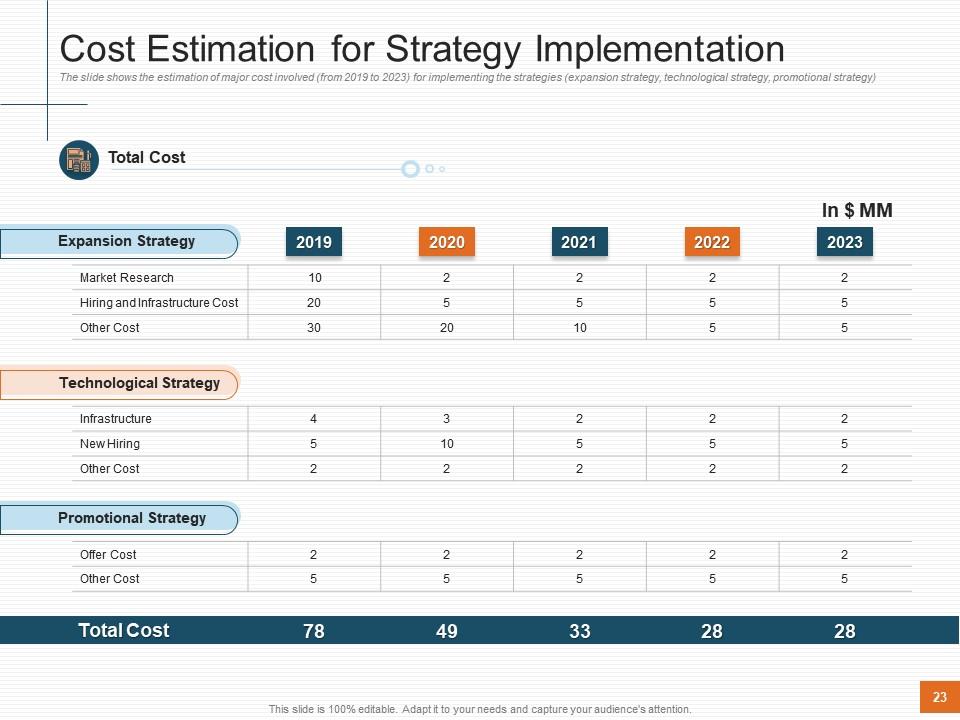
Slide 23: The slide shows the estimation of major cost involved (from 2019 to 2023) for implementing the strategies (expansion strategy, technological strategy, promotional strategy)
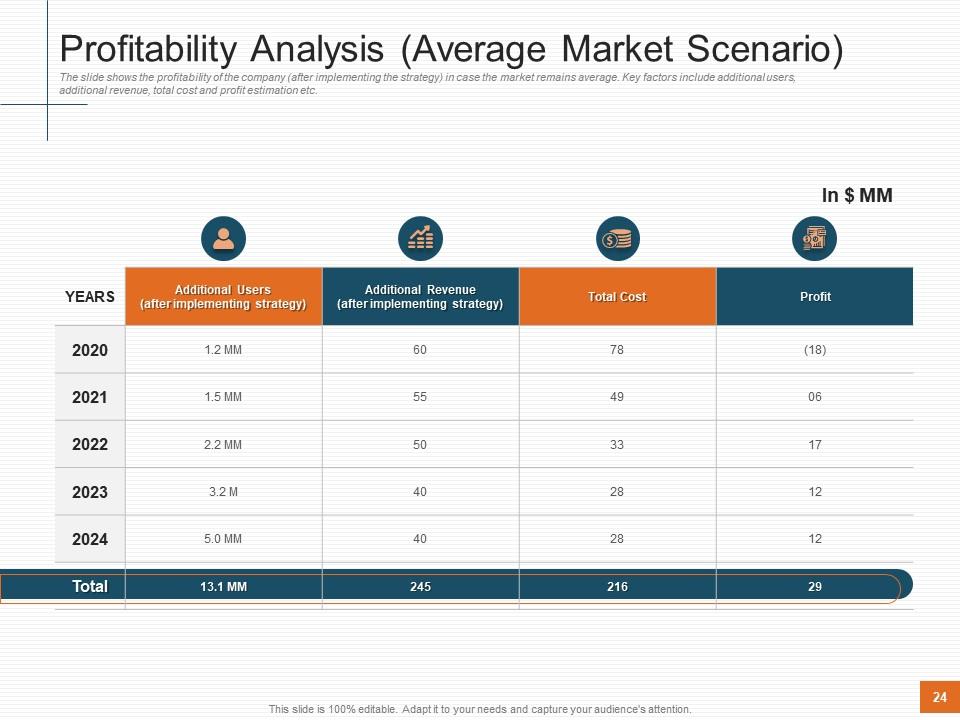
Slide 24: The slide shows the profitability of the company (after implementing the strategy) in case the market remains average. Key factors include additional users, additional revenue, total cost and profit estimation etc.
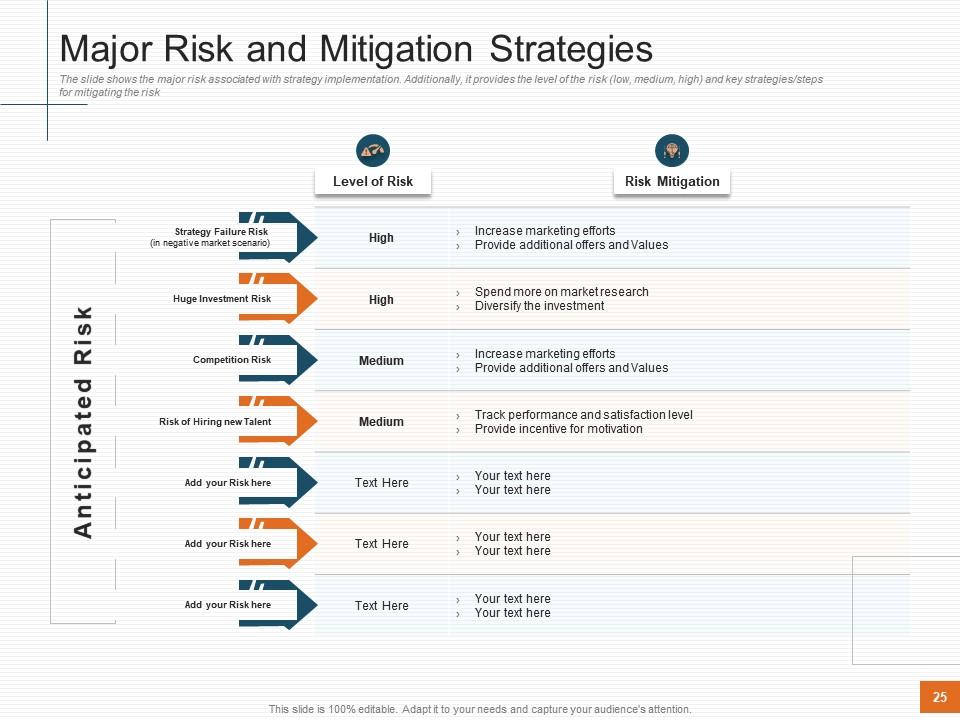
Slide 25: The slide shows the major risk associated with strategy implementation. Additionally, it provides the level of the risk (low, medium, high) and key strategies/steps for mitigating the risk
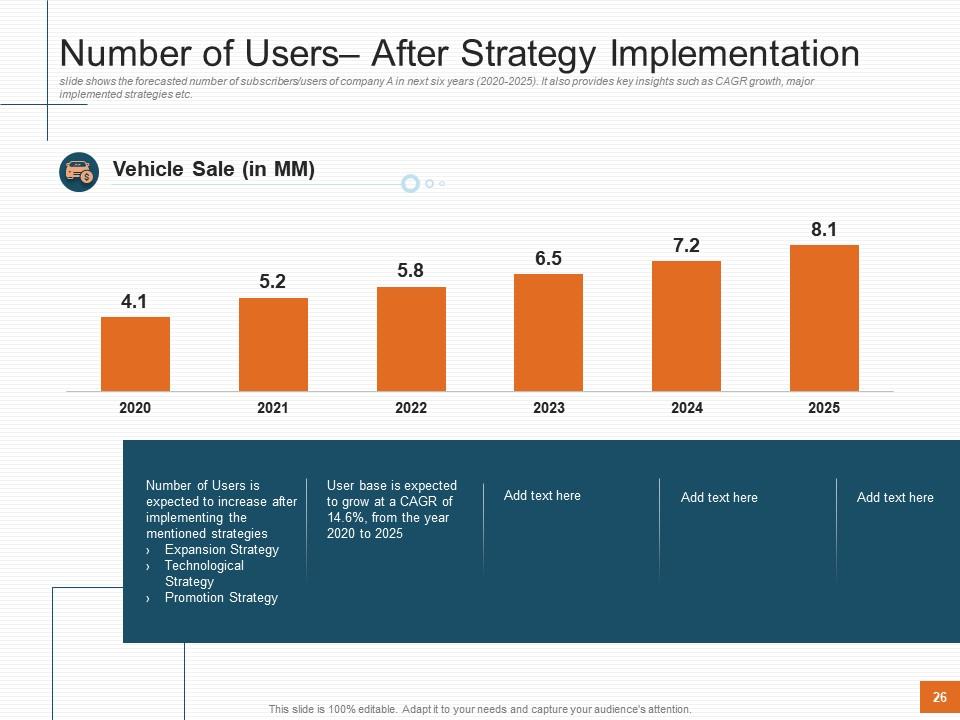
Slide 26: This slide shows the forecasted number of subscribers/users of company A in next six years (2020-2025). It also provides key insights such as CAGR growth, major implemented strategies etc.
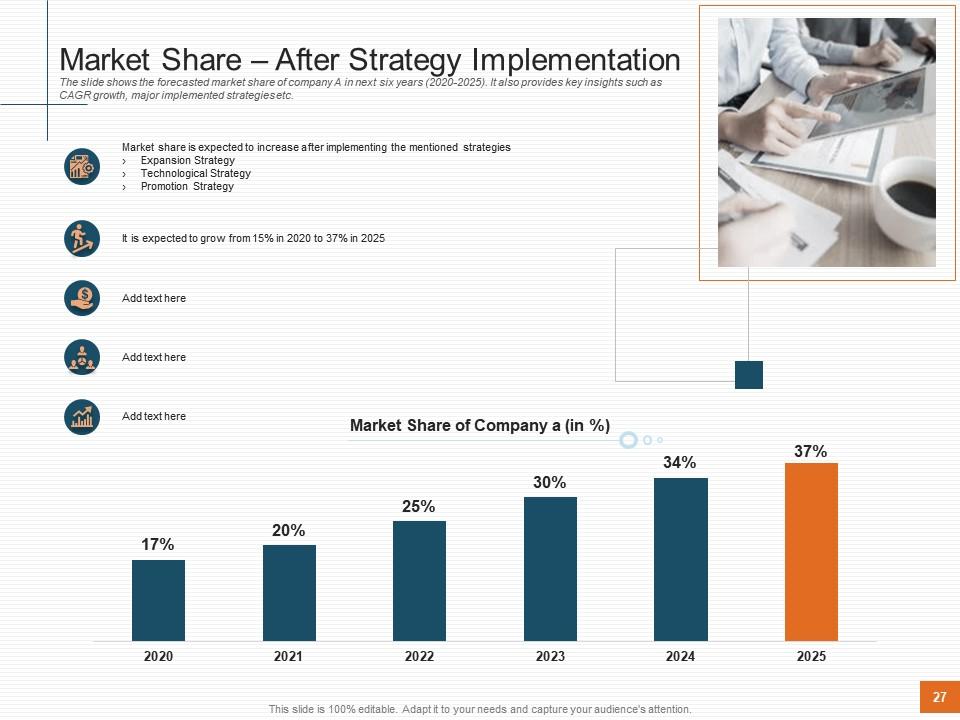
Slide 27: The slide shows the forecasted market share of company A in next six years (2020-2025). It also provides key insights such as CAGR growth, major implemented strategies etc.
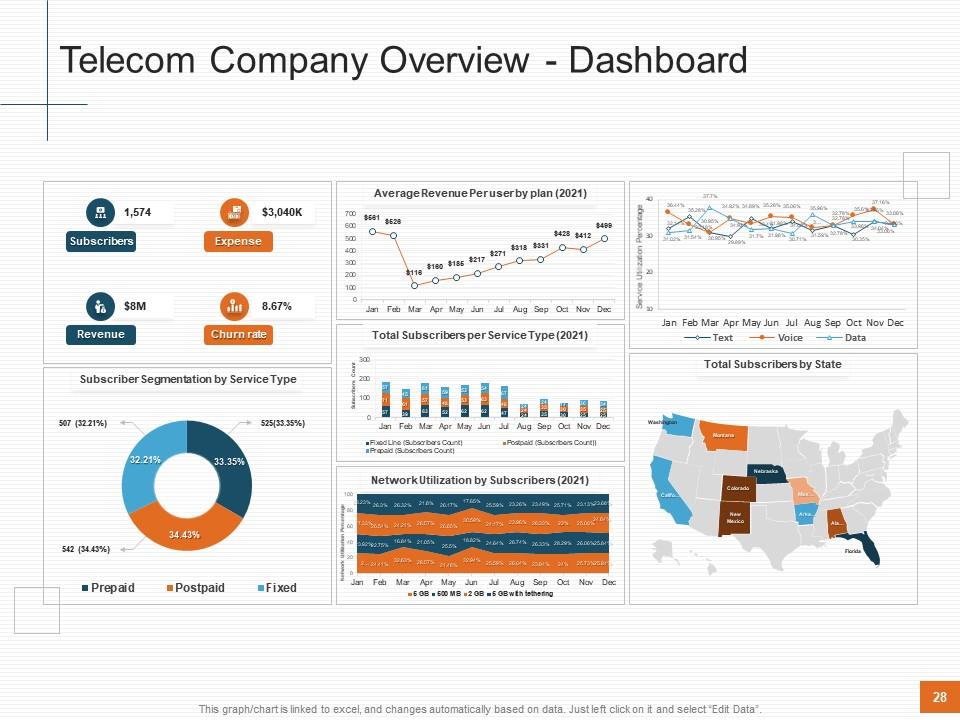
Slide 28: This slide presents Telecom company overview dashboard.
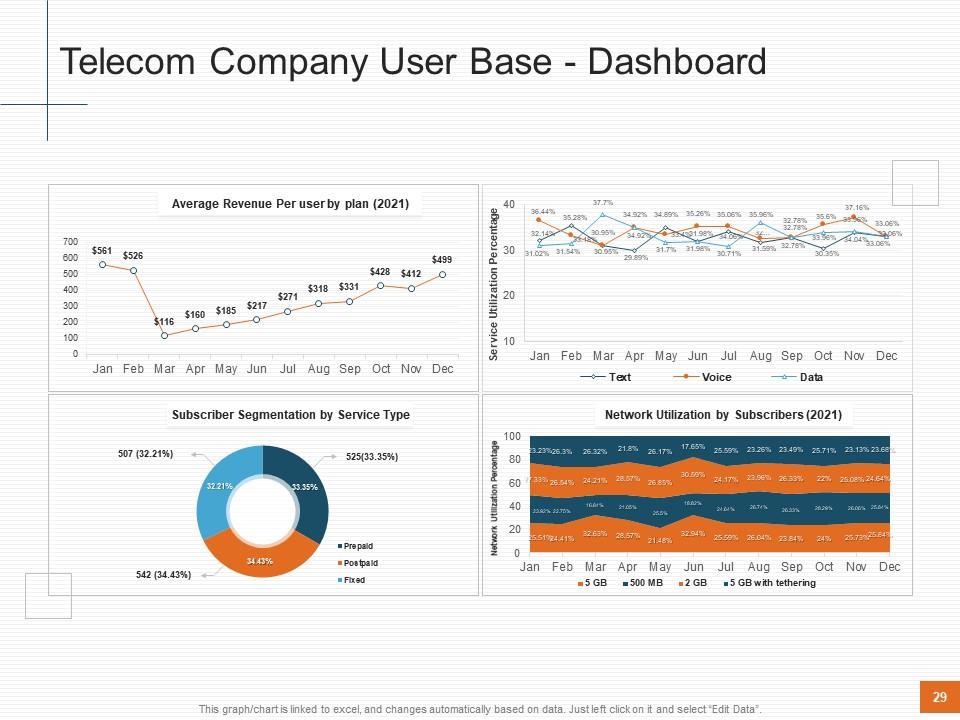
Slide 29: This slide presents Telecom company user base dashboard.
Slide 30: This is Icon Slide with various icons. Use as per need and requirement.
Slide 31: This slide is titled Additional Slides to move forward. Change/ alter content as per need.
Slide 32: This is a 30 60 90 Days Plan slide to create robust plans.
Slide 33: This is Financial scores slide. State your financial aspects etc. here.
Slide 34: This is a Post IT Notes slide that can be used to keep important information at one place.
Slide 35: This is a Blub or Idea image slide to present innovative/ creative aspects.
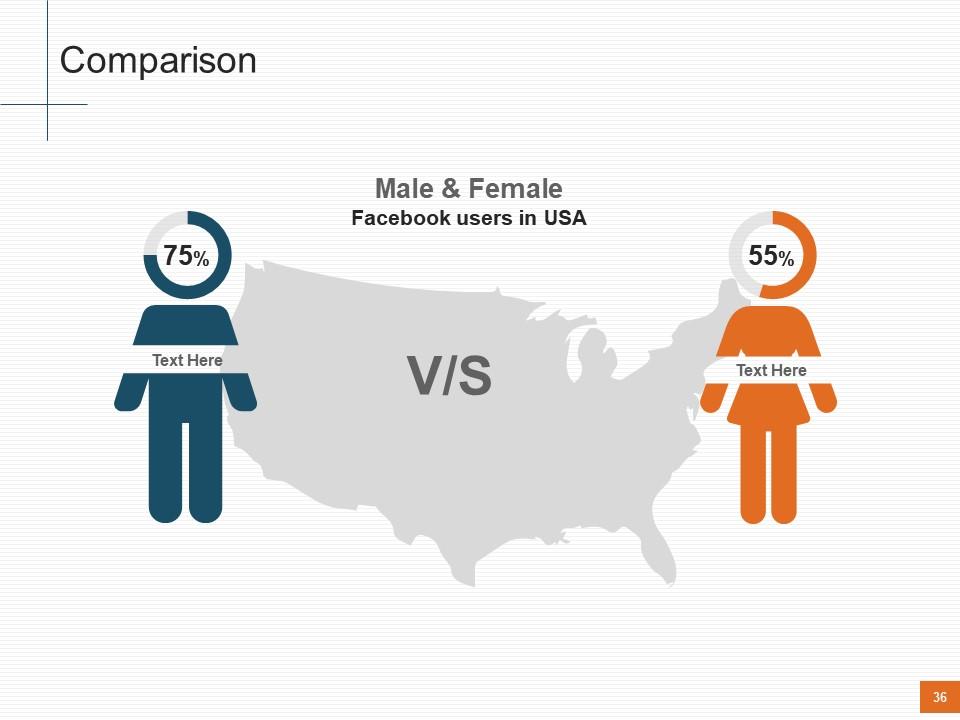
Slide 36: This is Comparison slide to compare two products/ entities etc.
Slide 37: This is a Quote slide to state quotes or anything you believe in.
Slide 38: This is a Thank You slide for acknowledgement.
Sales and profitability decrease in a telecom company case competition complete deck with all 38 slides:
Use our Sales And Profitability Decrease In A Telecom Company Case Competition Complete Deck to effectively help you save your valuable time. They are readymade to fit into any presentation structure.
-
Commendable slides with attractive designs. Extremely pleased with the fact that they are easy to modify. Great work!
-
Appreciate the research and its presentable format.
-
It saves your time and decrease your efforts in half.
-
Great designs, Easily Editable.
-
Nice and innovative design.
-
The Designed Graphic are very professional and classic.
-
Awesomely designed templates, Easy to understand.
-
Perfect template with attractive color combination.
-
Really like the color and design of the presentation.


