Strategies to improve the perception of a railway company case competition complete deck
Our Strategies To Improve The Perception Of A Railway Company Case Competition Complete Deck are topically designed to provide an attractive backdrop to any subject. Use them to look like a presentation pro.
- Google Slides is a new FREE Presentation software from Google.
- All our content is 100% compatible with Google Slides.
- Just download our designs, and upload them to Google Slides and they will work automatically.
- Amaze your audience with SlideTeam and Google Slides.
-
Want Changes to This PPT Slide? Check out our Presentation Design Services
- WideScreen Aspect ratio is becoming a very popular format. When you download this product, the downloaded ZIP will contain this product in both standard and widescreen format.
-

- Some older products that we have may only be in standard format, but they can easily be converted to widescreen.
- To do this, please open the SlideTeam product in Powerpoint, and go to
- Design ( On the top bar) -> Page Setup -> and select "On-screen Show (16:9)” in the drop down for "Slides Sized for".
- The slide or theme will change to widescreen, and all graphics will adjust automatically. You can similarly convert our content to any other desired screen aspect ratio.
Compatible With Google Slides

Get This In WideScreen
You must be logged in to download this presentation.
PowerPoint presentation slides
Enthrall your audience with this Strategies To Improve The Perception Of A Railway Company Case Competition Complete Deck. Increase your presentation threshold by deploying this well crafted template. It acts as a great communication tool due to its well researched content. It also contains stylized icons, graphics, visuals etc, which make it an immediate attention grabber. Comprising fourty four slides, this complete deck is all you need to get noticed. All the slides and their content can be altered to suit your unique business setting. Not only that, other components and graphics can also be modified to add personal touches to this prefabricated set.
People who downloaded this PowerPoint presentation also viewed the following :
Content of this Powerpoint Presentation
Slide 1: This slide is titled “Strategies to Improve the Perception of a Railway Company (Case Competition).” State your Company Name and get started.
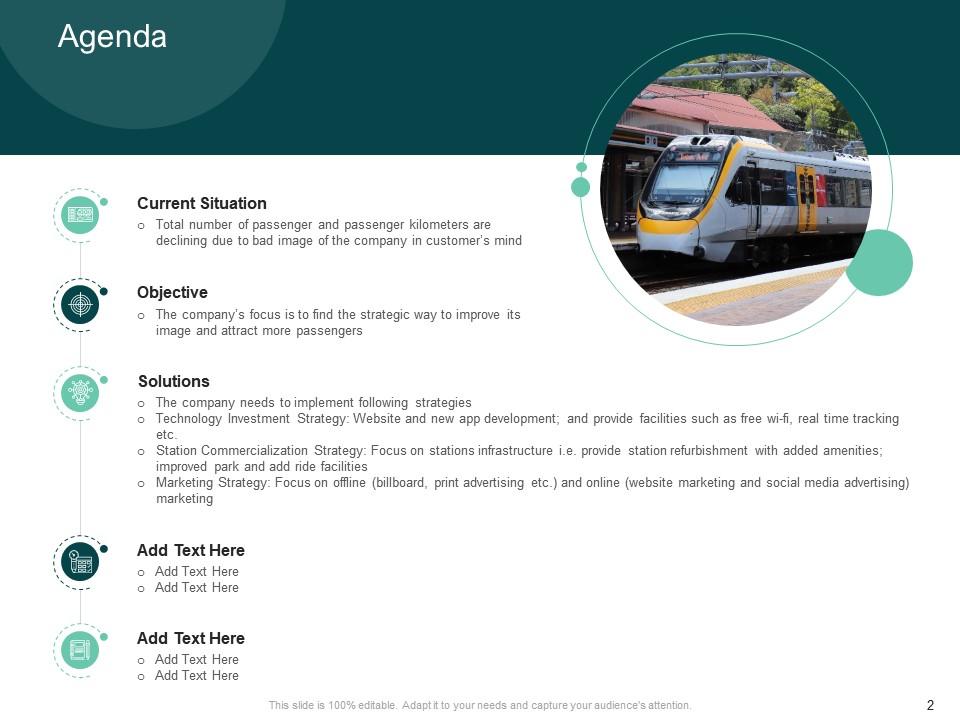
Slide 2: This slide is titled “Agenda.” It shows a glimpse of the current situation, objective, solutions, etc.
Slide 3: This slide is titled “Table of Contents.” It shows a glimpse of the Current Situation Overview,
Slide 4: This slide is titled “Table of Contents.” It shows the Current Situation Overview, Brief Introduction About the Company, Current Situation - Total Number of Passenger Kilometre, Other Operational and Financial KPIs, and Major Steps Required to Overcome the Challenge.
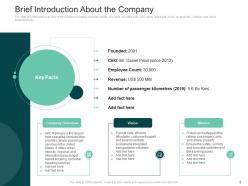
Slide 5: This slide is titled “Brief Introduction About the Company.” It shows a brief overview of the company, including business details, key facts (founded year, CEO name, employee count, revenue, etc.), mission and vision statements, etc.
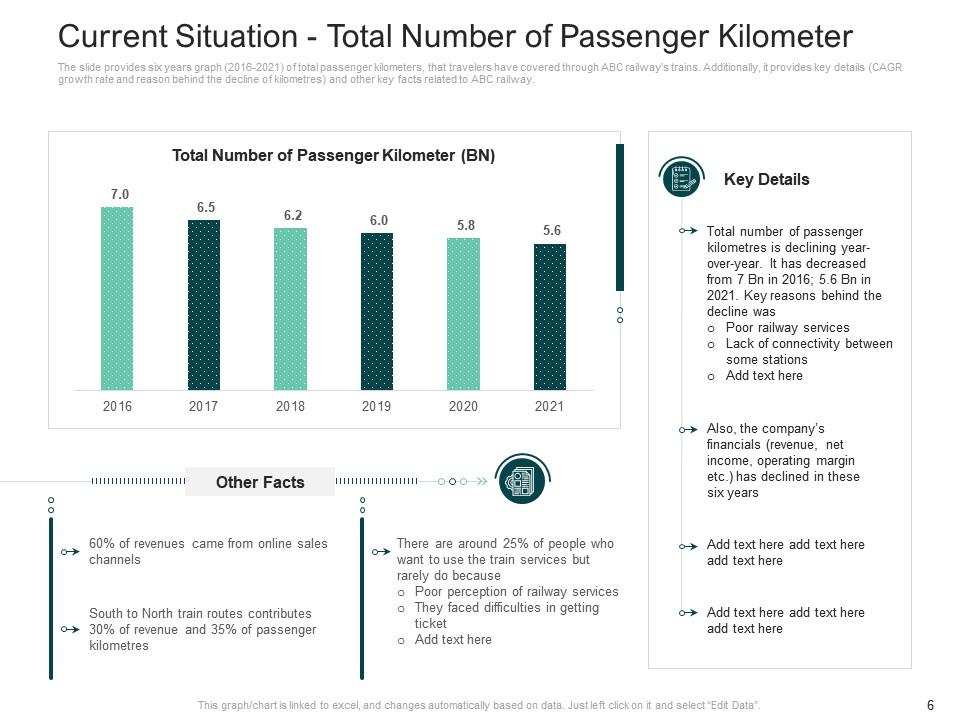
Slide 6: This slide is titled “Current Situation - Total Number of Passenger Kilometres.” It shows a six years’ graph (2016-2021) of total passenger kilometers that travelers have covered through ABC railway’s trains. Additionally, etc.
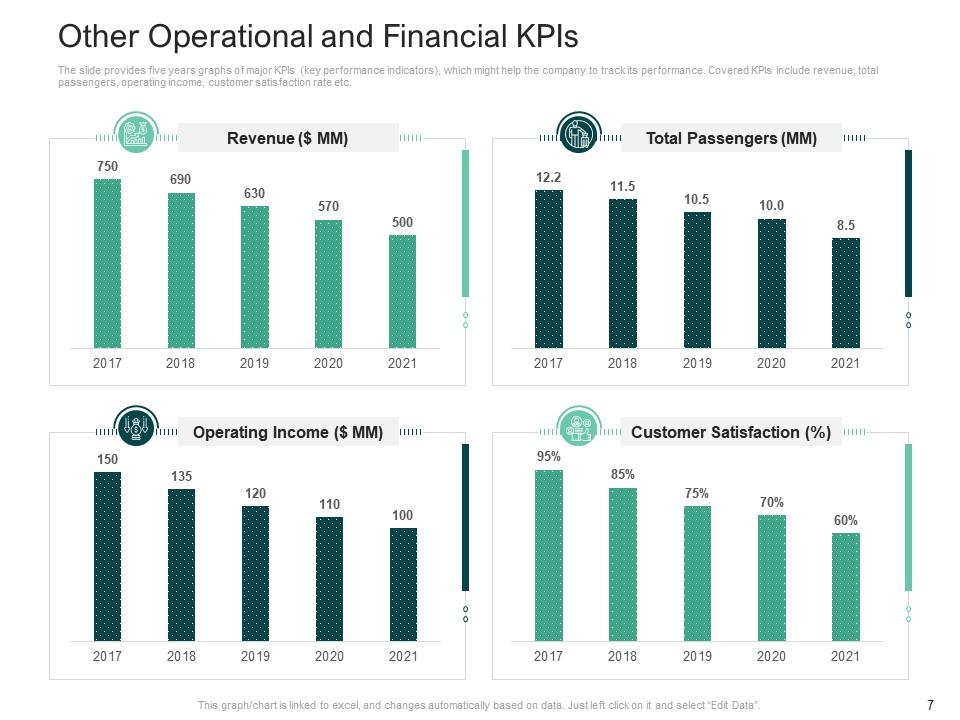
Slide 7: This slide is titled “Other Operational and Financial KPIs.” It shows a five years’ graphs of major KPIs (key performance indicators), which might help the company to track its performance. Covered KPIs include revenue, total passengers, operating income, customer satisfaction rate, etc.
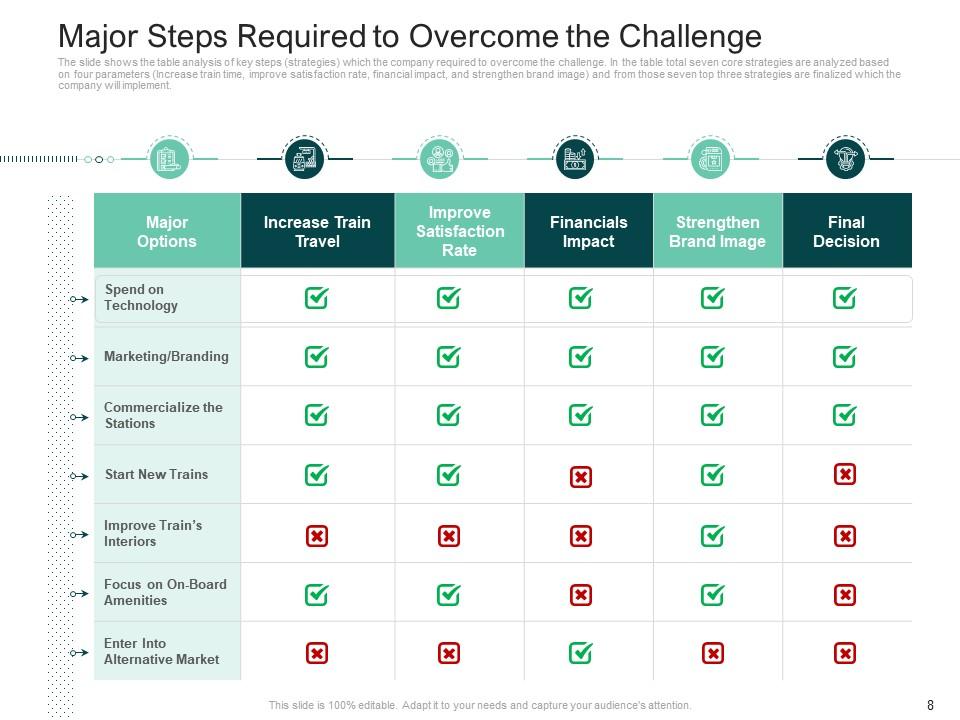
Slide 8: This slide is titled “Major Steps Required to Overcome the Challenge.” It shows the table analysis of key steps (strategies) which the company required to overcome the challenge.
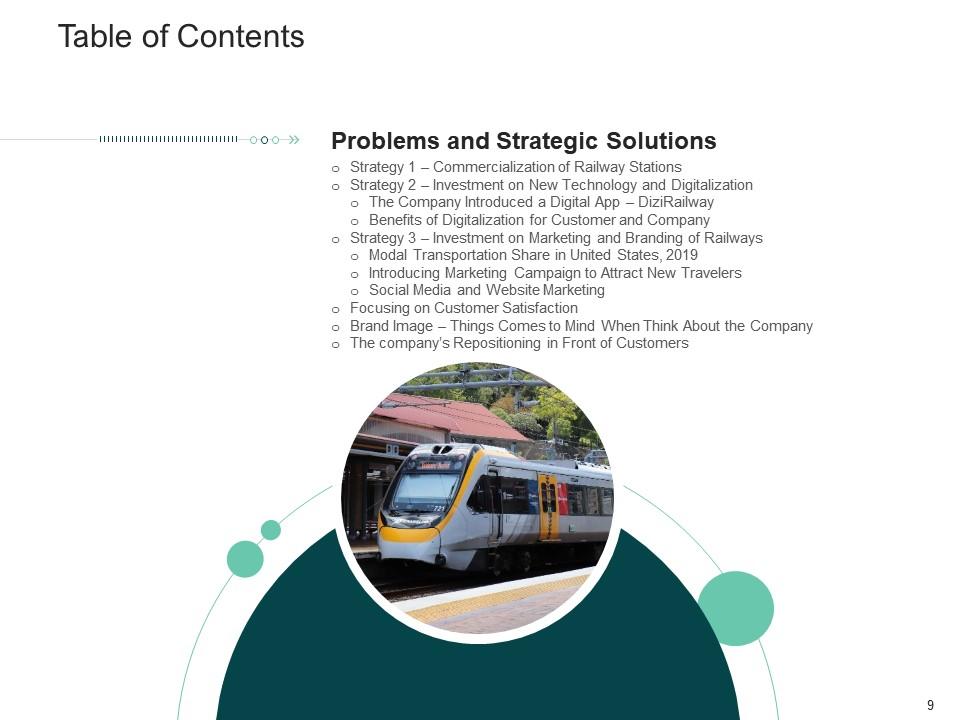
Slide 9: This slide is titled “Table of Contents.” It shows Problems and Strategic Solutions, Benefits of Digitalization for Customer and Company, Modal Transportation Share in the United States, etc.
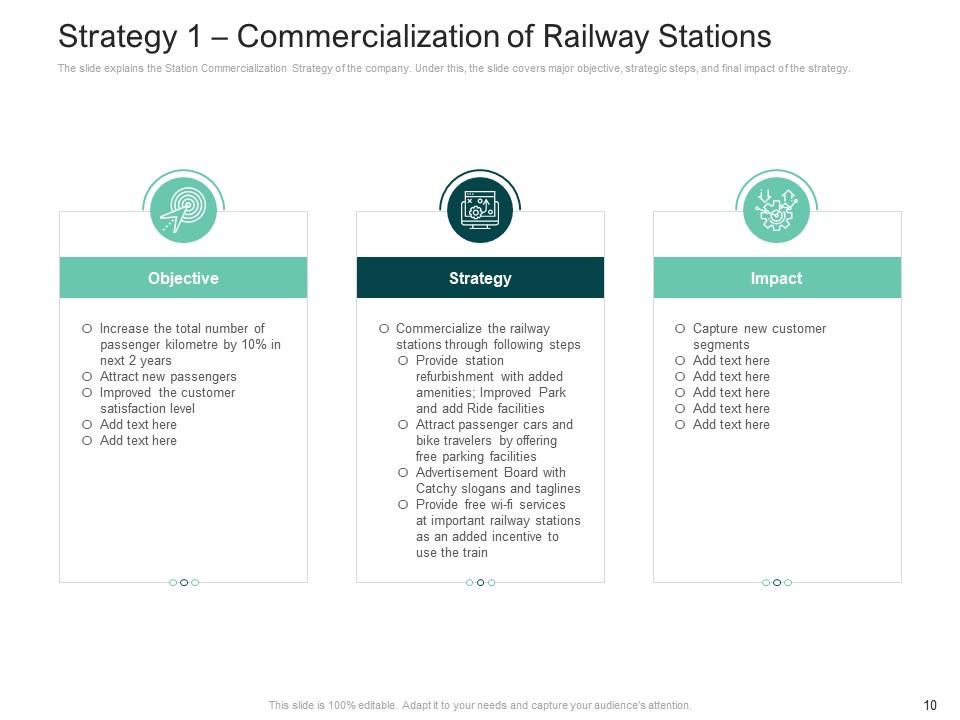
Slide 10: This slide is titled “Strategy 1 – Commercialization of Railway Stations.” It explains the Station Commercialization Strategy of the company. Under this, the slide covers the major objective, strategic steps, and final impact of the strategy.
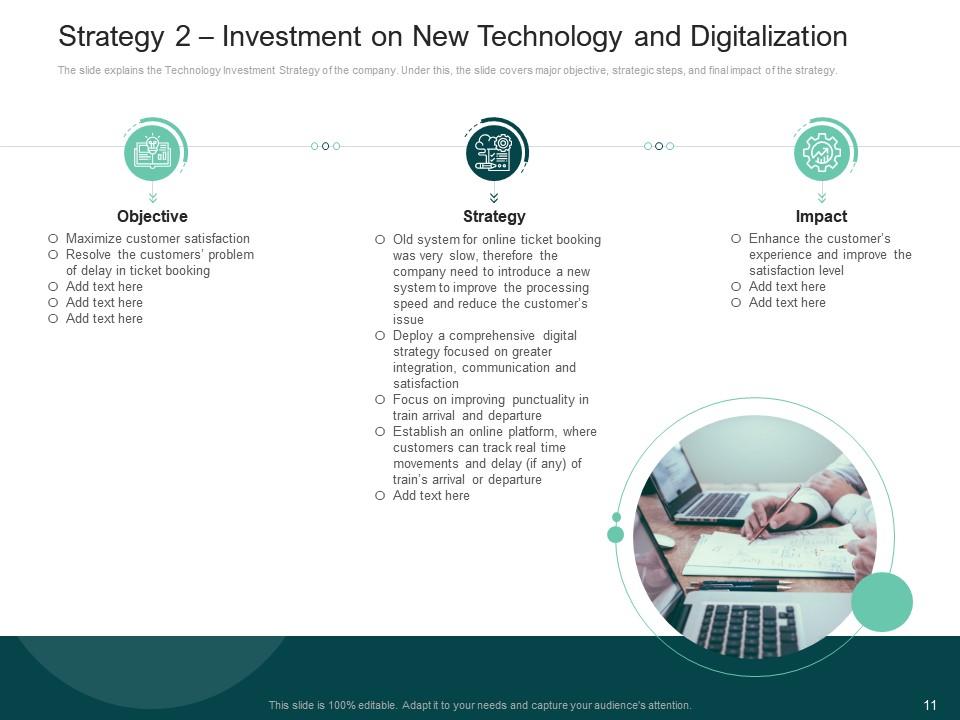
Slide 11: This slide is titled “Strategy 2 – Investment on New Technology and Digitalization.” It explains the Technology Investment Strategy of the company. Under this, the slide covers the major objective, strategic steps, and final impact of the strategy.
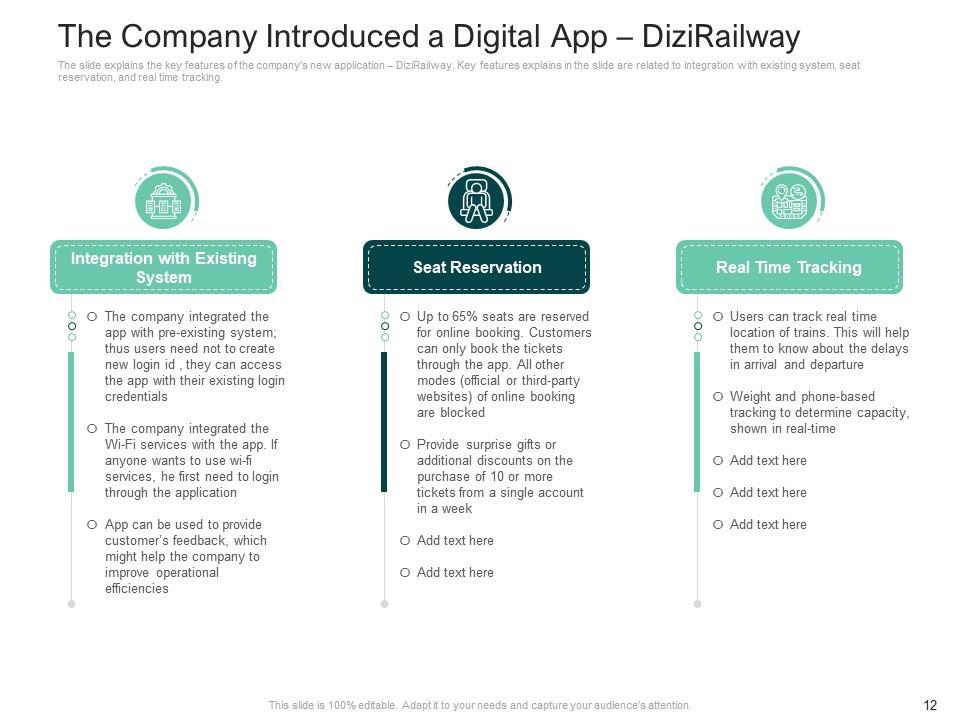
Slide 12: This slide is titled “The Company Introduced a Digital App – DiziRailway.” It explains the key features of the company’s new application – DiziRailway. It is related to integration with an existing system, seat reservation, and real time tracking.
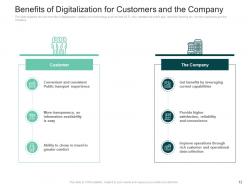
Slide 13: This slide is titled “Benefits of Digitalization for Customers and the Company.” It explains the key benefits of digitalization (adding new technology such as free Wi-Fi, new website and online app, real time tracking etc.) for the customers and the company.
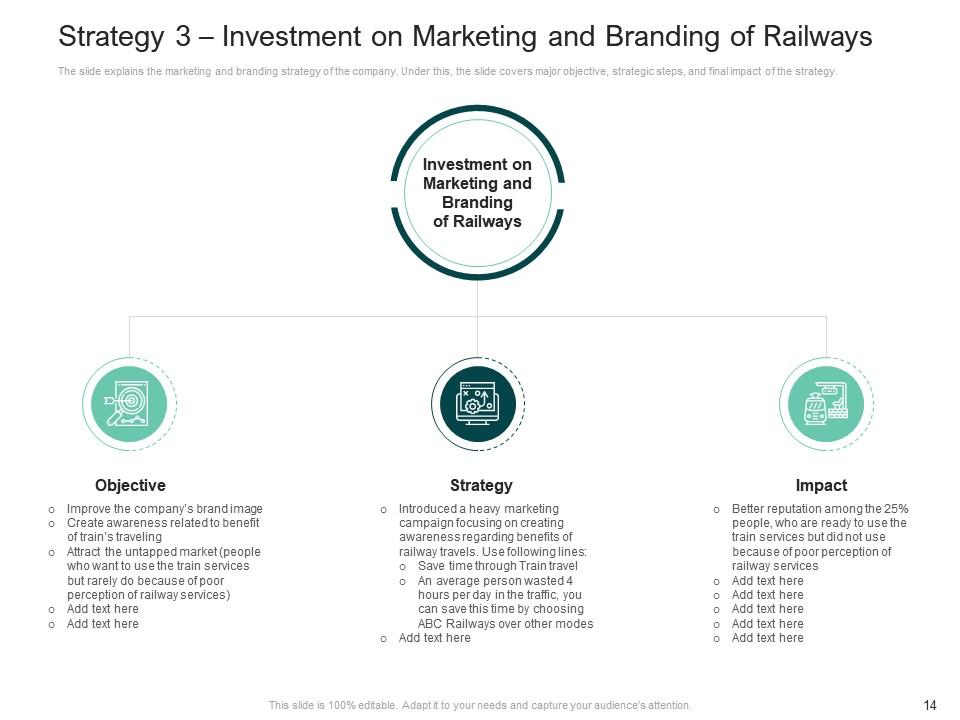
Slide 14: This slide is titled “Strategy 3 – Investment on Marketing and Branding of Railways.” The slide explains the marketing and branding strategy of the company. Under this, the slide covers major objectives, strategic steps, and final impact of the strategy.
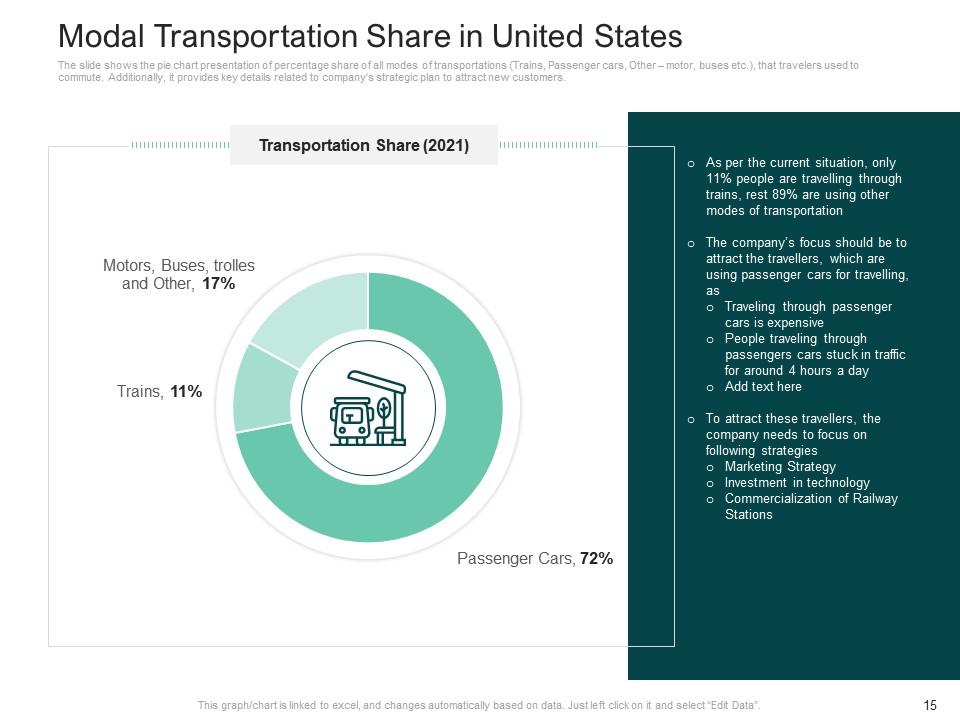
Slide 15: This slide is titled “Modal Transportation Share in the United States.” It shows the pie chart presentation of the percentage share of all modes of transportations (Trains, Passenger cars, Other – motor, buses etc.) that travellers used to commute.
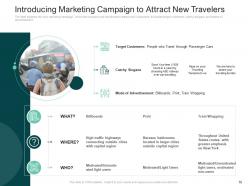
Slide 16: This slide is titled “Introducing Marketing Campaign to Attract New Travelers.” It explains the new marketing campaign, which the company has introduced to attract new customers. It includes target customers, catchy slogans, and modes of advertisement.
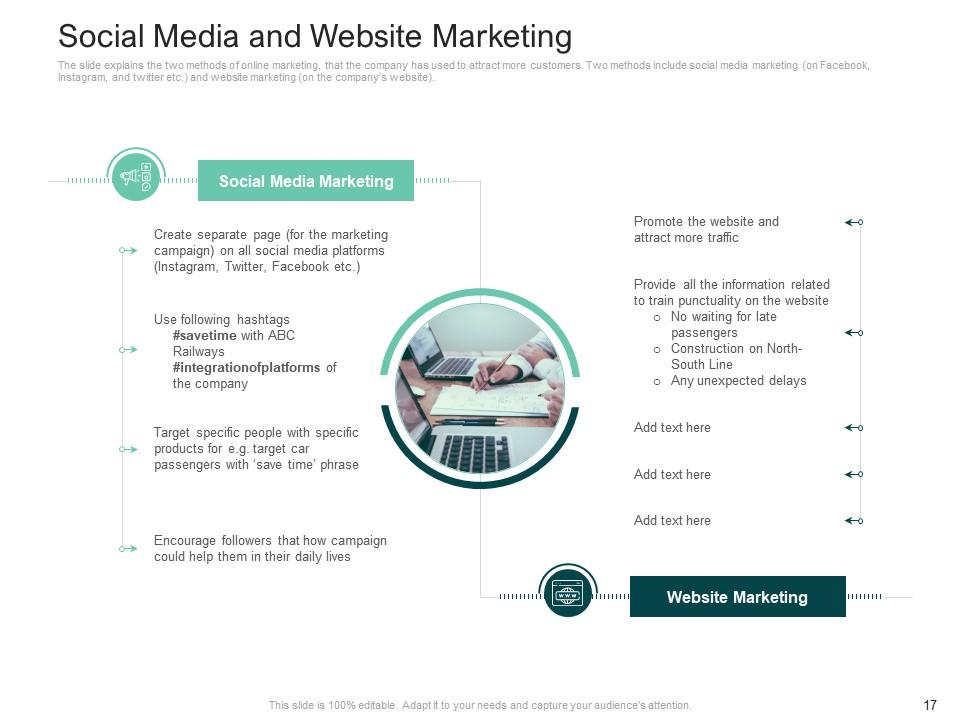
Slide 17: This slide is titled “Social Media and Website Marketing.” It explains the two methods of online marketing that the company has used to attract more customers. Two methods include social media marketing (on Facebook, Instagram, and twitter etc.) and website marketing (on the company’s website).
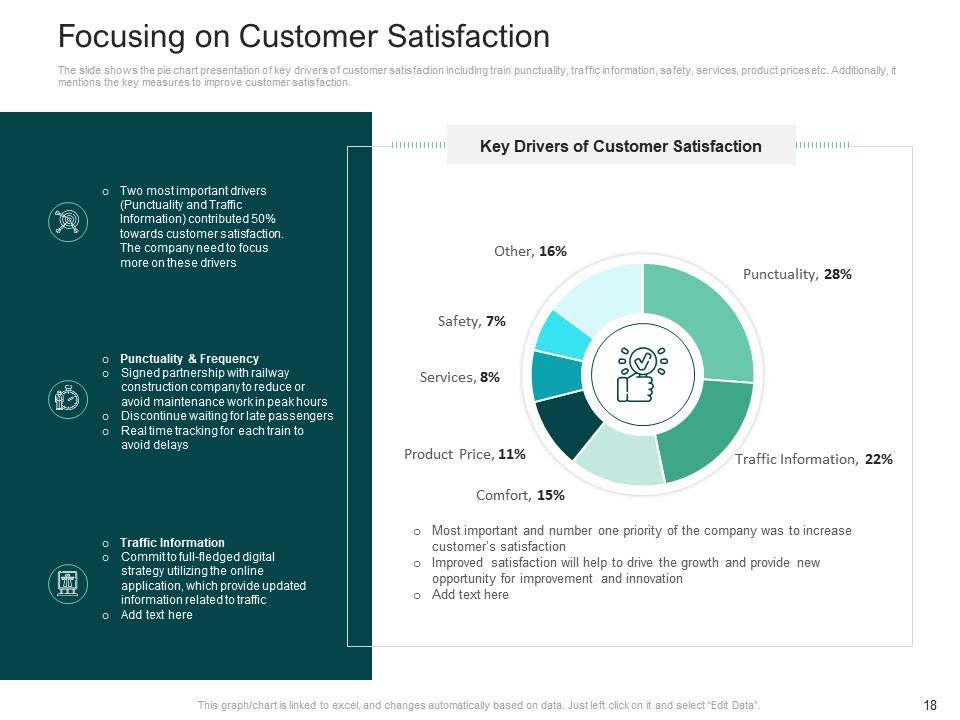
Slide 18: This slide is titled “Focusing on Customer Satisfaction.” It shows the pie chart presentation of key drivers of customer satisfaction, including train punctuality, traffic information, safety, services, product prices etc. Additionally, it mentions the key measures to improve customer satisfaction.
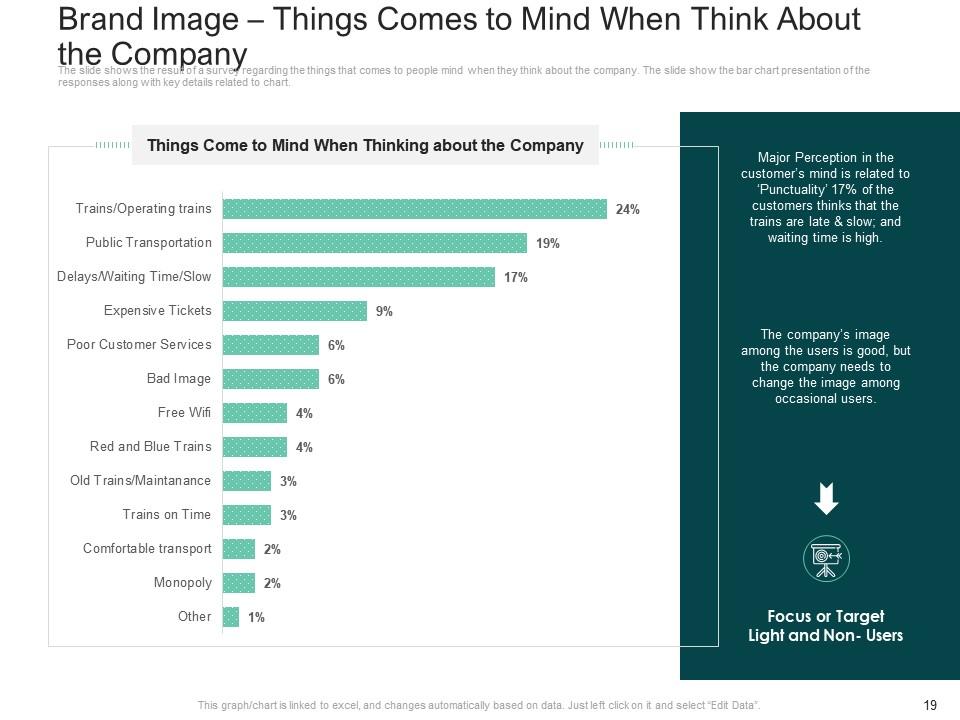
Slide 19: This slide is titled “Brand Image – Things Come to Mind When Think About the Company.” It shows the result of a survey regarding the things that come to people’s mind when they think about the company. The slide shows the bar chart presentation of the responses along with key details related to the chart.
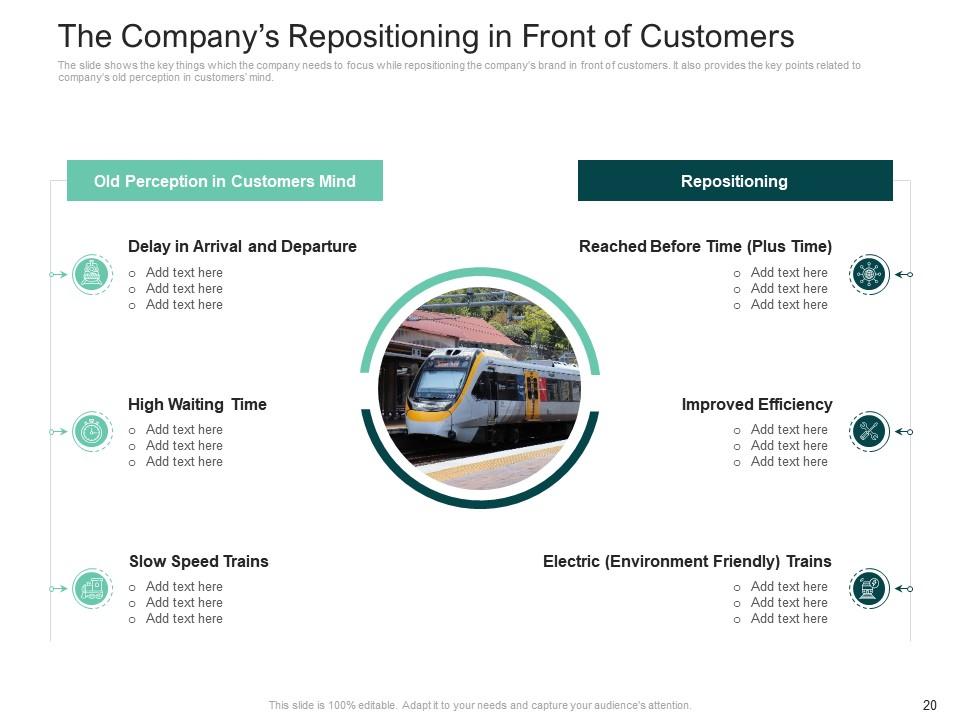
Slide 20: This slide is titled “The Company’s Repositioning in Front of Customers”. The slide shows the key things which the company needs to focus while repositioning the company’s brand in front of customers. It also shows the key points related to the company’s old perception in customers’ minds.
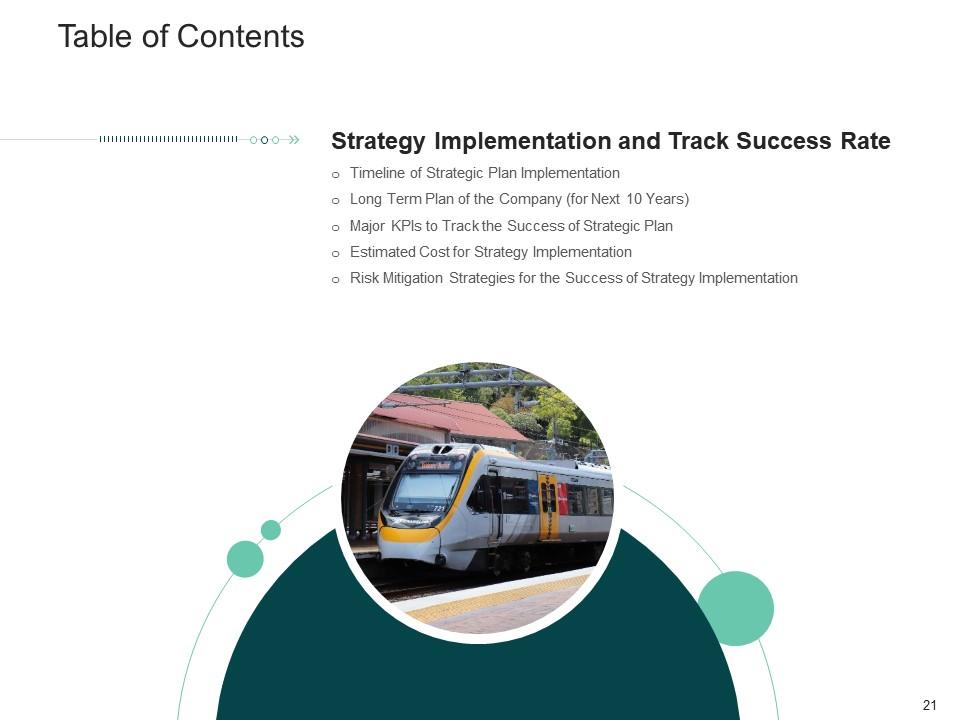
Slide 21: This slide is titled “Table of Contents.” It shows Strategy Implementation and Track Success Rate, Timeline of Strategic Plan Implementation, Long Term Plan of the Company (for Next 10 Years), etc.
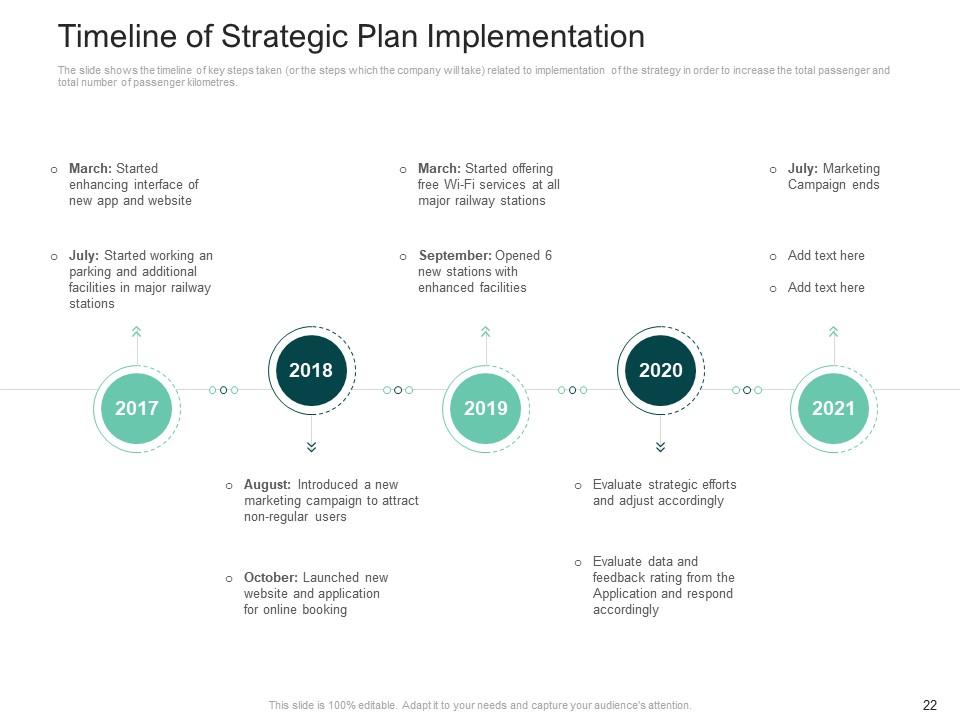
Slide 22: This slide is titled “Timeline of Strategic Plan Implementation.” It shows the timeline of key steps taken (or the steps which the company will take) related to the implementation of the strategy in order to increase the total passenger and total number of passenger kilometres.
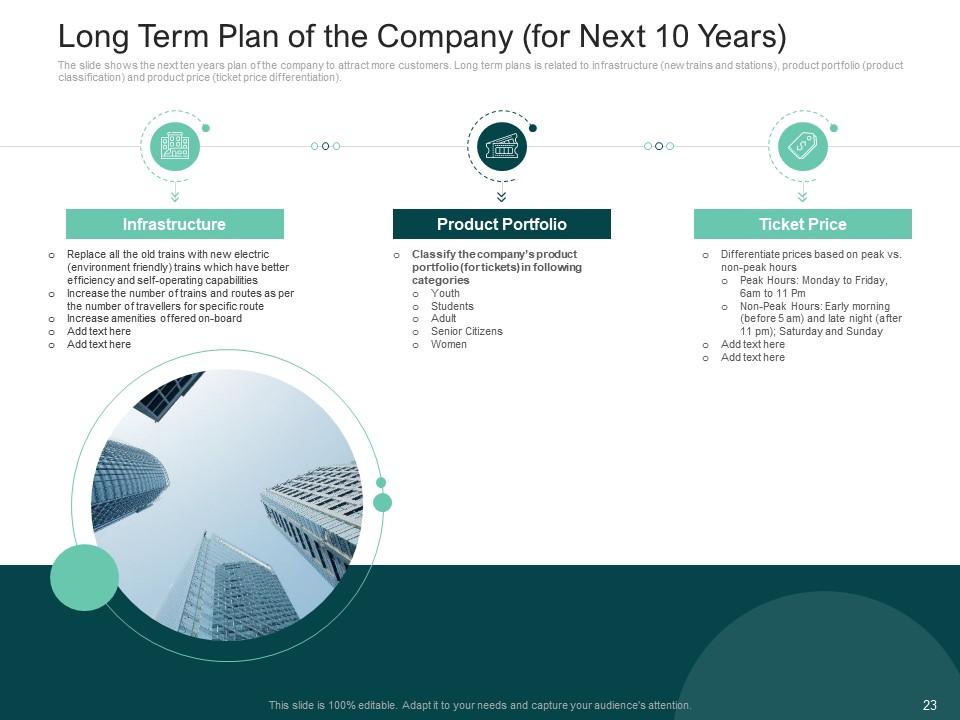
Slide 23: This slide is titled “Long Term Plan of the Company (for Next 10 Years).” It shows the next ten years plan of the company to attract more customers. Long term plans are related to infrastructure (new trains and stations), product portfolio (product classification) and product price (ticket price differentiation).
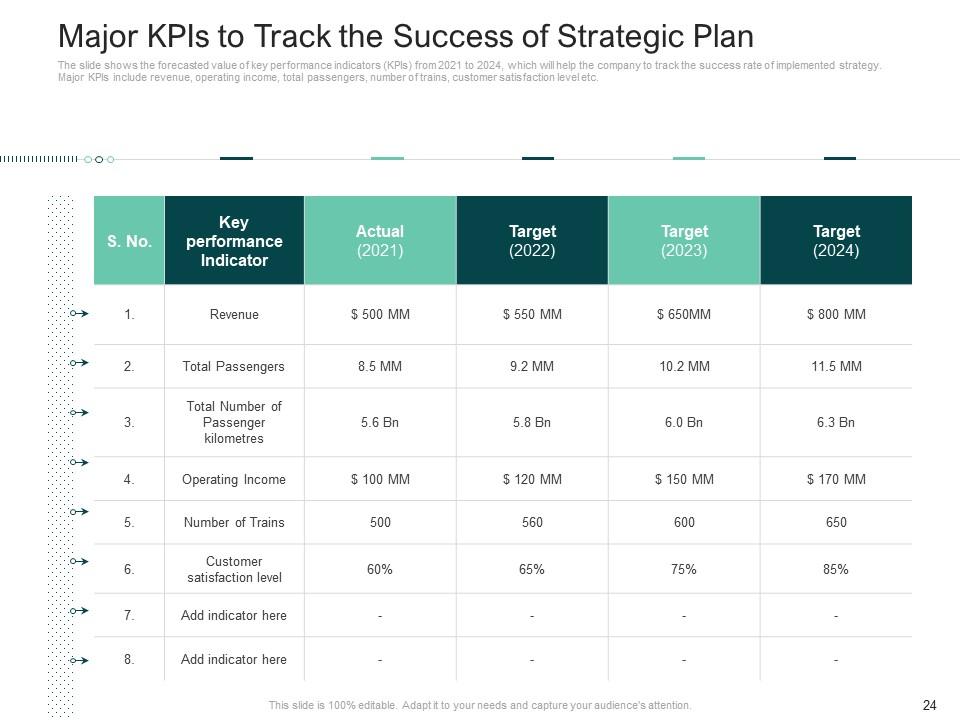
Slide 24: This slide is titled “Major KPIs to Track the Success of Strategic Plan.” It shows the forecasted value of key performance indicators (KPIs) from 2021 to 2024, which will help the company track the success rate of implemented strategy. Major KPIs include revenue, operating income, total passengers, number of trains, customer satisfaction level etc.
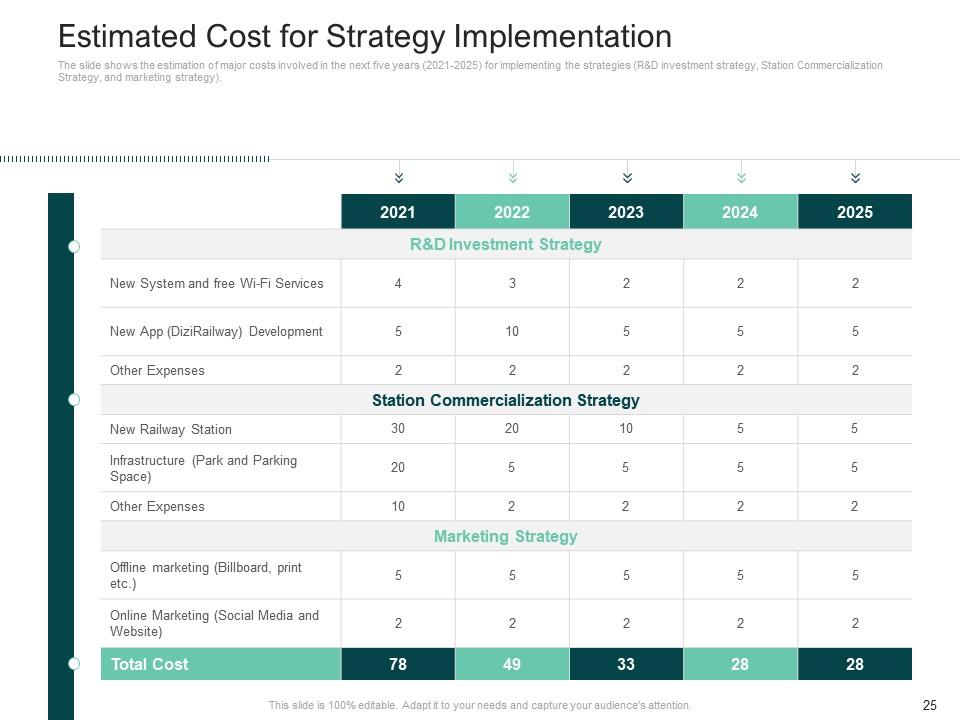
Slide 25: This slide is titled “Estimated Cost for Strategy Implementation.” It shows the estimation of major costs involved in the next five years (2021-2025) for implementing the strategies (R&D investment strategy, Station Commercialization Strategy, and marketing strategy).
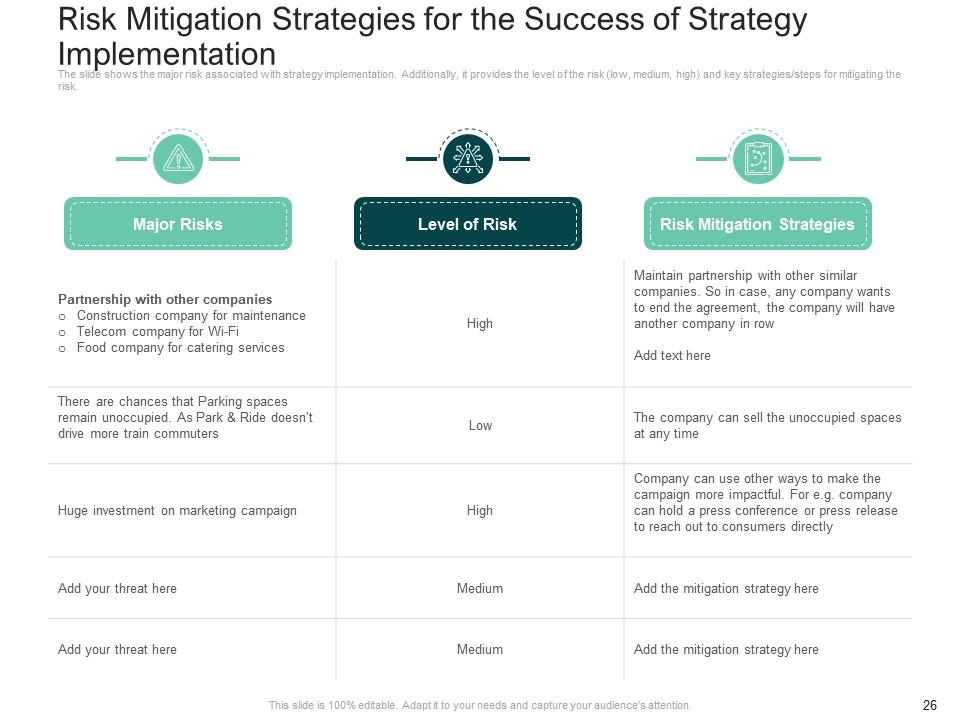
Slide 26: This slide is titled “Risk Mitigation Strategies for the Success of Strategy Implementation.” It shows the major risk associated with strategy implementation. Additionally, it shows the level of the risk (low, medium, high) and key strategies/steps for mitigating the risk.
Slide 27: This slide is titled “Table of Contents.” It shows Forecast - Post Strategy Implementation, Post Implementation - Total Number of Passenger Kilometre, Forecasted Number of Passenger Kilometre in 3 Different Scenario, etc.
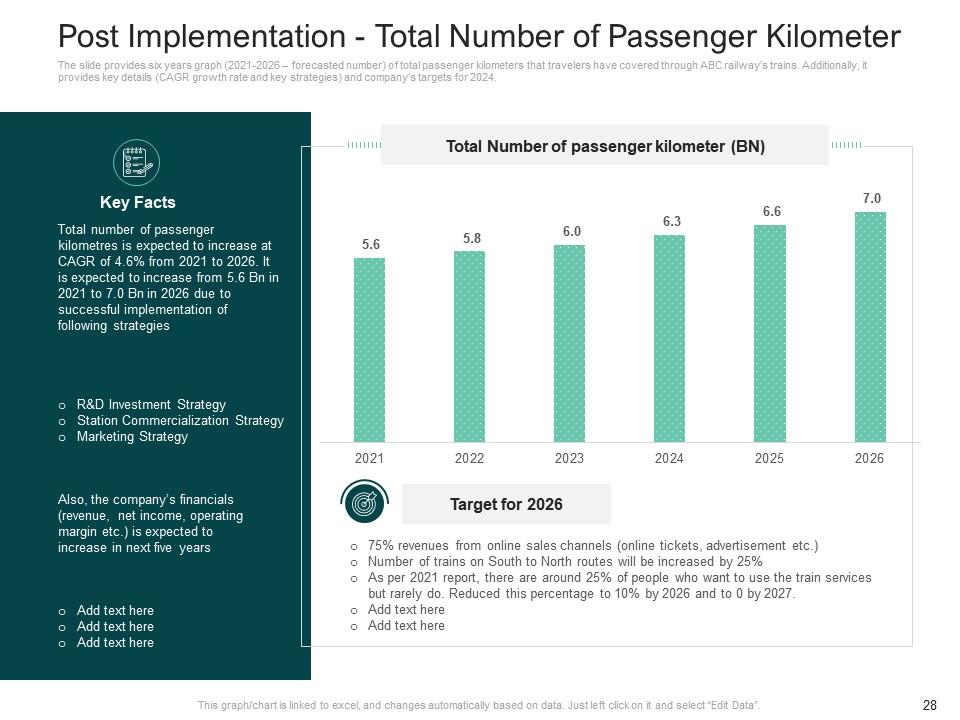
Slide 28: This slide is titled “R&D Investment Strategy.” It shows a six years’ graph (2021-2026 – forecasted number) of total passenger kilometers that travelers have covered through ABC railway’s trains. Additionally, it shows key details (CAGR growth rate and key strategies) and the company’s targets for 2024.
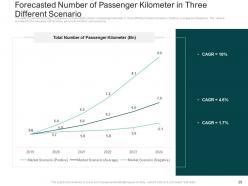
Slide 29: This slide is titled “Forecasted Number of Passenger Kilometres in Three Different Scenarios.” The slide shows the line graph comparison of the forecasted number of passenger kilometres in three different market scenarios.
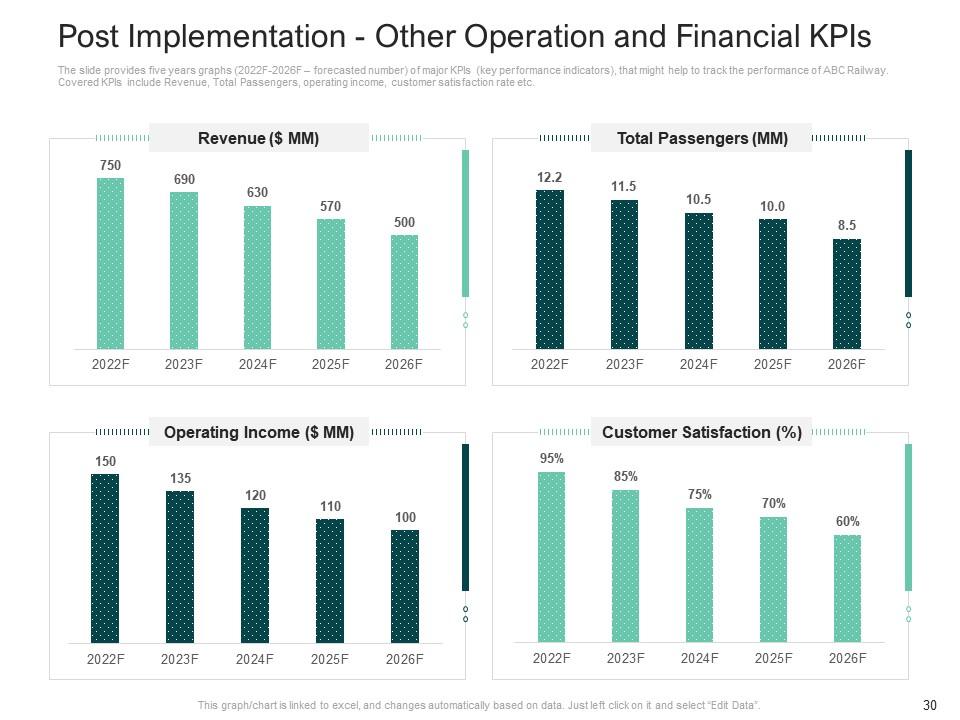
Slide 30: This slide is titled “Post Implementation - Other Operation and Financial KPIs.” It shows five years graphs (2022F-2026F – forecasted number) of major KPIs (key performance indicators), that might help to track the performance of ABC Railway. Covered KPIs include revenue, total passengers, operating income, customer satisfaction rate etc.
Slide 31: This slide is titled “Table of Contents.” It shows Dashboards – Railway Company Overview, Dashboards – Major KPIs of a Railway Company, and Dashboards - Positive Train Control (PTC) Implementation by Freight and Passenger Trains.
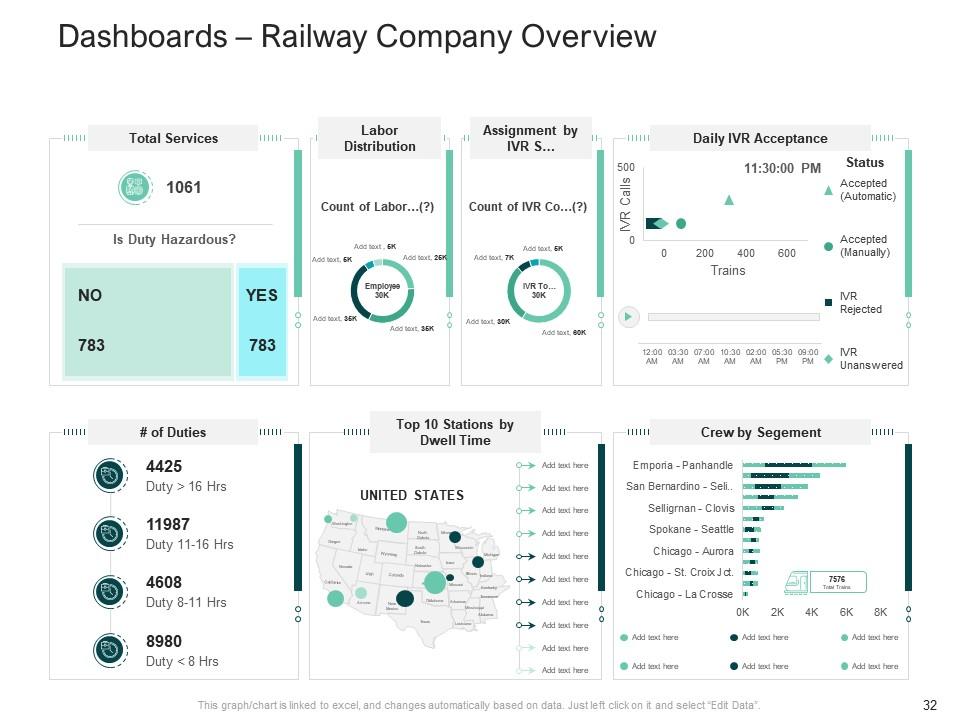
Slide 32: This slide is titled “Dashboards – Railway Company Overview.” It showcases various scenarios for different use cases.
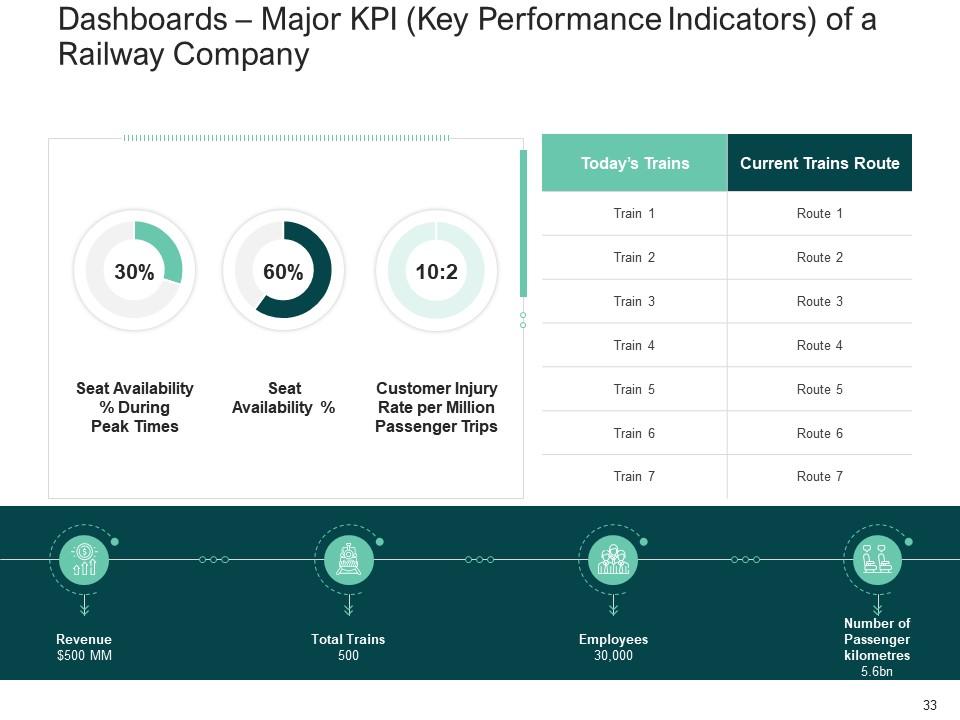
Slide 33: This slide is titled “Dashboards – Major KPI (Key Performance Indicators) of a Railway Company.” It shows seat availability chances for different situations.
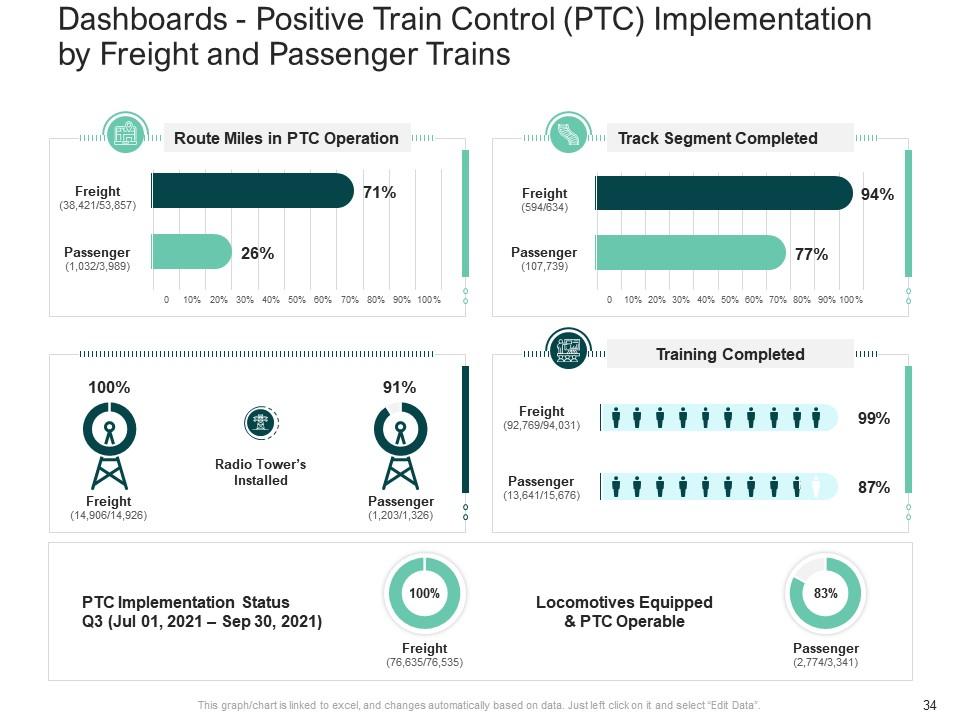
Slide 34: This slide is titled “Dashboards - Positive Train Control (PTC) Implementation by Freight and Passenger Trains.” It shows different statistics for different types of trains.
Slide 35: This slide is titled “Strategies to Improve the Perception of a Railway Company (Case Competition) Icons Slide.”
Slide 36: This slide is titled “Additional Slides.”
Slide 37: This slide is titled “About Us.” This slide contains the information about the company, aka the ‘About Us’ section. This includes the Value Clients, the Target Audience, and Preferred by Many.
Slide 38: This slide is titled “Our Team.” Add the name and designation of your team.
Slide 39: This slide is titled “Our Mission.” It provides the Mission for the entire company. This includes the vision, the mission, and the goal.
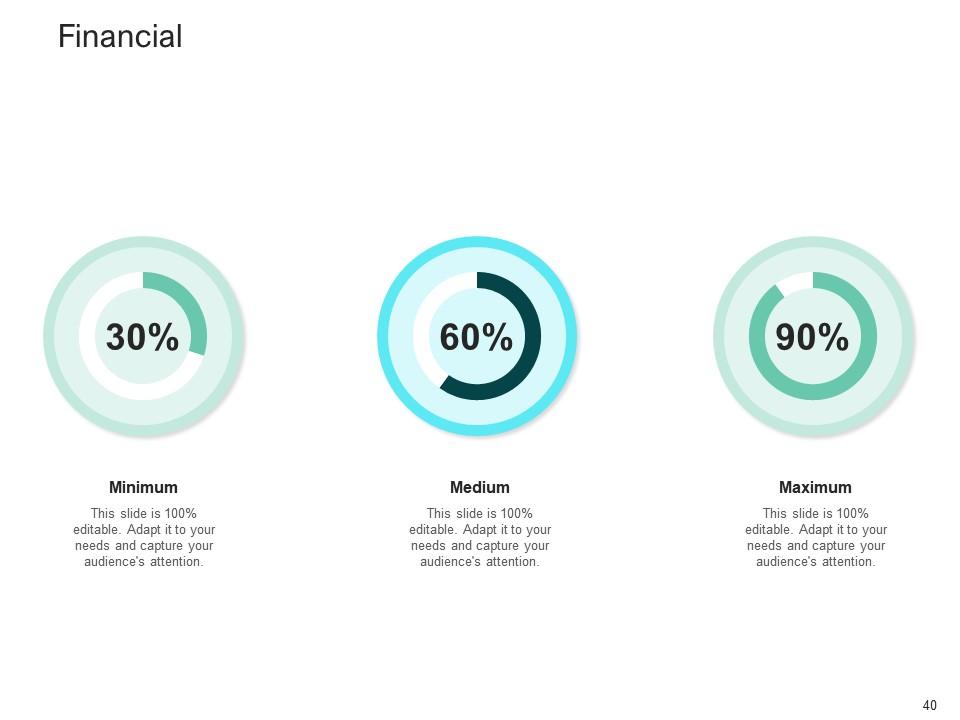
Slide 40: This slide is titled “Financial.” It shows a bar graph that compares 3 products’ sales over a timeline of financial years.
Slide 41: This slide is titled “Post It Notes.” It contains Post-It Notes that can be used to express any brief thoughts or ideas.
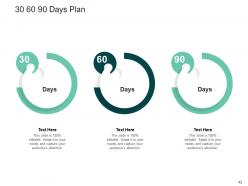
Slide 42: This is a slide with a 30-60-90-Days Plan to set goals for these important intervals.
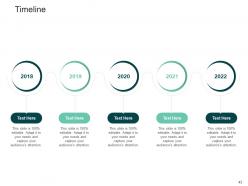
Slide 43: This slide is titled “Timeline.” It is a Timeline template to showcase the progress of the steps of a project with time.
Slide 44: This slide is titled “Thank You for Watching!”
Strategies to improve the perception of a railway company case competition complete deck with all 44 slides:
Use our Strategies To Improve The Perception Of A Railway Company Case Competition Complete Deck to effectively help you save your valuable time. They are readymade to fit into any presentation structure.
-
Editable templates with innovative design and color combination.
-
Design layout is very impressive.
-
Amazing product with appealing content and design.
-
Out of the box and creative design.


