Financing Forecasting Process And Methods Powerpoint Presentation Slides
Company’s investors will expect to see your financial forecast, profit, and loss statement and cash flow, etc. Therefore, we present our financing forecasting process and methods PowerPoint presentation slides. This budget forecasting PPT presentation will assess the effectiveness with which funds are employed and the profitability of its operations. We have included required templates like fiscal KPI’s like balance sheet, cash flow statements, financial projections, key funding ratios. It also covers ratio analysis, P&L overview, funding updates, etc., in this complete PowerPoint presentation. Using these financial prediction PPT slides, a middle-level manager can depict the company’s budget to top management. If you are planning to create a presentation on the financial forecast, demand forecast, cash flow prediction, economic forecasting, fiscal modeling, qualitative forecasting methods, etc., in future our demand forecast PowerPoint templates will be useful for you. The best thing about our financial prediction PPT designs is that they can be customized as per your needs. What are you waiting for? Download this amazing financing forecasting process and methods PowerPoint presentation template. Facilitate better coordination with our Financing Forecasting Process And Methods Powerpoint Presentation Slides. Create the desire to act cohesively.
- Google Slides is a new FREE Presentation software from Google.
- All our content is 100% compatible with Google Slides.
- Just download our designs, and upload them to Google Slides and they will work automatically.
- Amaze your audience with SlideTeam and Google Slides.
-
Want Changes to This PPT Slide? Check out our Presentation Design Services
- WideScreen Aspect ratio is becoming a very popular format. When you download this product, the downloaded ZIP will contain this product in both standard and widescreen format.
-

- Some older products that we have may only be in standard format, but they can easily be converted to widescreen.
- To do this, please open the SlideTeam product in Powerpoint, and go to
- Design ( On the top bar) -> Page Setup -> and select "On-screen Show (16:9)” in the drop down for "Slides Sized for".
- The slide or theme will change to widescreen, and all graphics will adjust automatically. You can similarly convert our content to any other desired screen aspect ratio.
Compatible With Google Slides

Get This In WideScreen
You must be logged in to download this presentation.
PowerPoint presentation slides
Presenting financing forecasting process and methods PowerPoint presentation slides. This presentation consists 74 professionally outlined PowerPoint slides, all of them being 100 percent changeable in PowerPoint. Content fonts dimension and type, colors and template background of the presentation slides are customizable. The presentation templates can be downloaded in both wide screen (16:9) and standard view (4:3) aspect ratio. The PPT templates are entirely adjustable with Google Slides and other online applications. PowerPoint slides can be saved in various formats such as JPG or PDF. You can add the organization name or logo to personalize the PowerPoint slides. Premium product support is provided.
People who downloaded this PowerPoint presentation also viewed the following :
Content of this Powerpoint Presentation
Slide 1: This slide introduces Financing Forecasting Process and Methods. State the name of your company here and get started.
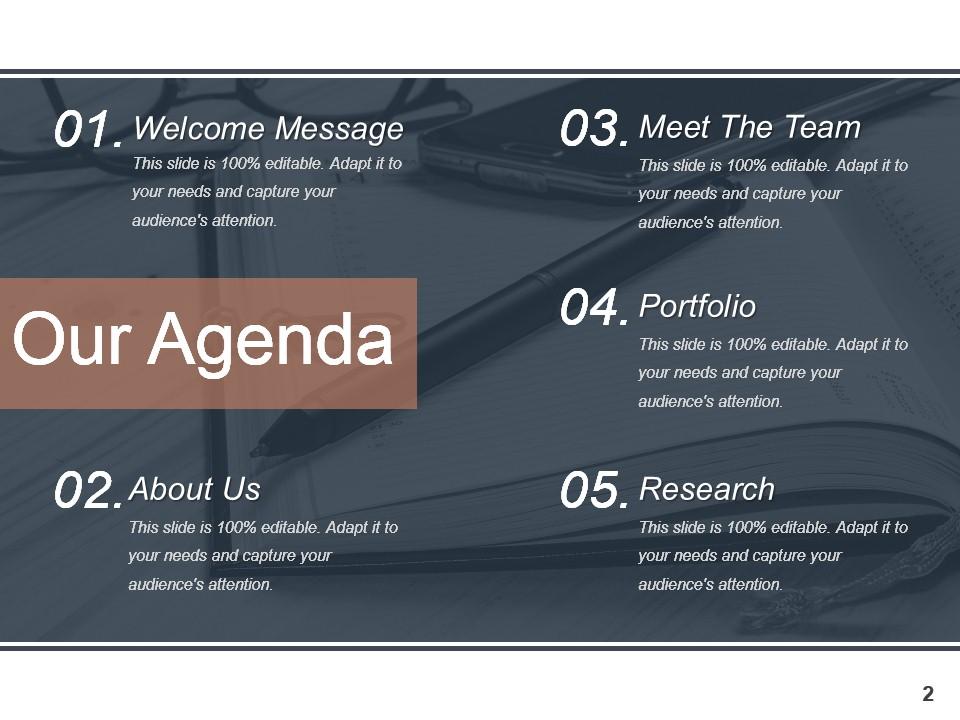
Slide 2: This slide shows Our Agenda which consists of the following points- Welcome Message, About Us, Meet The Team, Research, Portfolio.
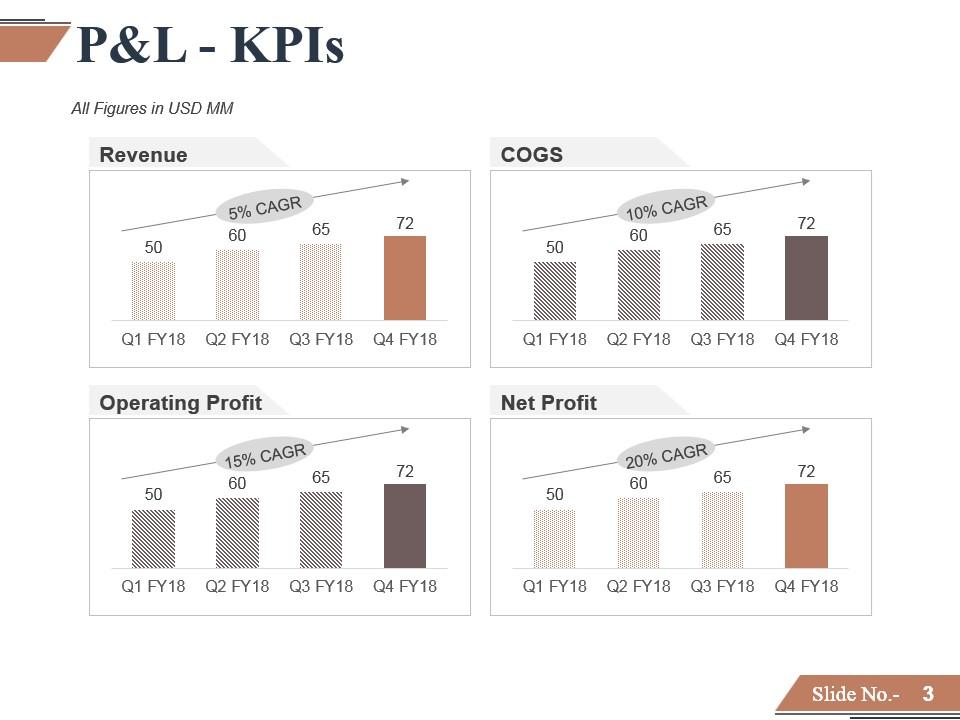
Slide 3: This slide presents P&L - KPIs graphically showing- Revenue, COGS, Operating Profit, Net Profit.
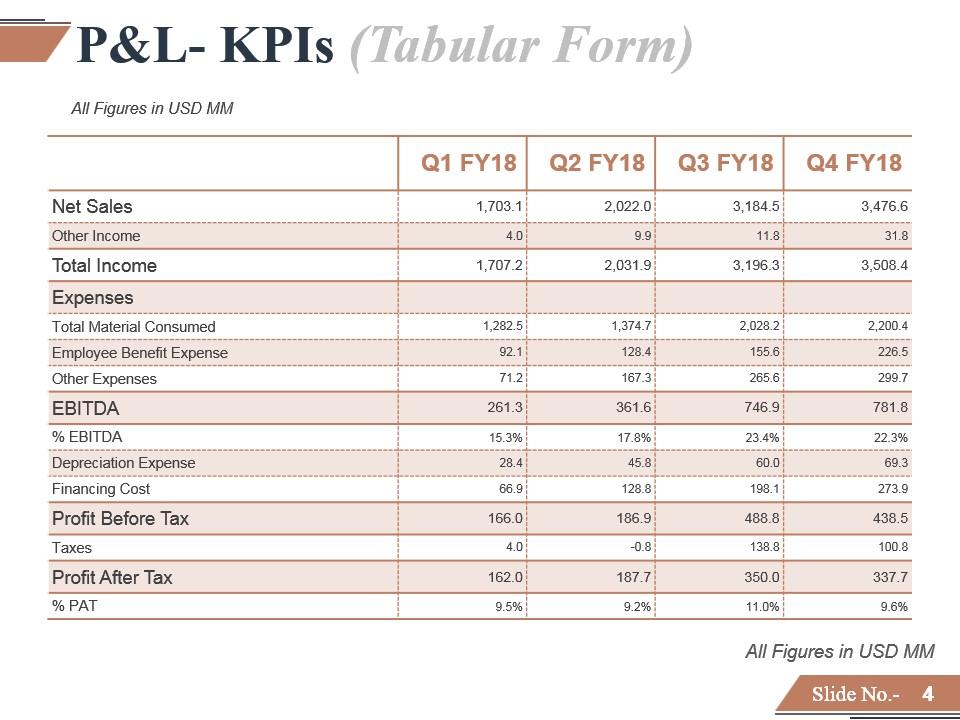
Slide 4: This slide shows P&L- KPIs (Tabular Form).
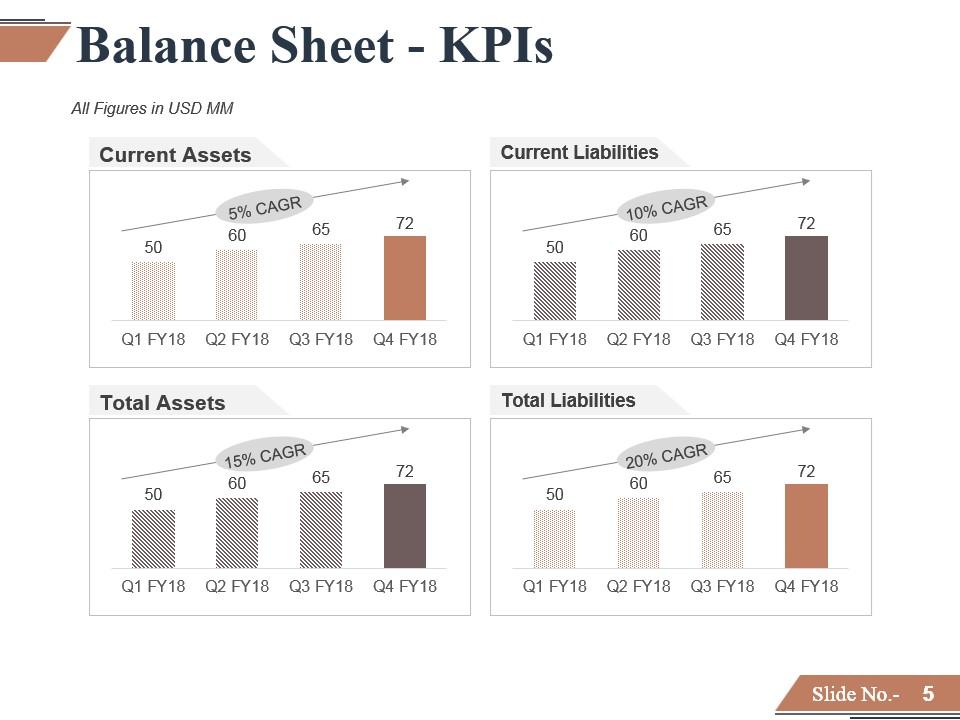
Slide 5: This is a Balance Sheet - KPIs slide showing- Current Assets, Current Liabilities, Total Assets, Total Liabilities.
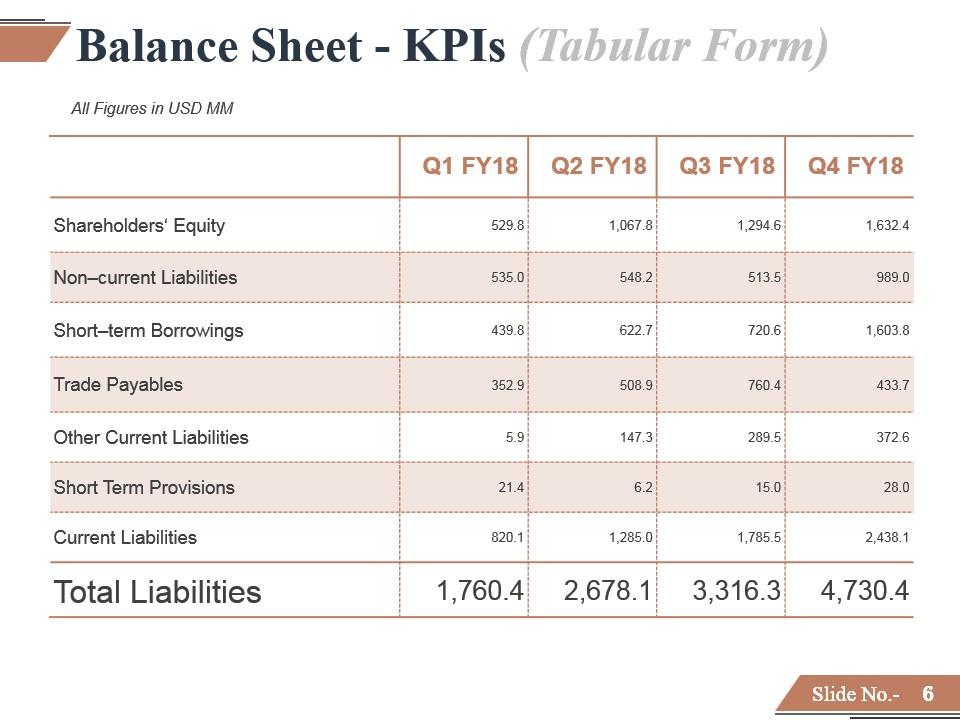
Slide 6: This slide shows Balance Sheet - KPIs (Tabular Form).
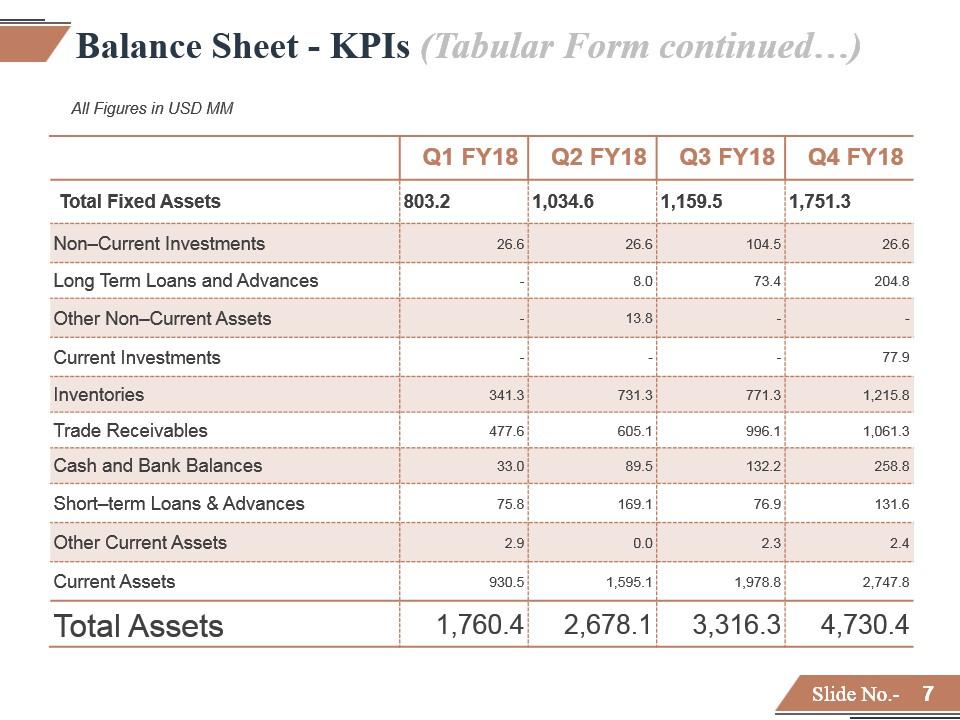
Slide 7: This is another slide showing Balance Sheet - KPIs (Tabular Form continued…).
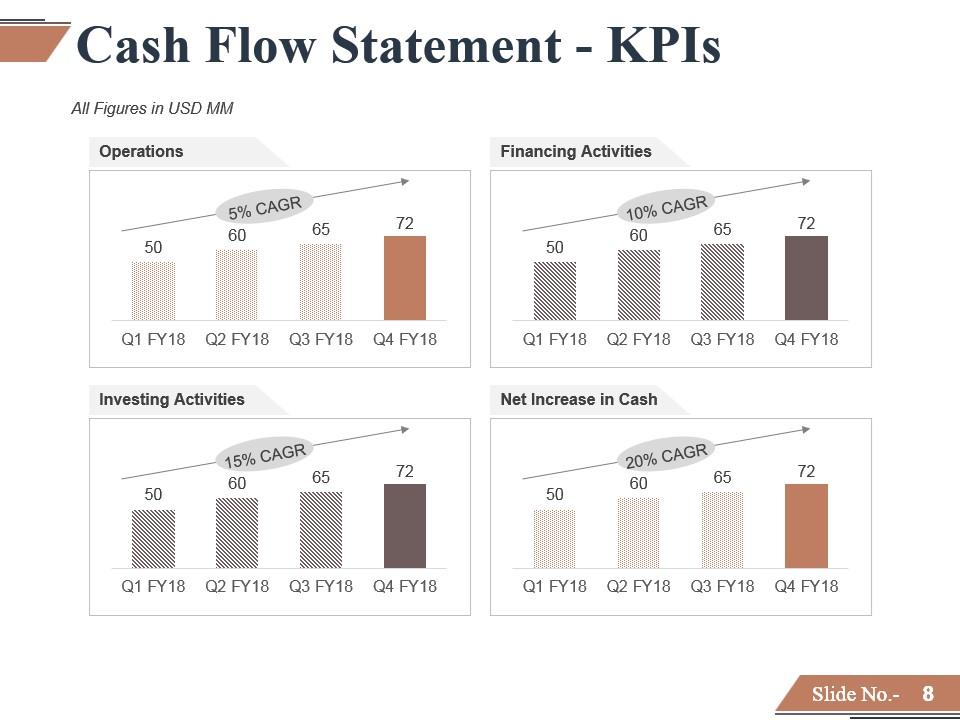
Slide 8: This is a Cash Flow Statement - KPIs slide showing- Operation, Financing Activities, Investing Activities, Net Increase in Cash.
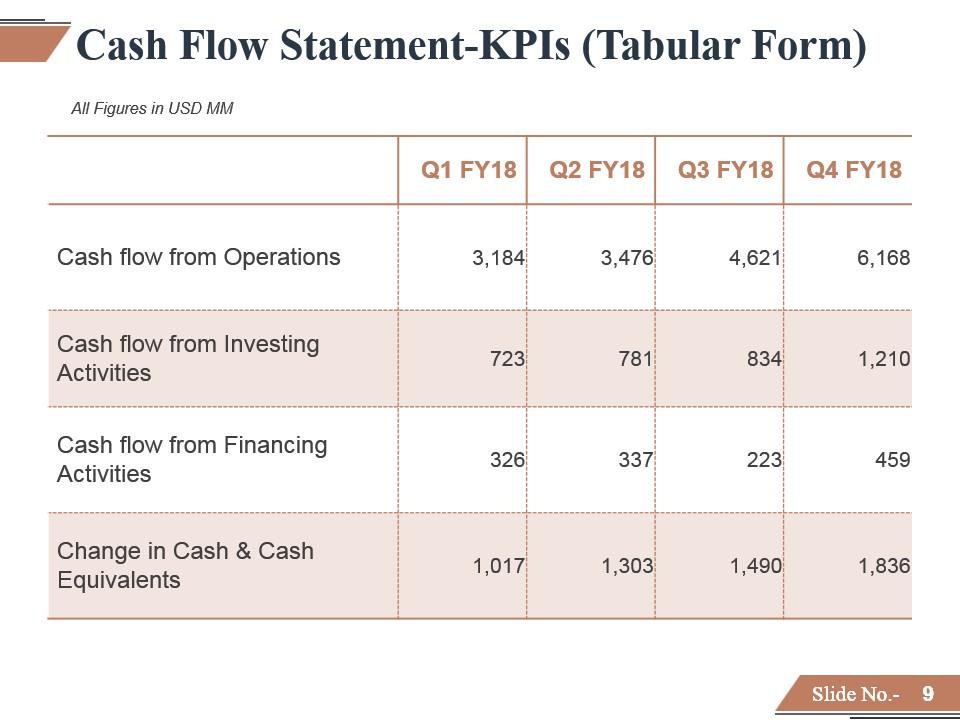
Slide 9: This slide shows Cash Flow Statement-KPIs (Tabular Form).
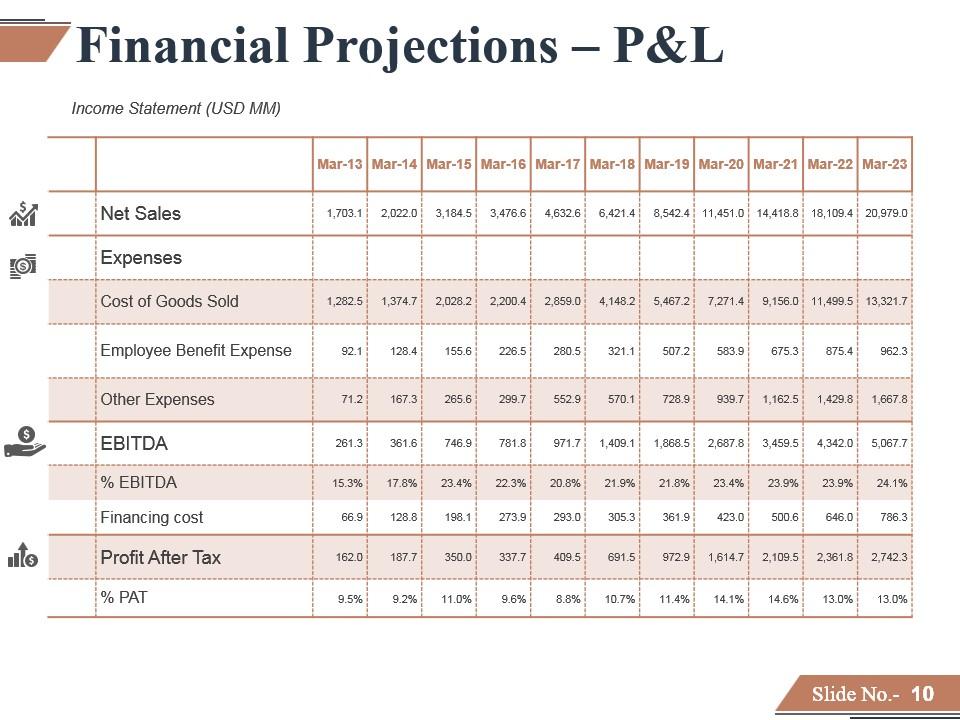
Slide 10: This slide shows Financial Projections – P&L table.
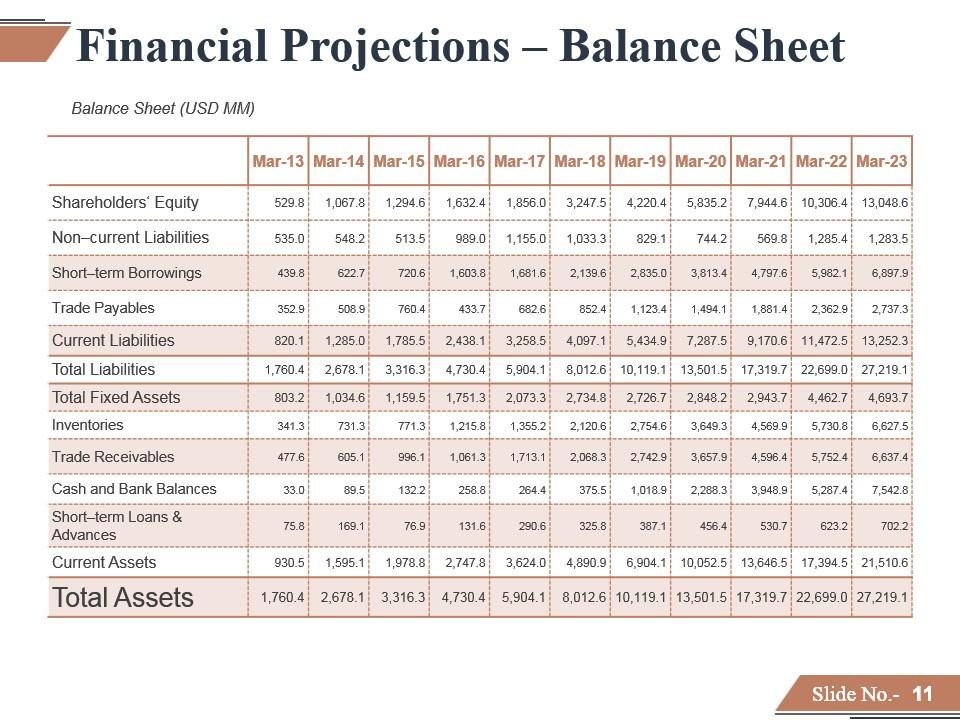
Slide 11: This slide shows Financial Projections – Balance Sheet.
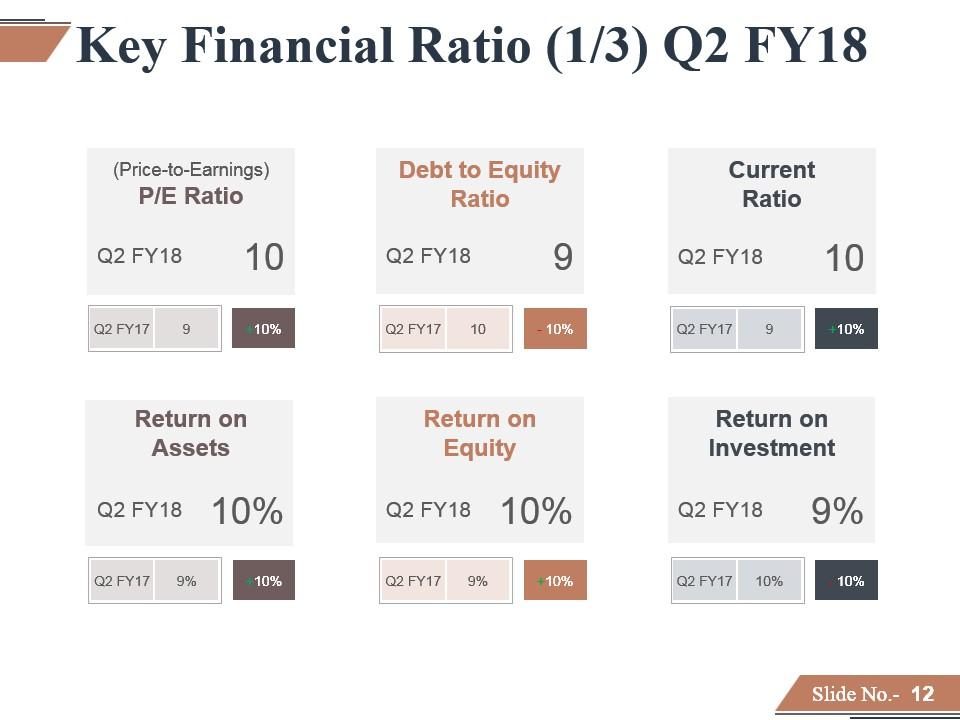
Slide 12: This slide shows Key Financial Ratio (1/3) Q2 FY18 which include- Debt to Equity Ratio, Return on Equity, Return on Assets, Current Ratio, Return on Investment, P/E Ratio (Price-to-Earnings).
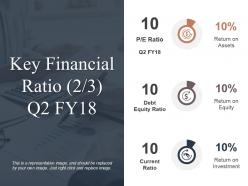
Slide 13: This slide also shows Key Financial Ratio (2/3) Q2 FY18.
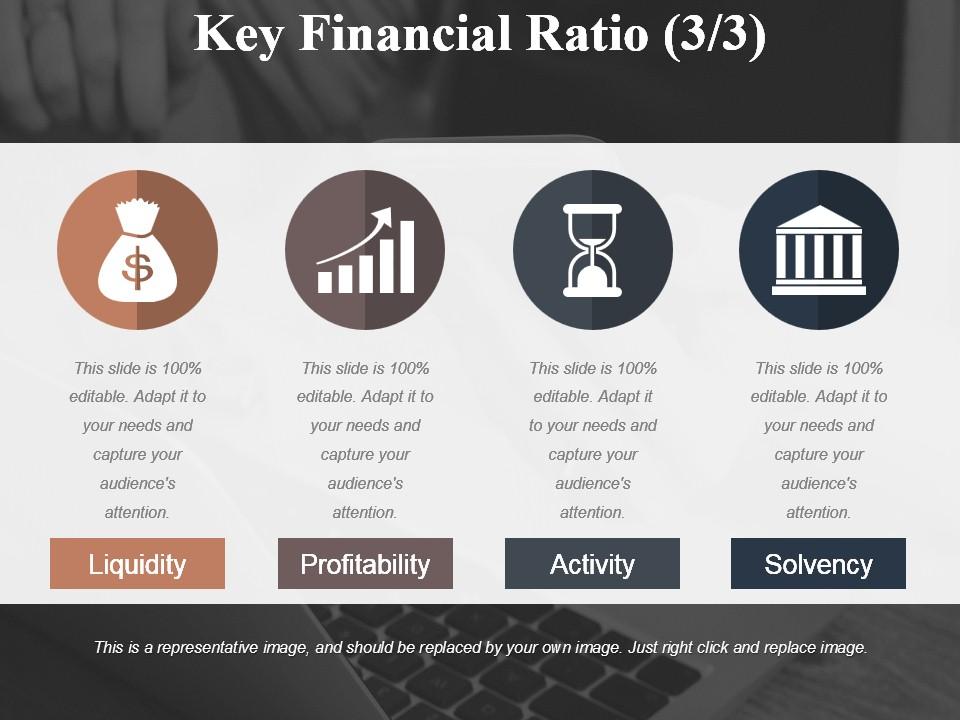
Slide 14: This is another slide showing Key Financial Ratio (3/3) involving- Liquidity, Solvency, Activity, Profitability.
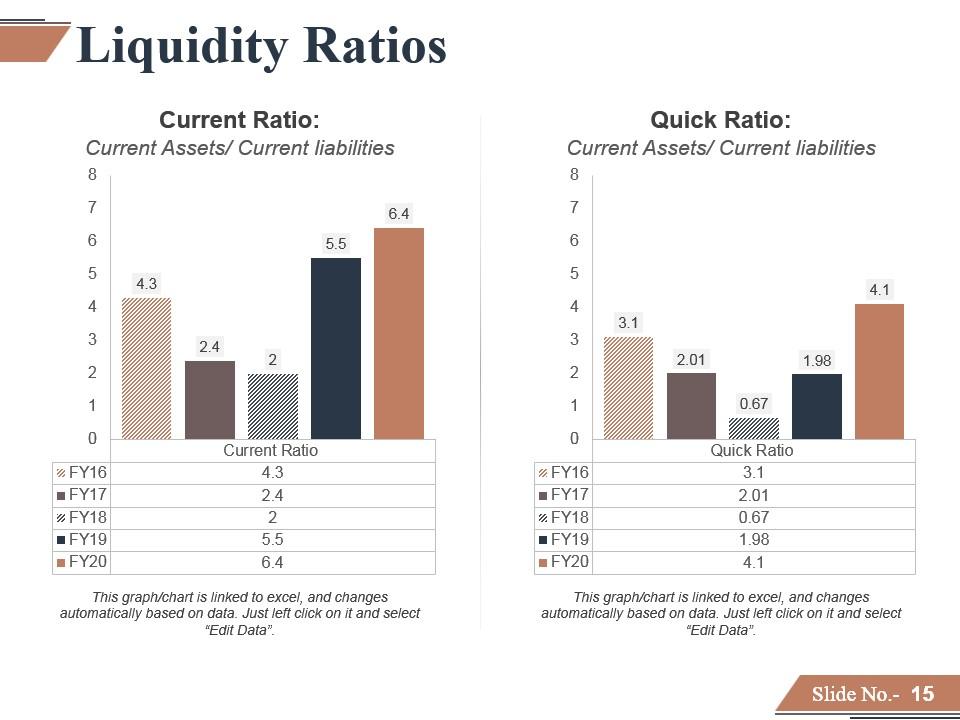
Slide 15: This slide presents Liquidity Ratios- Current Ratio and Quick Ratio in a bar chart/ graph form.
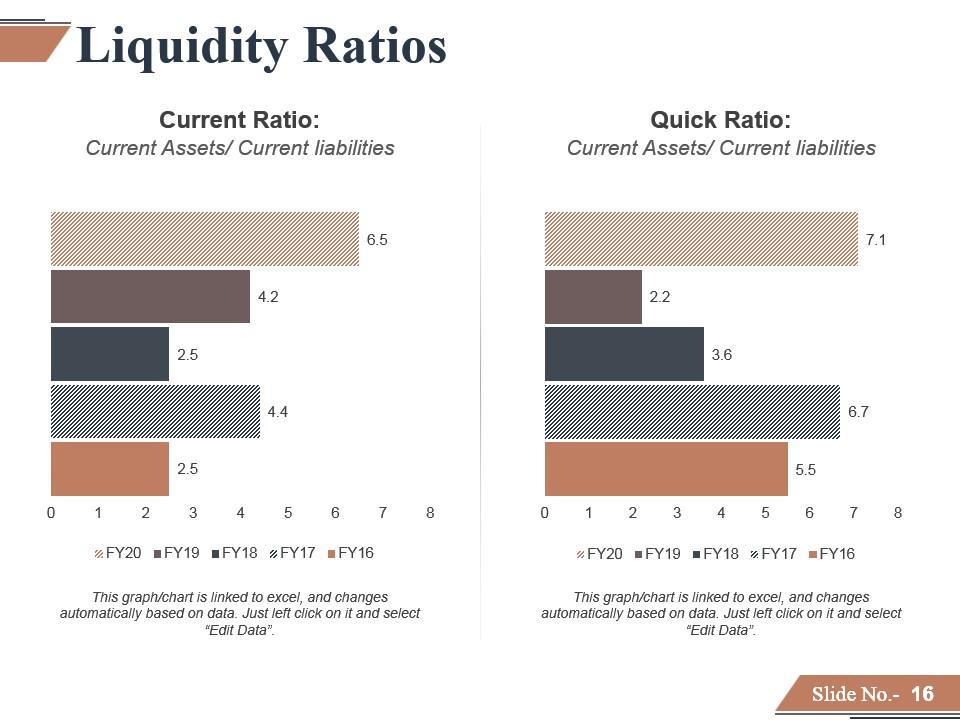
Slide 16: This slide also shows Liquidity Ratios graphically.
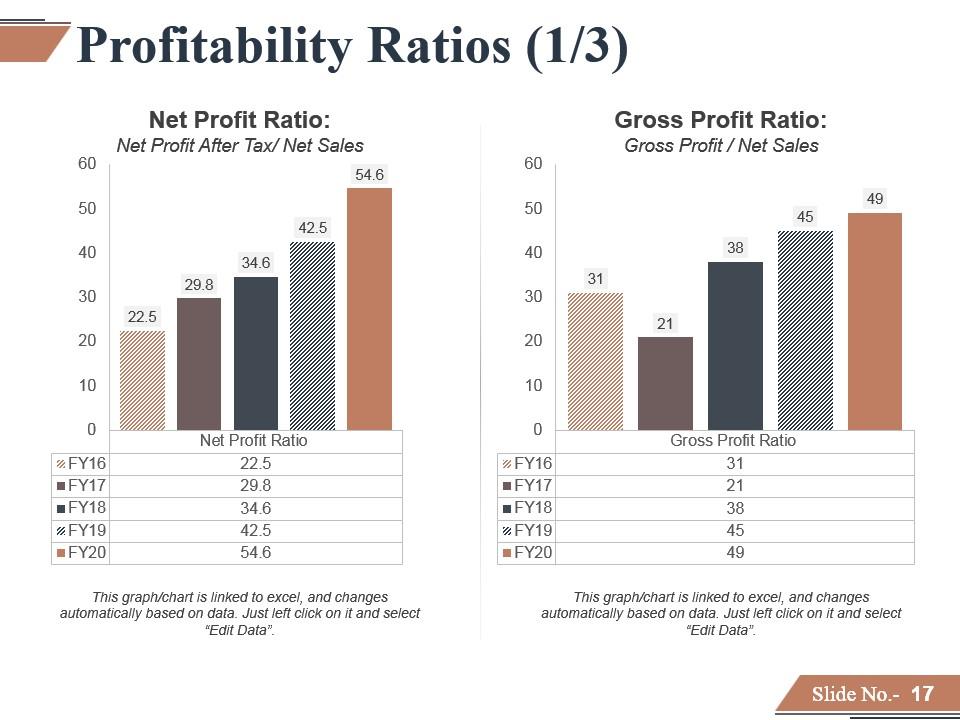
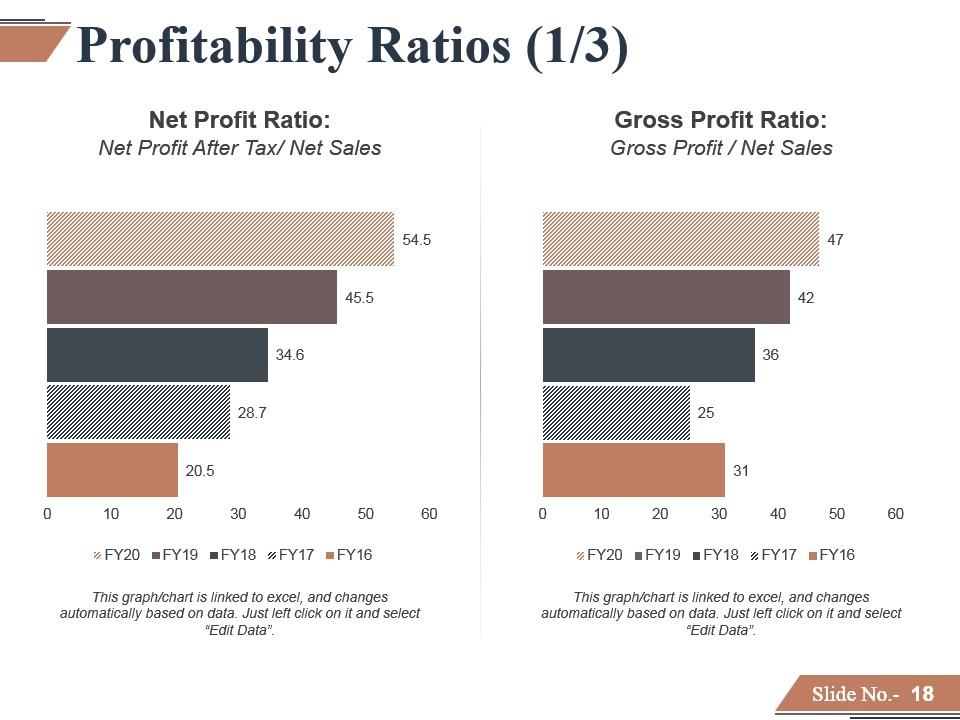
Slide 17: This is first slide showing Profitability Ratios (1/3) further divided into- Net Profit Ratio, Gross Profit Ratio.
Slide 18: This slide also shows a graphical representation of Profitability Ratios (1/3).
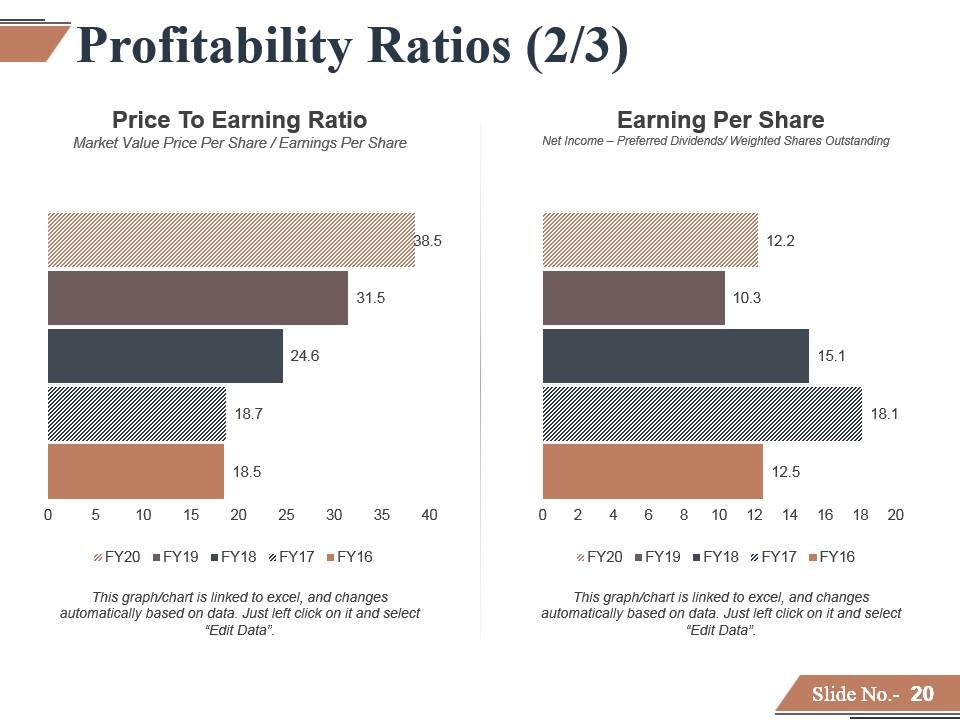
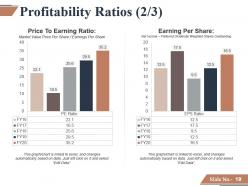
Slide 19: This is second Profitability Ratios (2/3) slide showing- Price To Earning Ratio- Market Value Price Per Share / Earnings Per Share, Earning Per Share- Net Income – Preferred Dividends/ Weighted Shares Outstanding.
Slide 20: This is third slide showing Profitability Ratios (2/3).
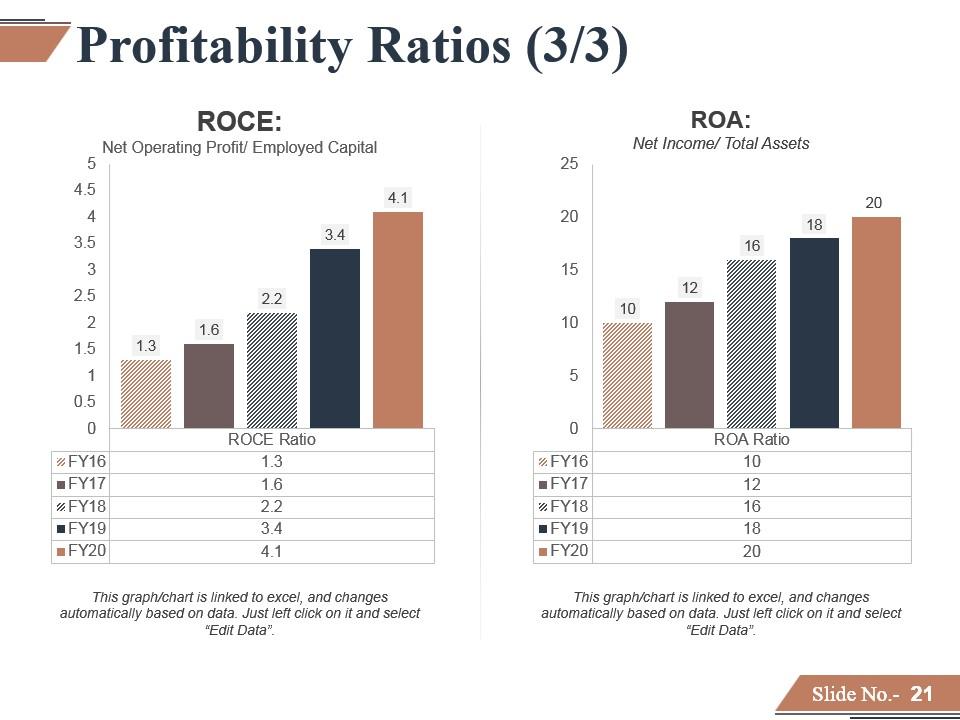
Slide 21: This is fourth slide showing Profitability Ratios (3/3).
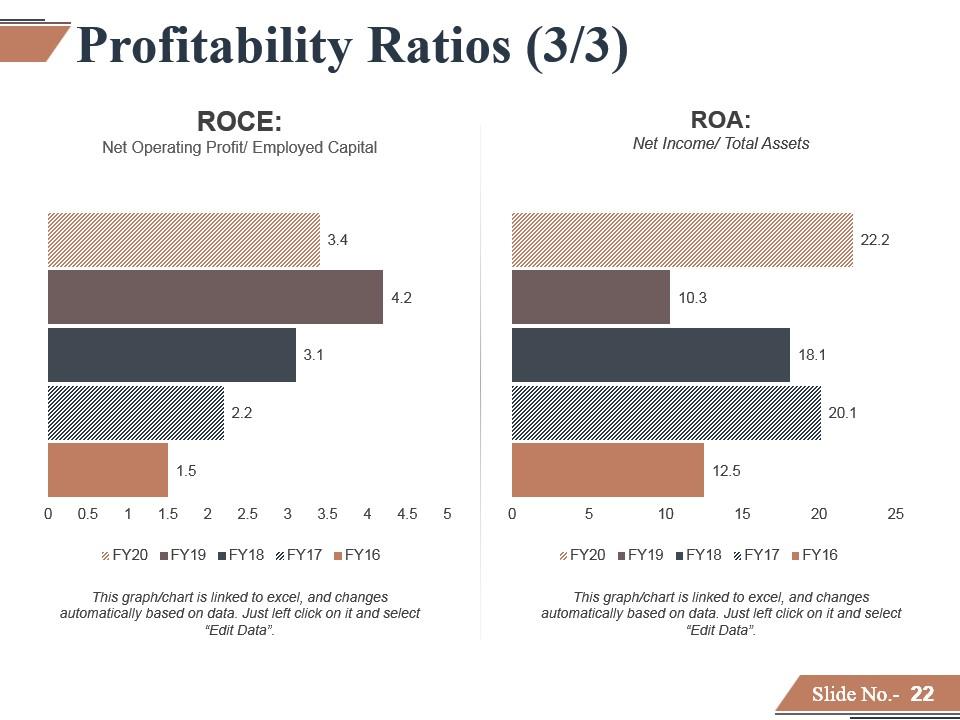
Slide 22: This is fifth slide showing Profitability Ratios (3/3).
Slide 23: This is a Coffee Break image slide to halt. Edit as per need.
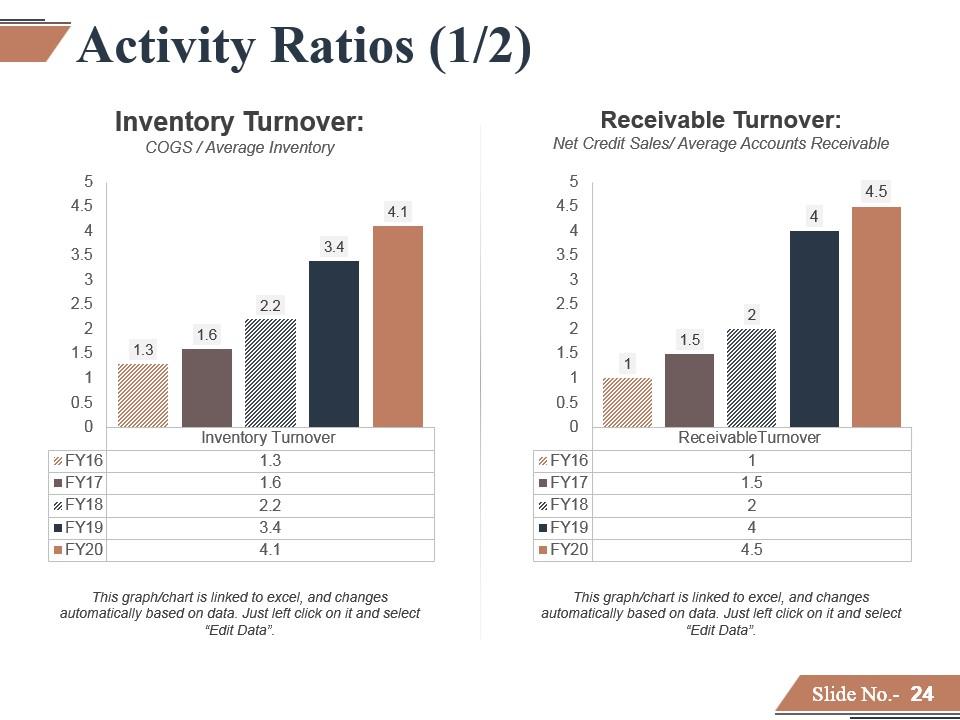
Slide 24: This is the first slide showing Activity Ratios (1/2) graphically.
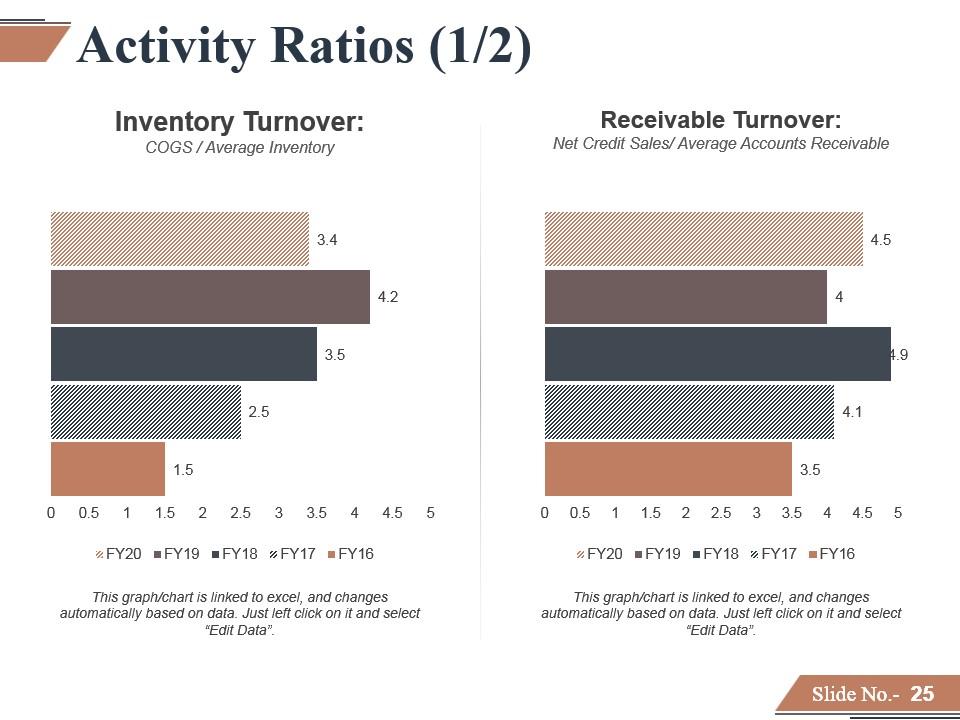
Slide 25: This is the second slide showing Activity Ratios (1/2).
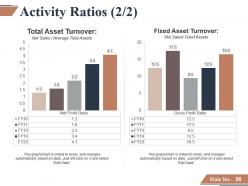
Slide 26: This is third slide showing Activity Ratios (2/2).
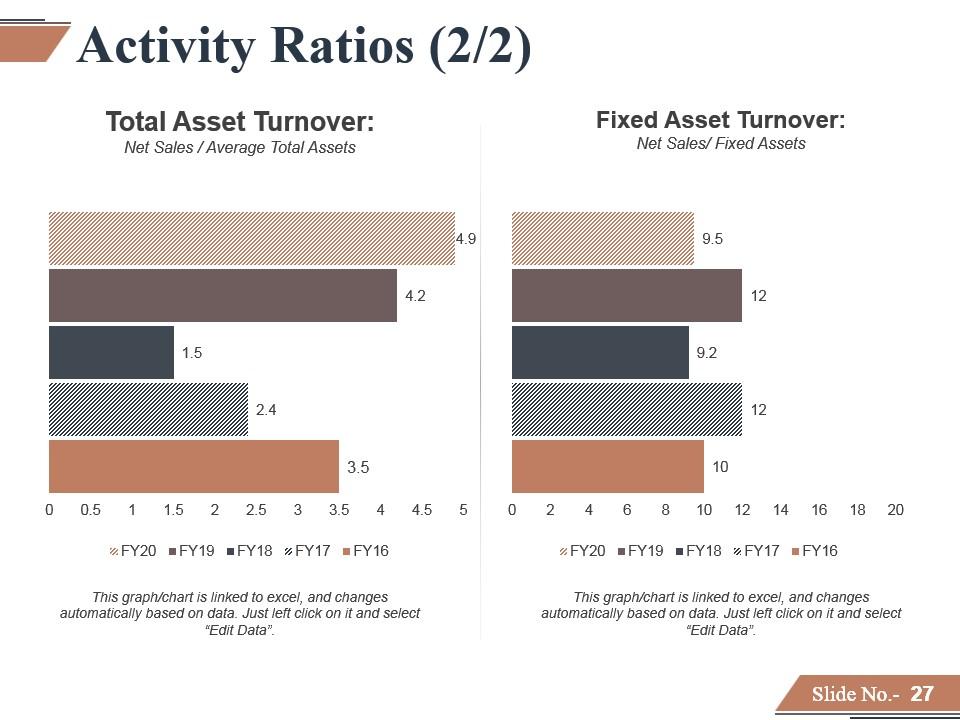
Slide 27: This is fourth slide showing Activity Ratios (2/2).
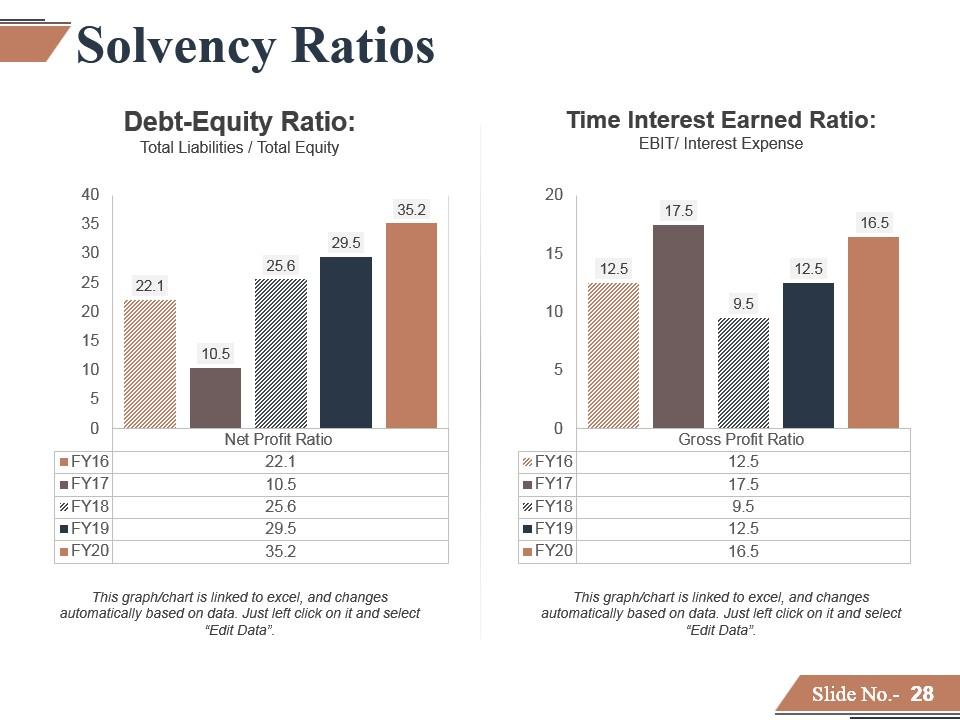
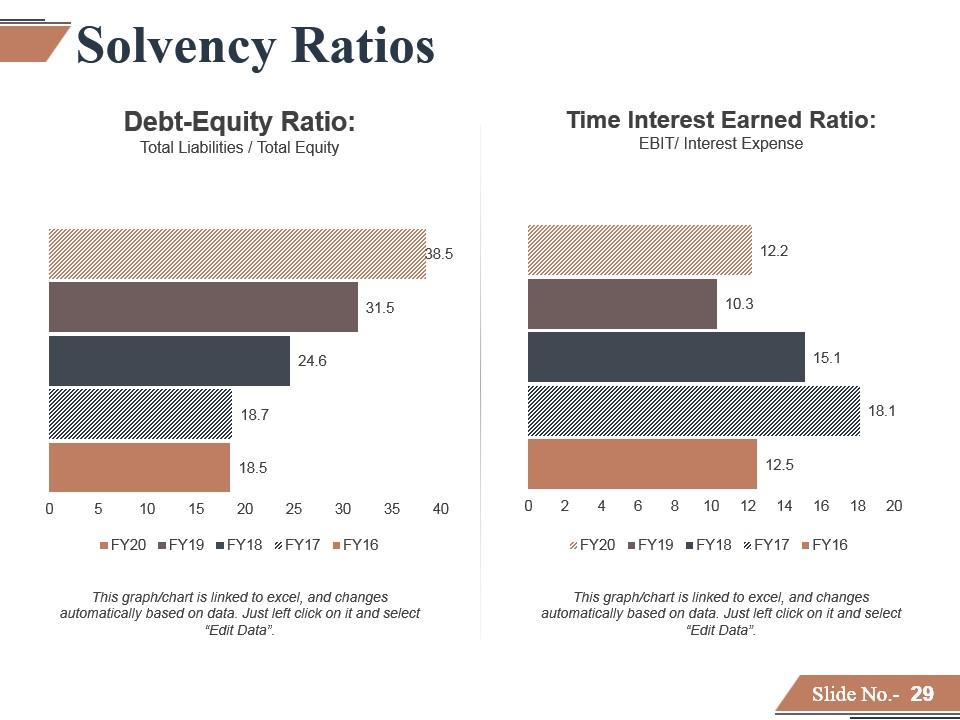
Slide 28: This slide shows Solvency Ratios- Debt-Equity Ratio, Time Interest Earned Ratio.
Slide 29: This slide also shows a graphical representation of Solvency Ratios.
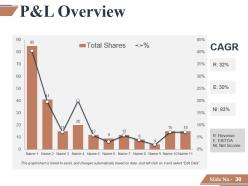
Slide 30: This slide presents P&L Overview graph.
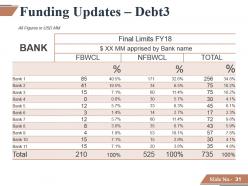
Slide 31: This slide presents Funding Updates - Debt in a tabular form.
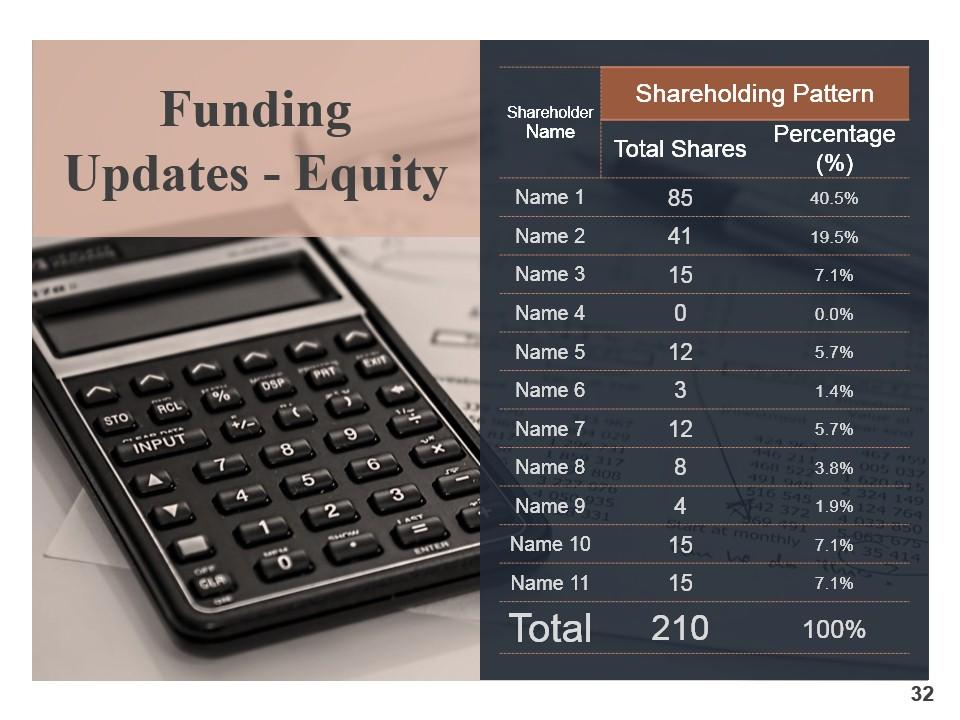
Slide 32: This slide also presents Funding Updates - Equity table.
Slide 33: This slide shows Icons for Financial Forecasting Process and Methods. Alter the icons as per your requirement.
Slide 34: This slide is titled Additional Slides to move forward. Alter as per need.
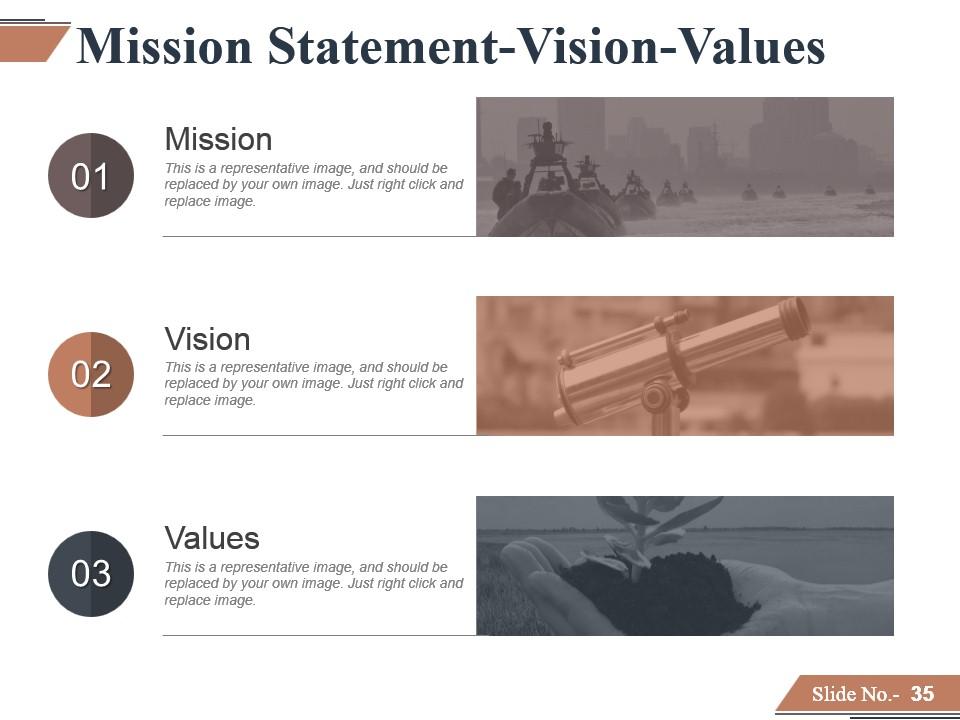
Slide 35: This slide shows Mission Statement-Vision-Values. State your mission, vision and values here.
Slide 36: This slide helps show- About Our Company with Target Audiences, Preferred by Many and Values Client as examples.
Slide 37: This is WE ARE THE CREATIVE TEAM slide with name and designation to fill.
Slide 38: This is Our Goal slide. State your goals here.
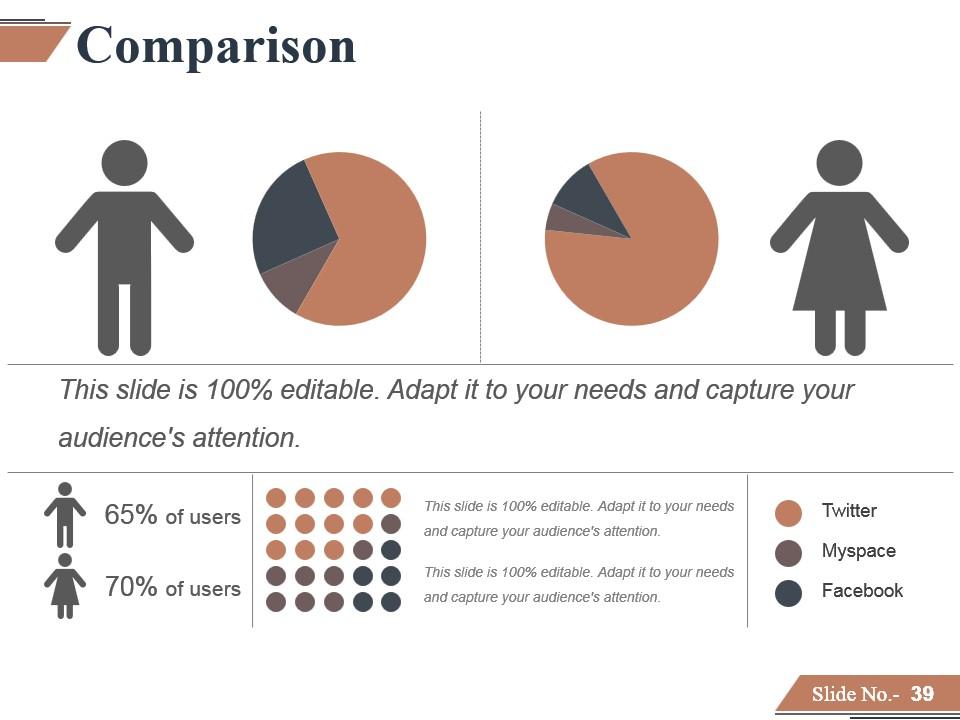
Slide 39: This is a Comparison slide to show comparison of two entities/ products etc.
Slide 40: This is a Quotes slide to convey company/ organization message, beliefs etc. You may change the slide content as per need.
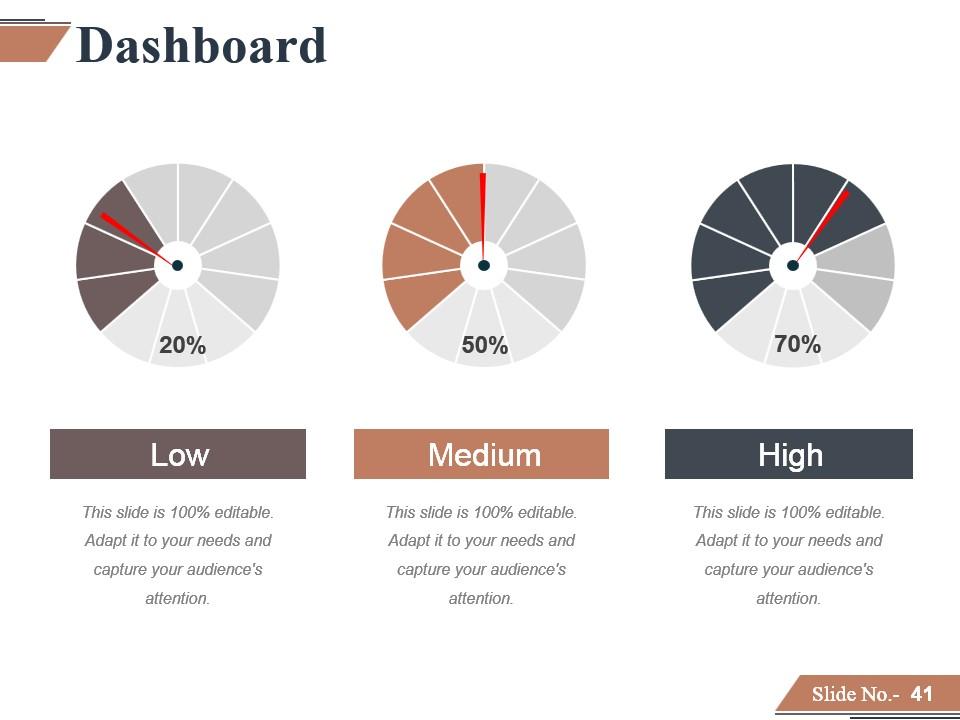
Slide 41: This is a Dashboard slide to state Low, Medium and High aspects, kpis, metrics etc.
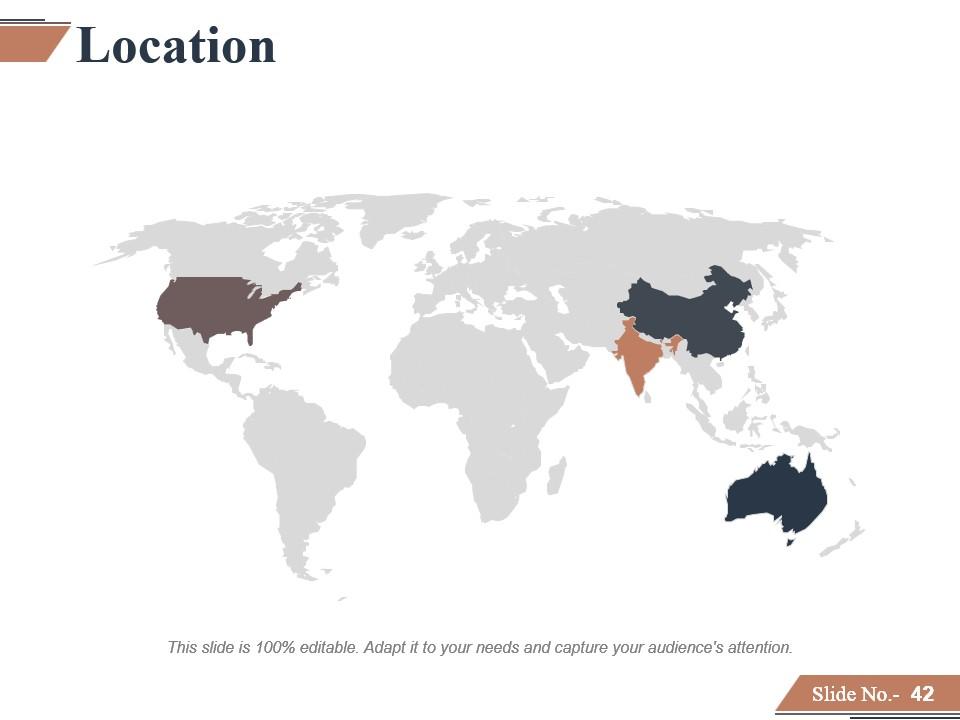
Slide 42: This is a Location slide to show global segregation, presence etc. on a world map image and text boxes to make it explicit.
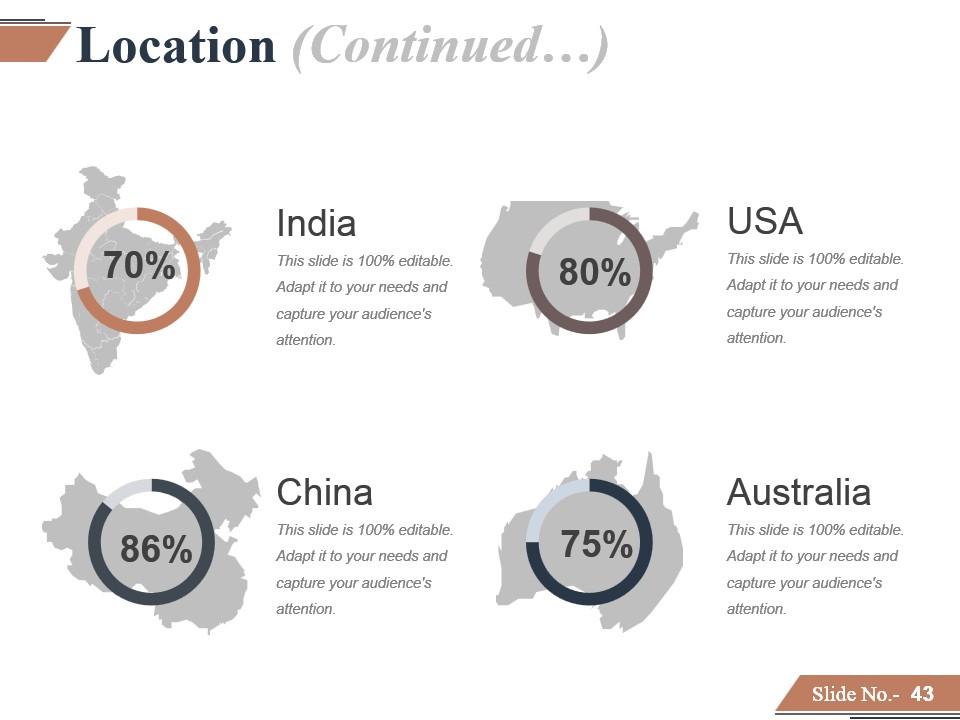
Slide 43: This is also a Location slide to show global segregation, presence etc. on map images and text boxes to make it explicit.
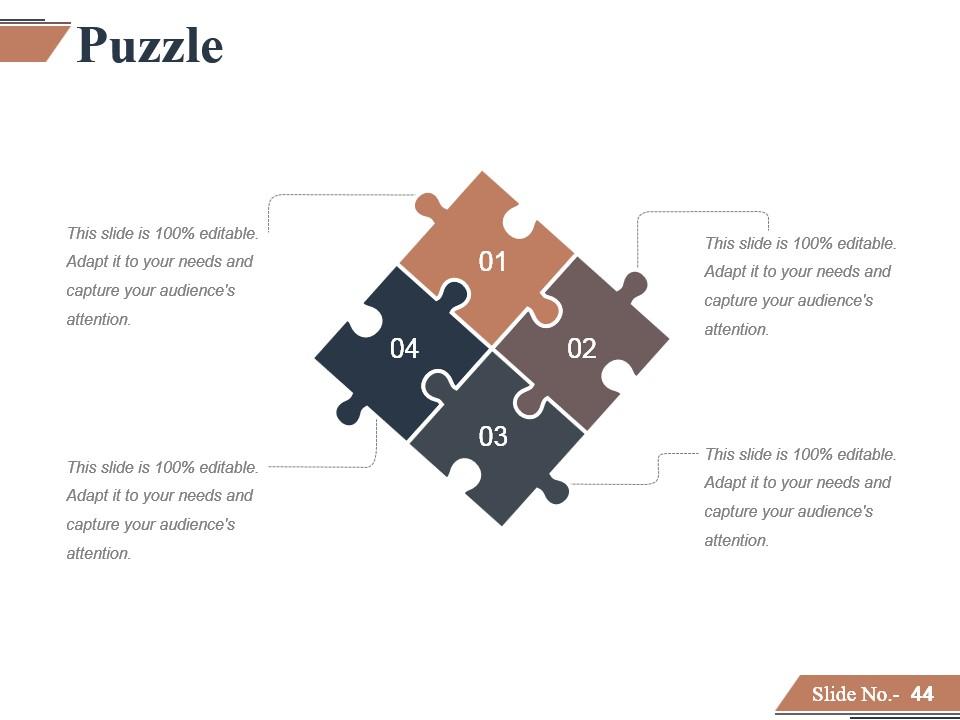
Slide 44: This is a Puzzle pieces image slide to show information, specifications etc.
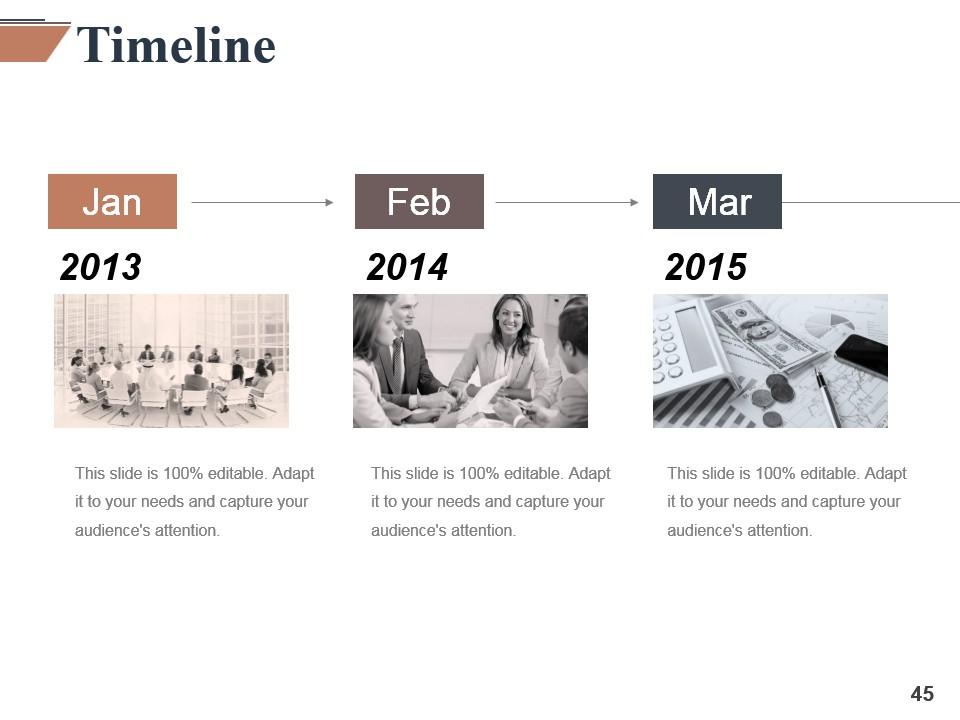
Slide 45: This is a Timeline slide to present important dates, journey, evolution, milestones etc.
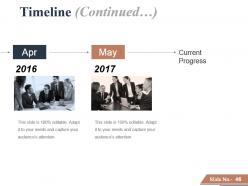
Slide 46: This is a Timeline slide to present important dates, journey, evolution, milestones etc.
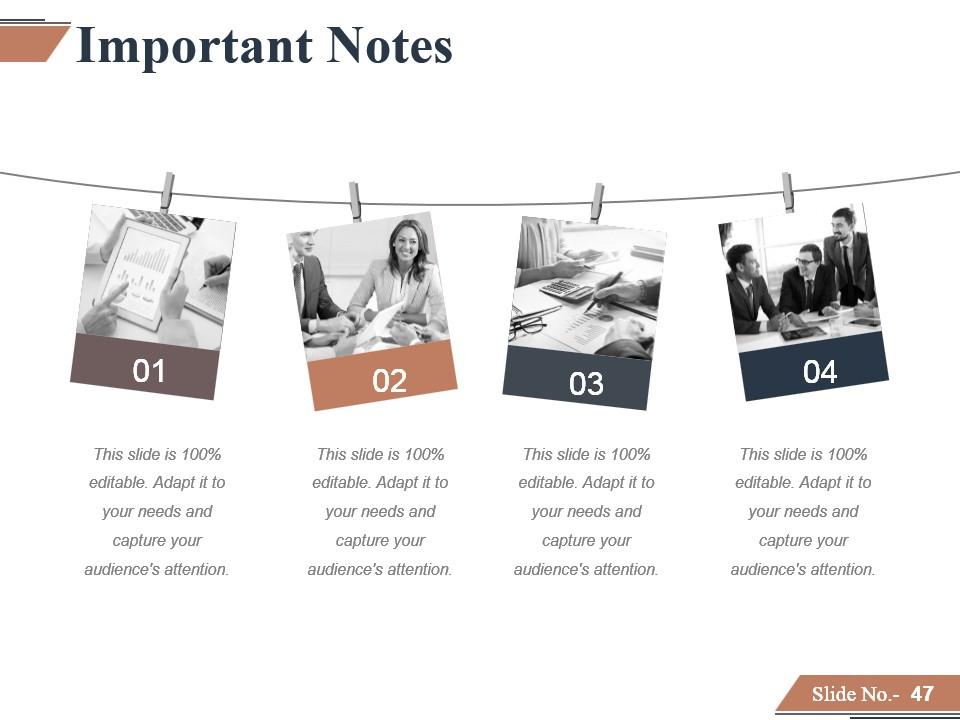
Slide 47: This slide showcases Important Notes to be displayed. Show events, important piece of information, events etc. here.
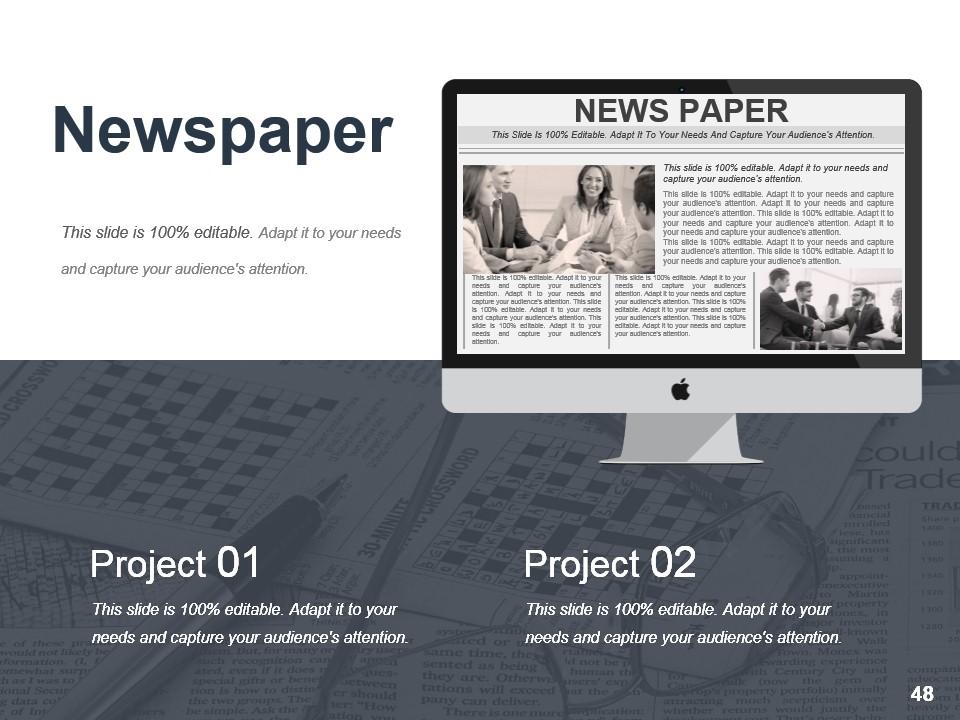
Slide 48: This is a Newspaper image slide. Show events, important piece of information, events etc. here.
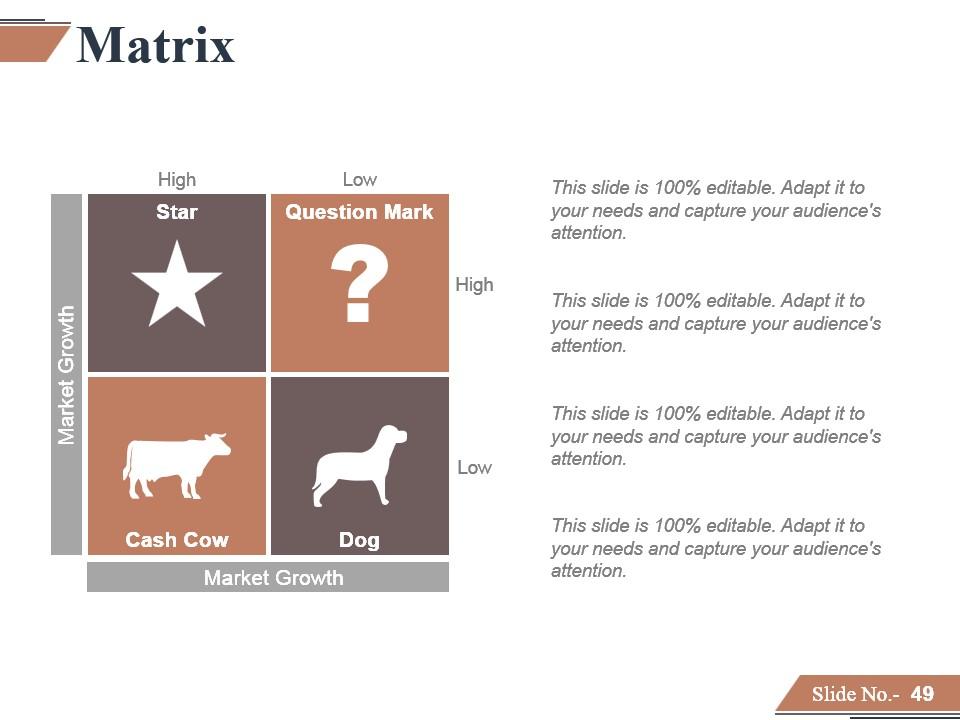
Slide 49: This slide shows a Matrix in terms of High and Low.
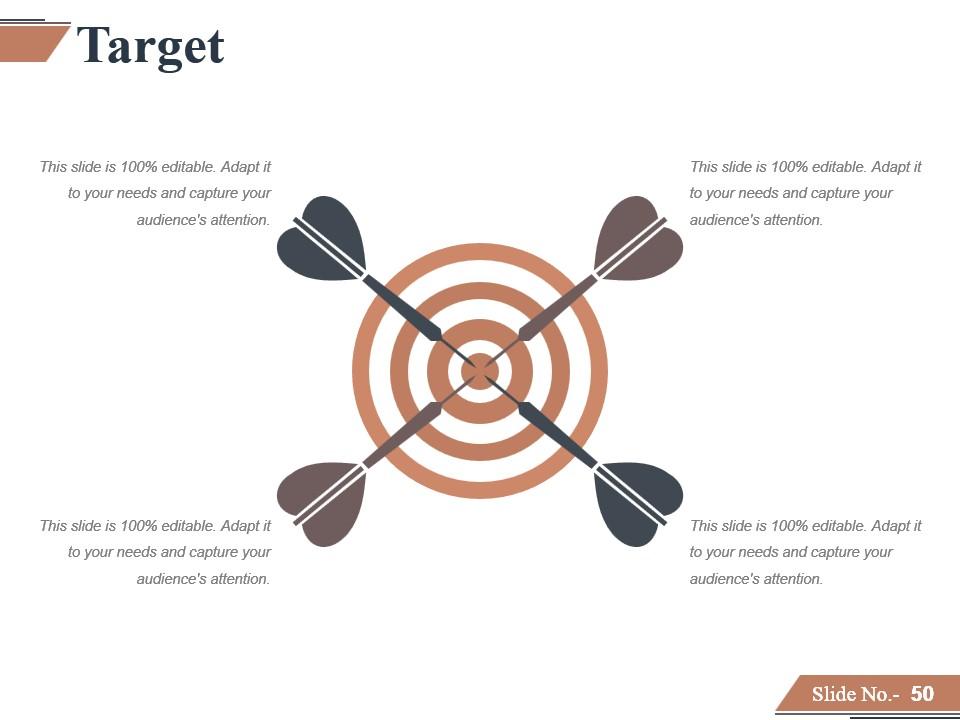
Slide 50: This is a Target slide. State your targets here.
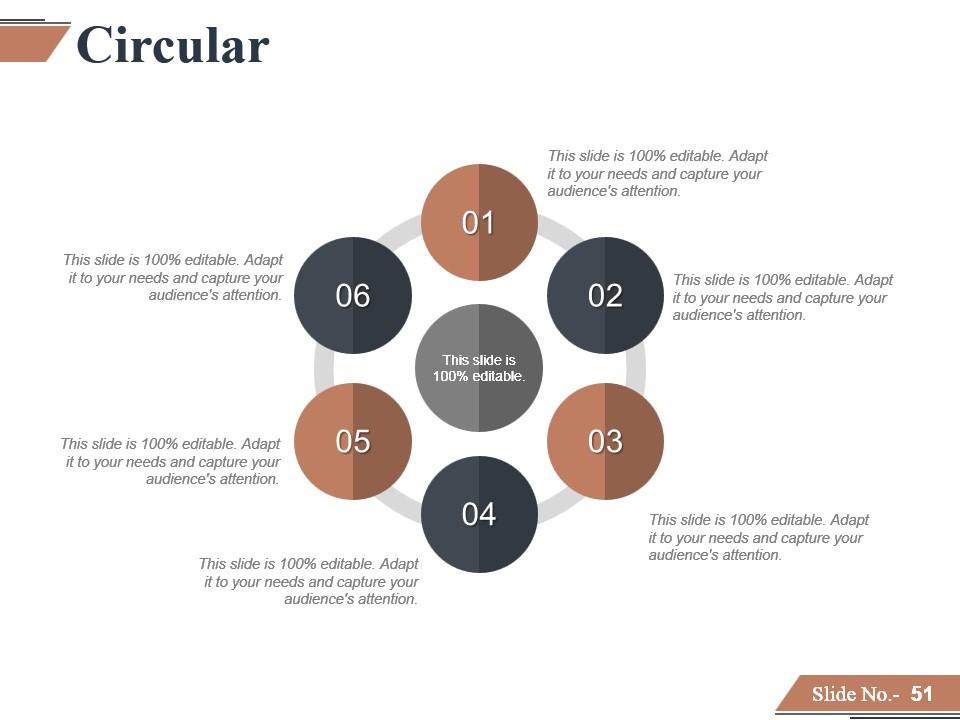
Slide 51: This is a Circular slide to show information, specification etc.
Slide 52: This is an Innovation & Creativity slide with creative bulb imagery to state a new idea or highlight specifications/ information etc.
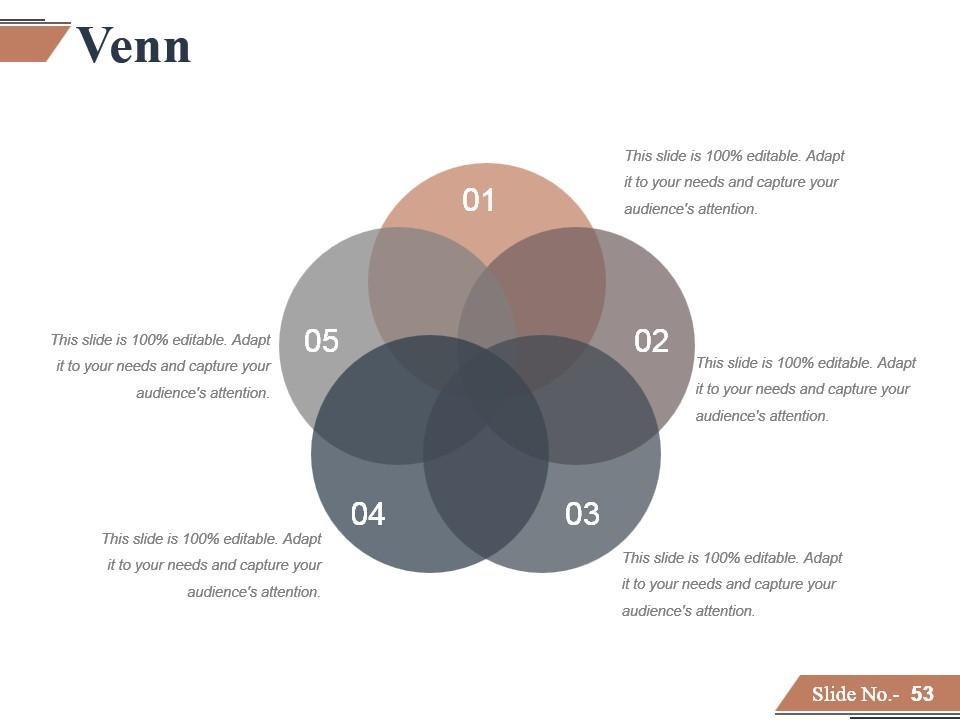
Slide 53: This is a Venn diagram image slide to show information, specifications etc.
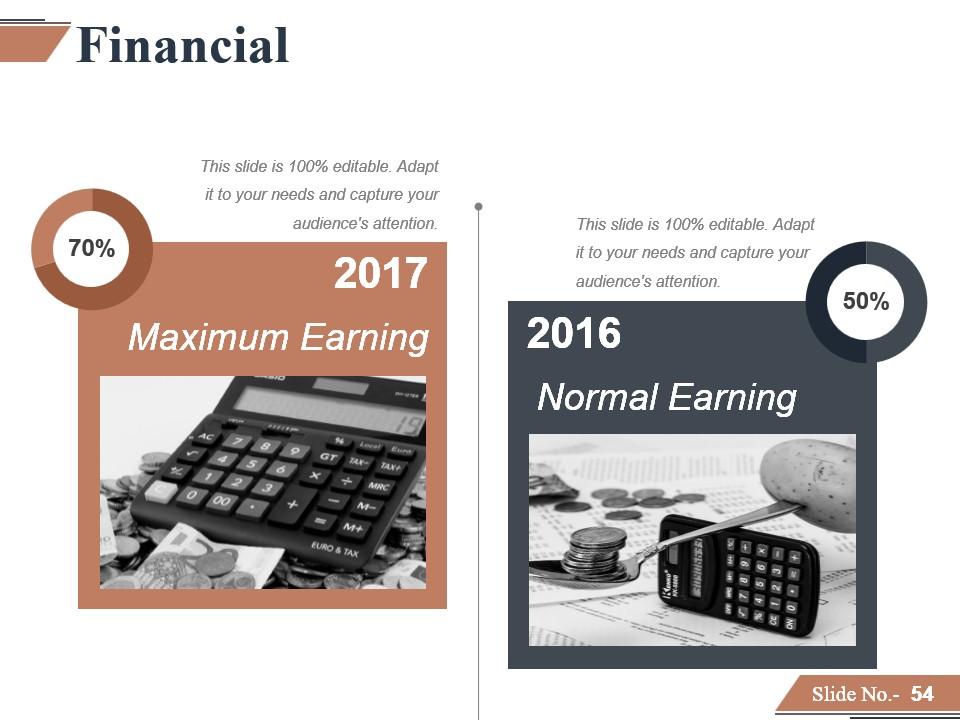
Slide 54: This is a Financial slide showing- Maximum Earning, Normal Earning.
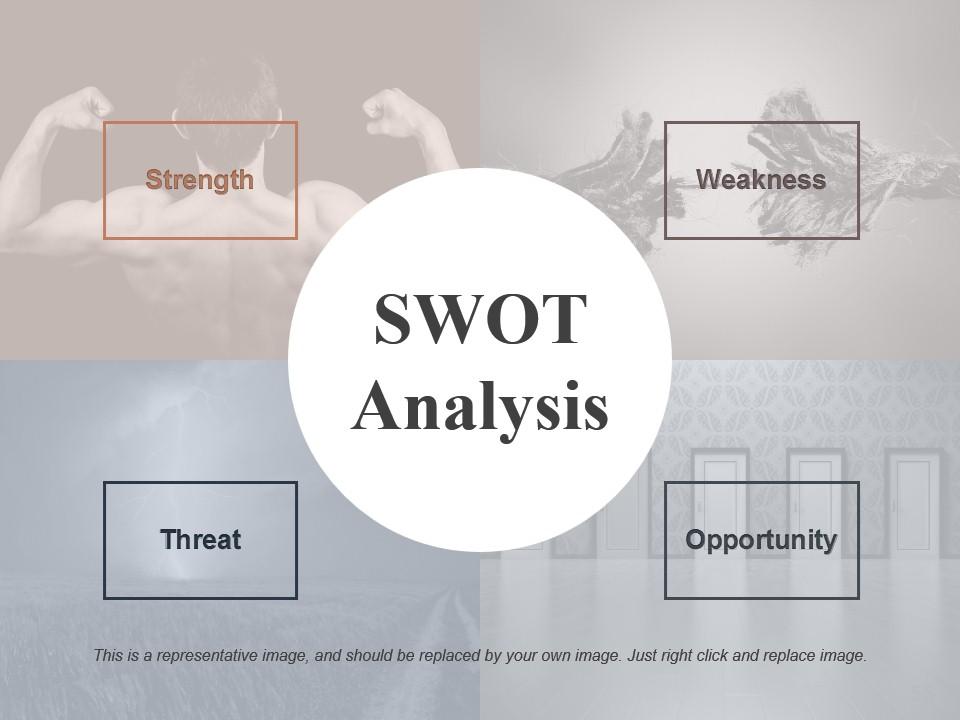
Slide 55: This slide presents SWOT Analysis. State your strengths, weaknesses, threats and oppotunities here.
Slide 56: This is a Lego box image slide to show information, specifications etc.
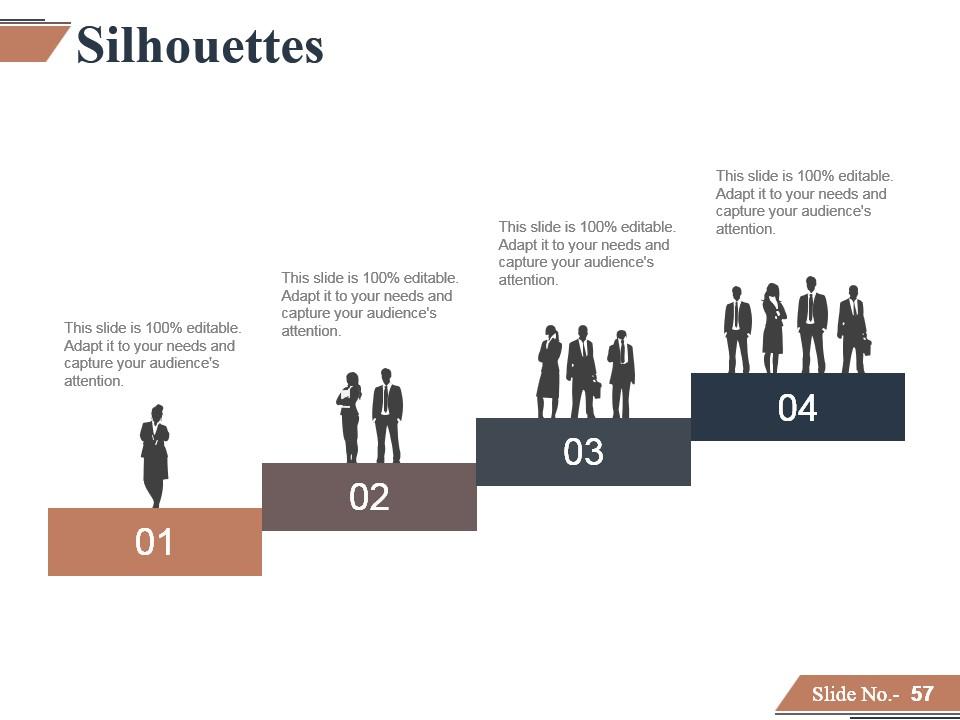
Slide 57: This is a Silhouettes slide to show people related information, specifications etc.
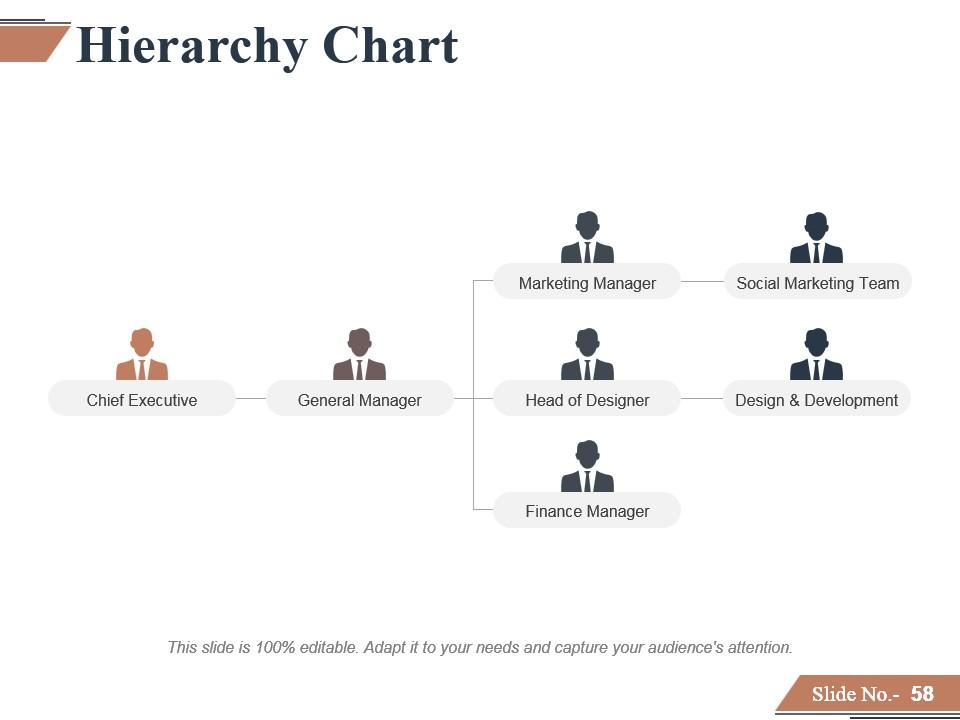
Slide 58: This is a Hierarchy Chart slide to show information, organization structural specifications etc.
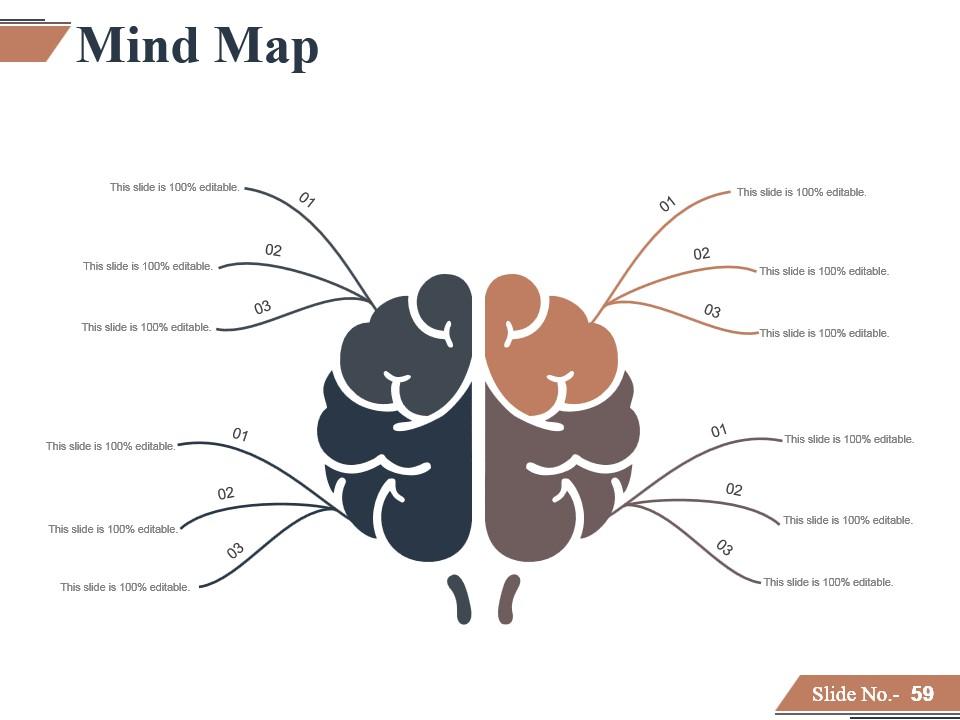
Slide 59: This is a Mind map image slide to show information, specifications etc.
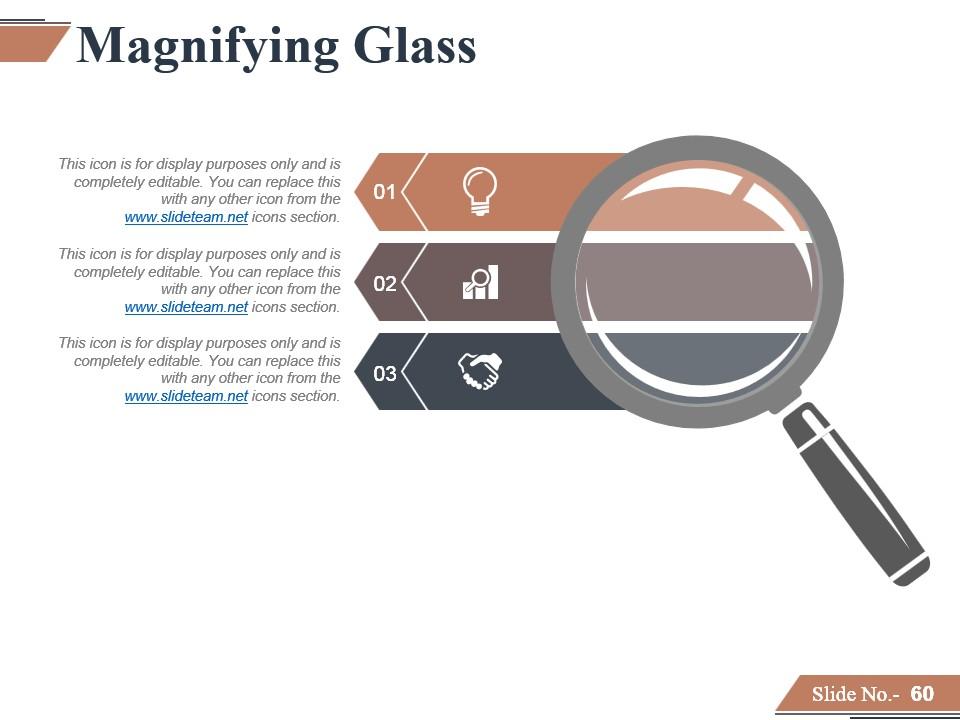
Slide 60: This is a Magnifying glass image slide to show information, specifications etc.
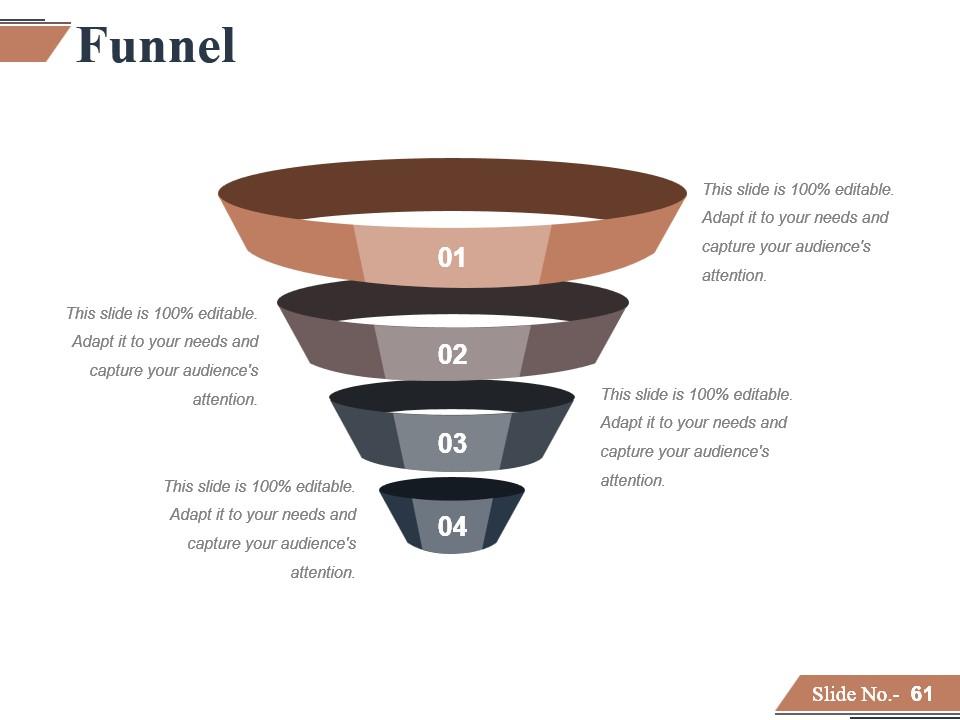
Slide 61: This is a Funnel image slide to show information, specifications etc.
Slide 62: This slide is titled Our Charts & Graphs to move forward. You can change the slide content as per need.
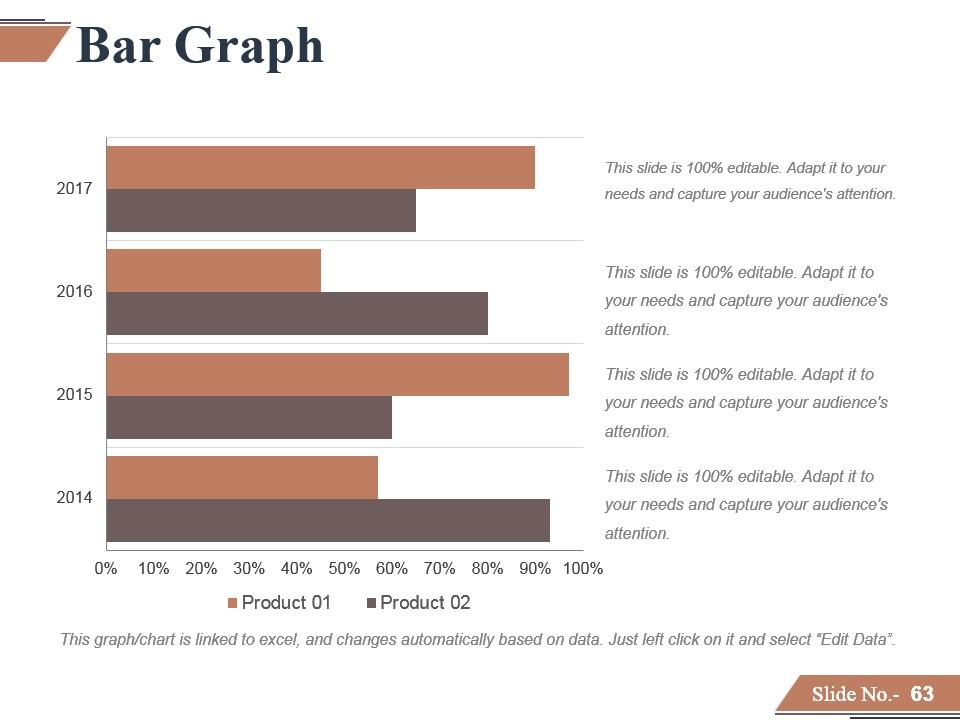
Slide 63: This slide presents a Bar Graph for product growth etc.
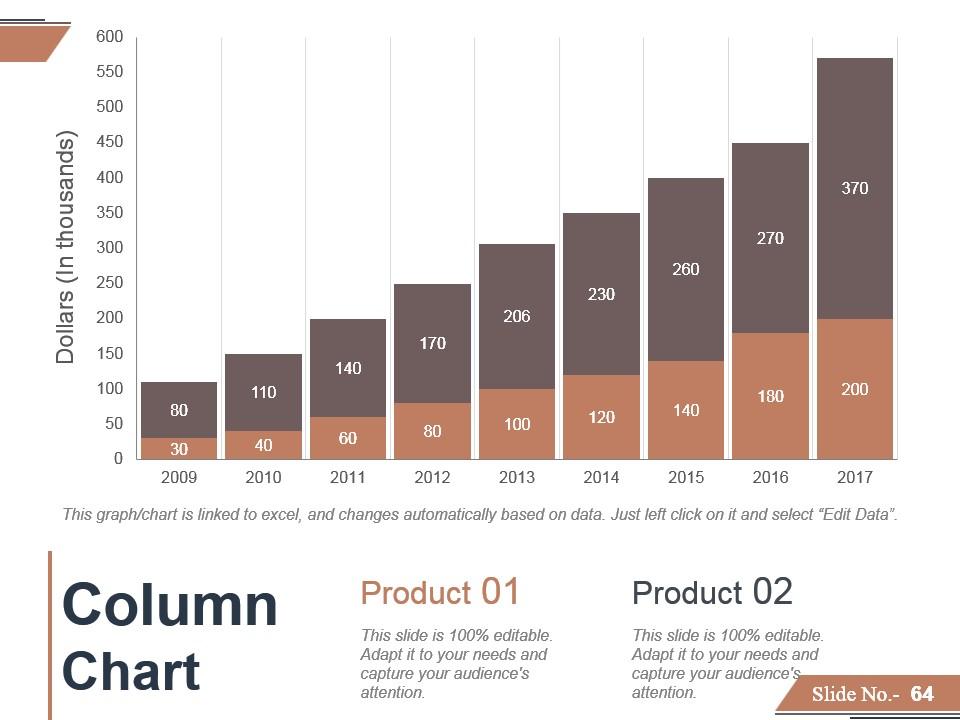
Slide 64: This is a Column Chart for showing product/ entity comparison, information etc.
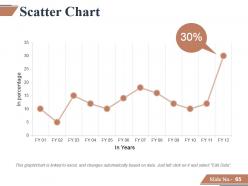
Slide 65: This is a Scatter Chart slide to present product/ entity comparison, specifications etc.
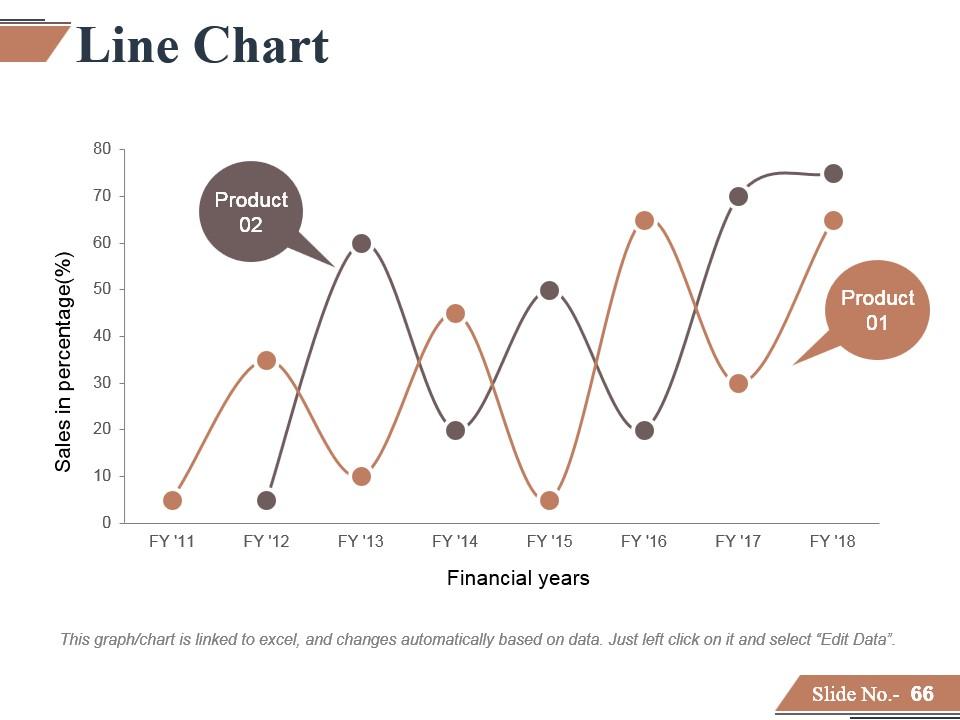
Slide 66: This is a Line Chart to present product/ entity comparison, specifications etc.
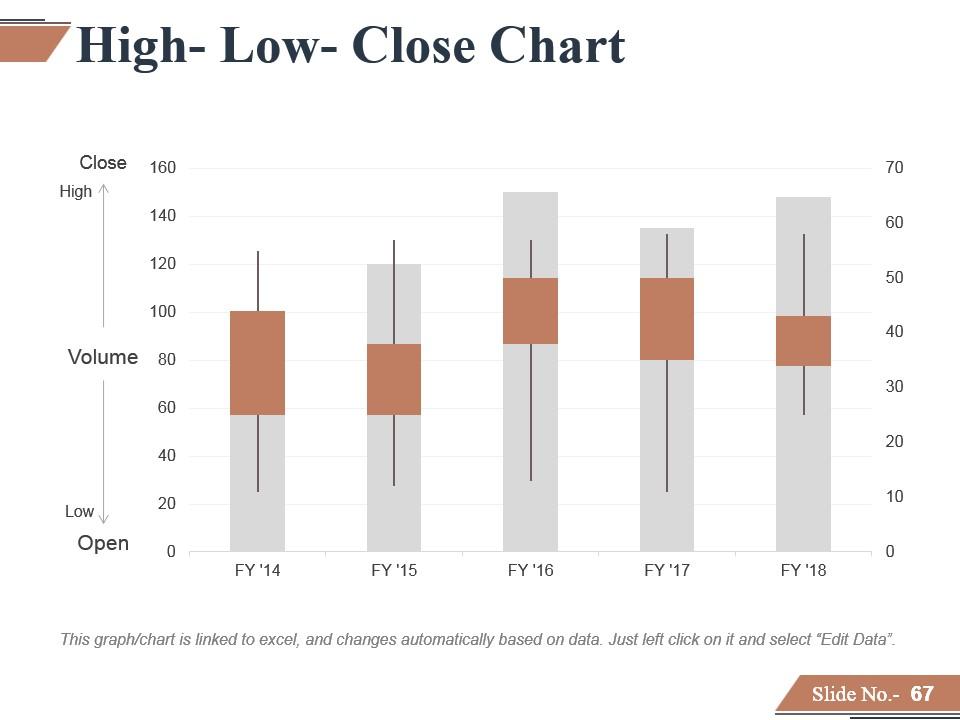
Slide 67: This slide shows High- Low- Close Chart to present product/ entity comparison, specifications etc.
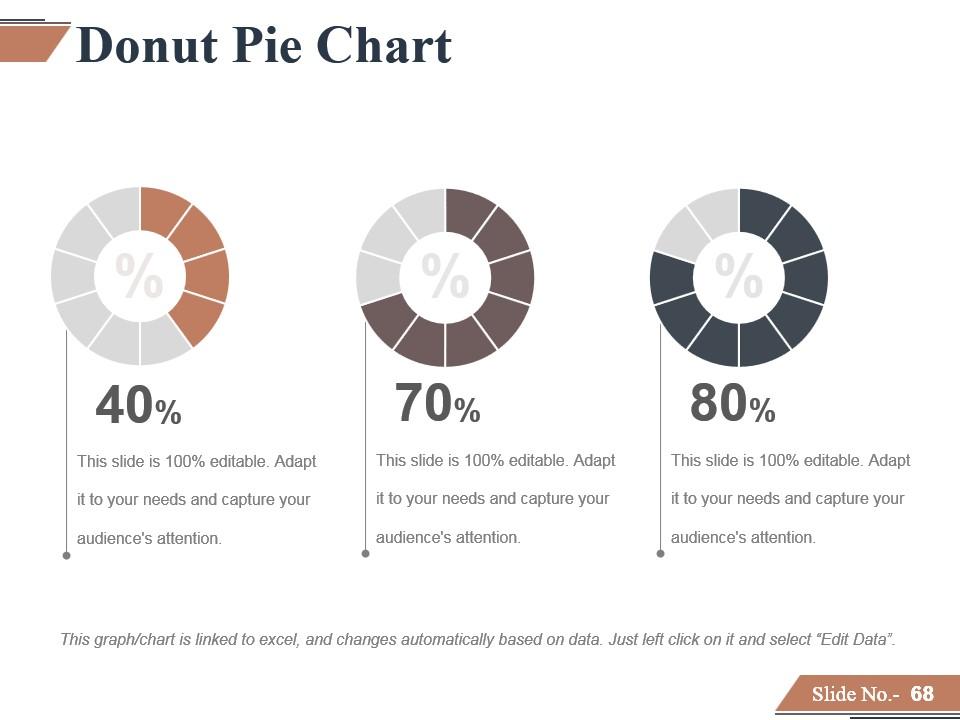
Slide 68: This slide presents a Donut Pie Chart. Add text as per need.
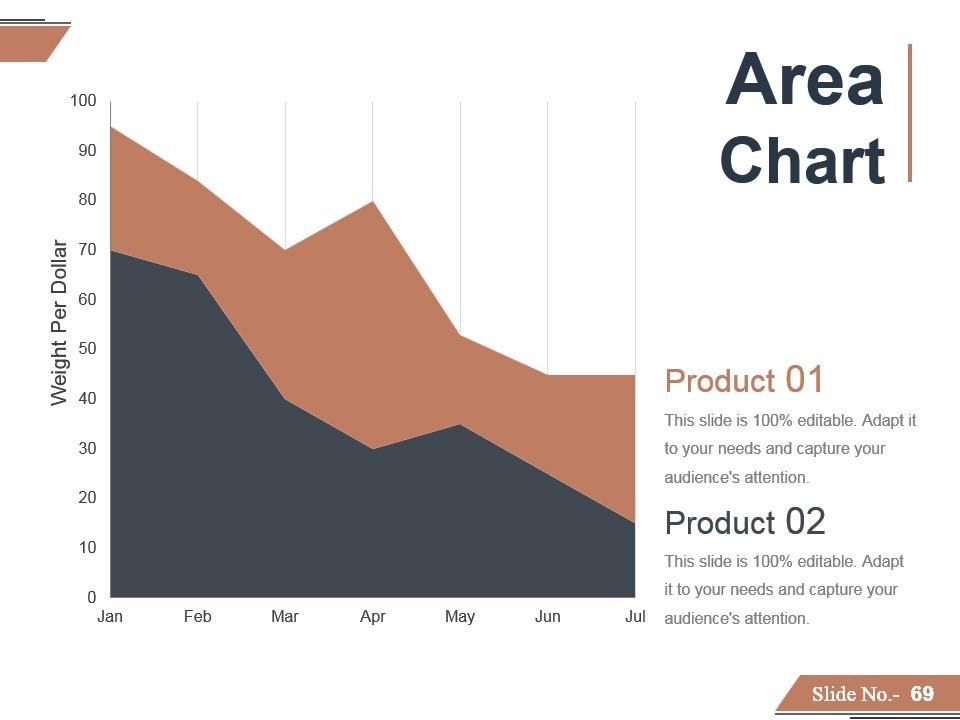
Slide 69: This is an Area Chart slide to present product/ entity comparison, information etc.
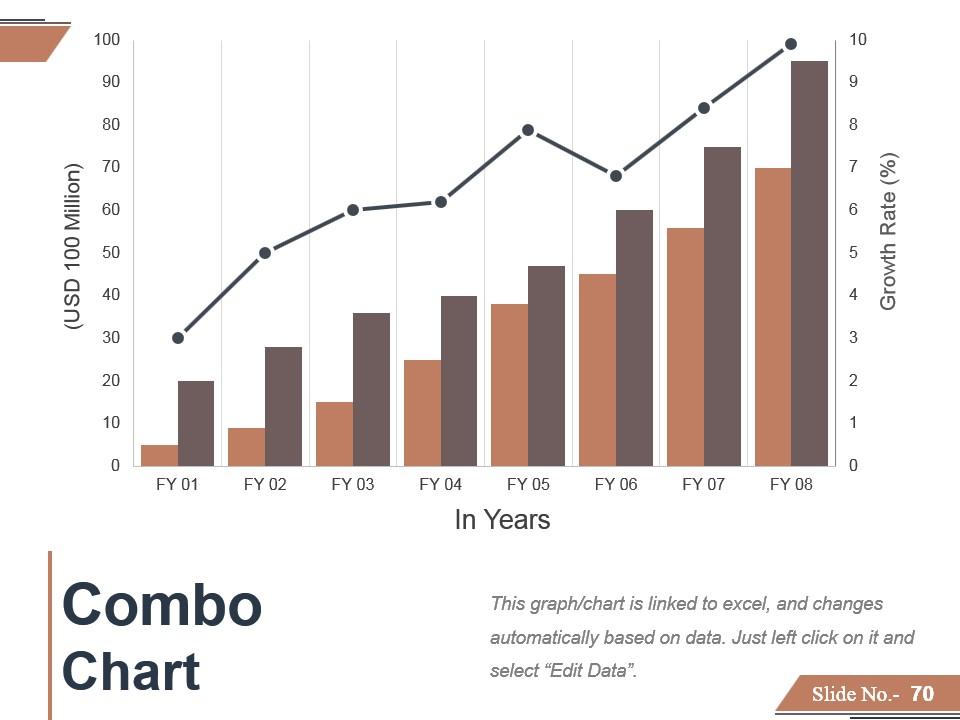
Slide 70: This slide presents Combo Chart to show product/ entity growth, comparison etc.
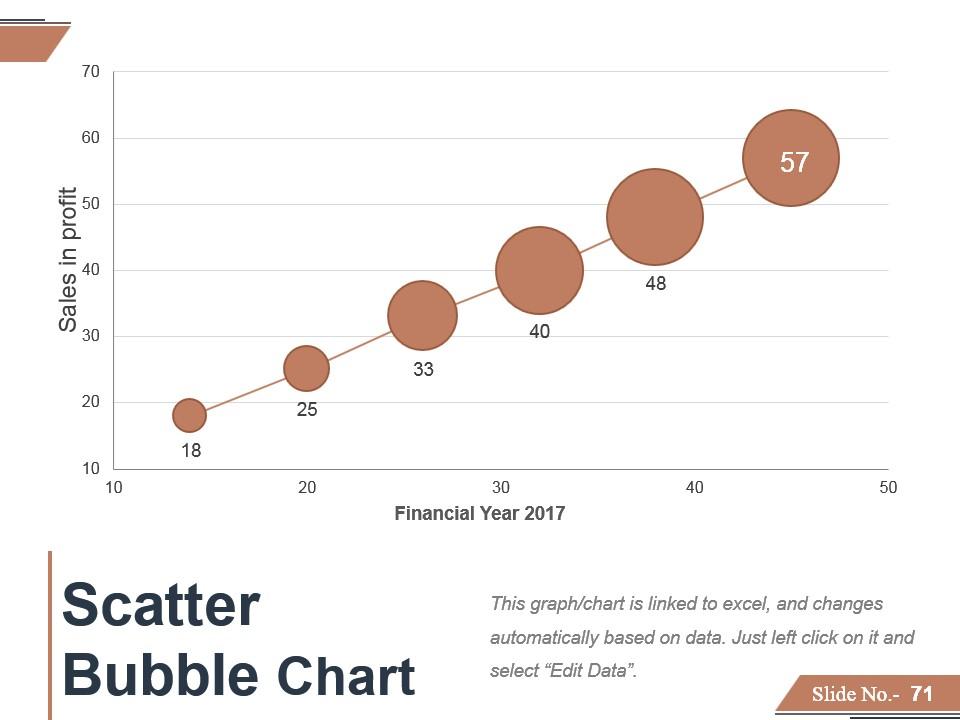
Slide 71: This slide showcases Scatter Bubble Chart. You can analyze and compare products using this chart.
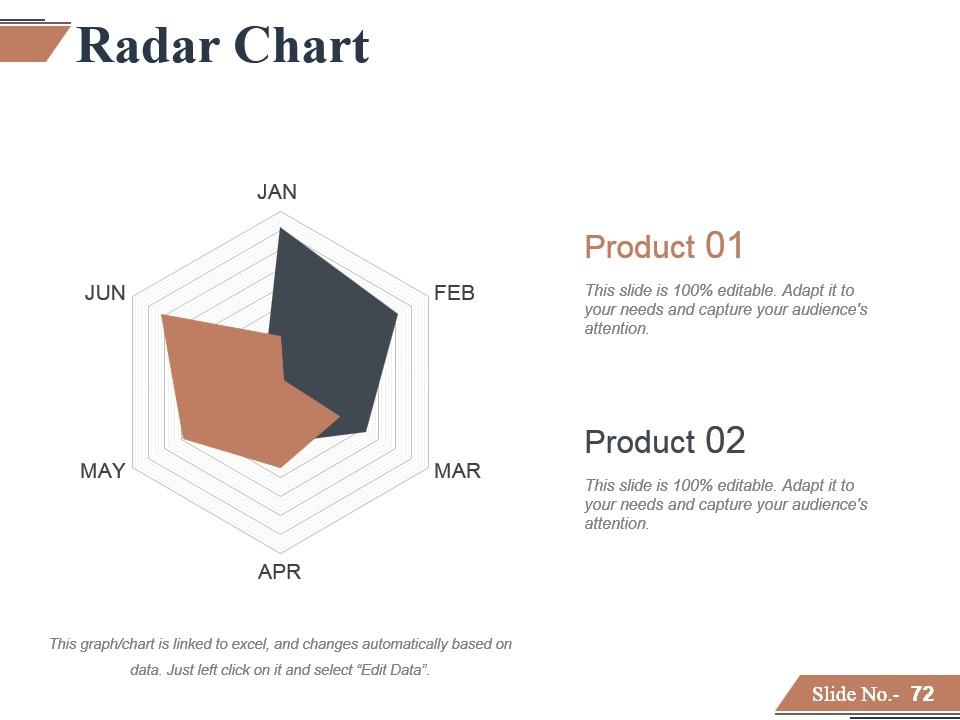
Slide 72: This slide presents a Radar Chart. Compare Product 01, Product 02 and use as per required.
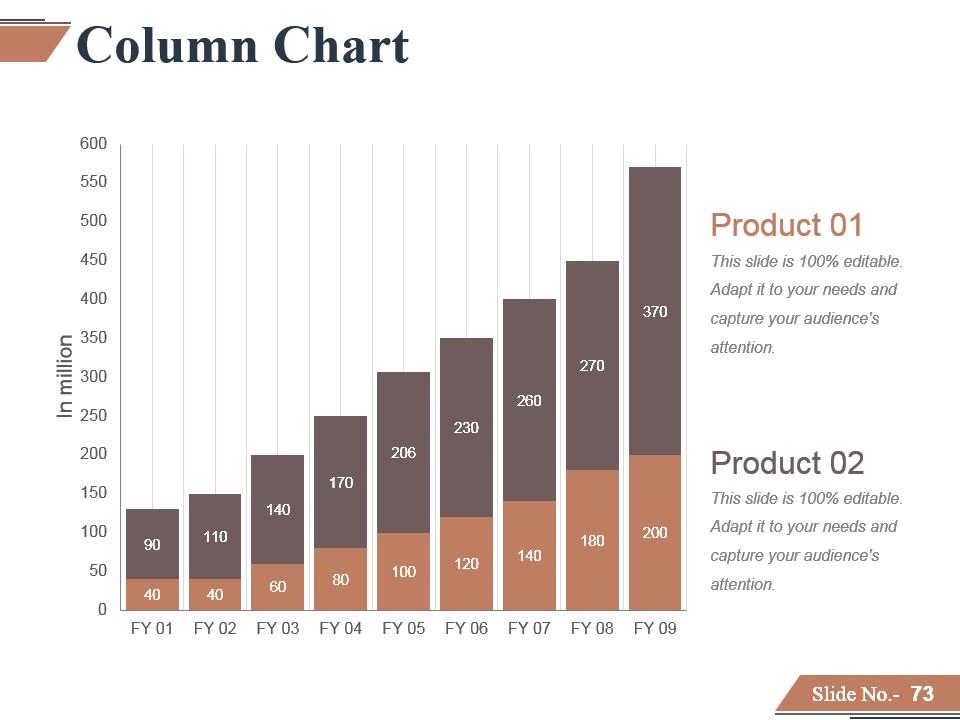
Slide 73: This slide presents a Column Chart for showcasing product/ company growth, comparison etc.
Slide 74: This is a Thank You image slide with Address, Email and Contact number.
Financing Forecasting Process And Methods Powerpoint Presentation Slides with all 74 slides:
Everyone in the hall will feel excited. Our Financing Forecasting Process And Methods Powerpoint Presentation Slides will generate a buzz.
-
Unique research projects to present in meeting.
-
Awesomely designed templates, Easy to understand.


