Human Resources Management Process Powerpoint Presentation Slides
In order to give new definition to your business, it’s important to have the right planning and information recorded in human resources management process PowerPoint slides. It’s not only the people but the department associated, whose information, objective and achievements are to be recorded in human resource PPT presentation. Every single step designed and implemented to maximize the human resource potential can be recorded in this very handy and easy to use presentation layout. Recruitment, interview and hiring process becomes very easy and manageable when you have all the stats right in front of you in PPT design. The human resources managers can coordinate well with the administrative staff by directing, coordinating and planning well with the help of pre designed PowerPoint visual. Management becomes much of an easy task when information can be added in human resource PowerPoint presentation as and when required. The images create a 3D illusion, thus making your work on presentation speak for itself without you having to invest a lot of time. Express affection with our Human Resources Management Process Powerpoint Presentation Slides. They help display your emotions.
- Google Slides is a new FREE Presentation software from Google.
- All our content is 100% compatible with Google Slides.
- Just download our designs, and upload them to Google Slides and they will work automatically.
- Amaze your audience with SlideTeam and Google Slides.
-
Want Changes to This PPT Slide? Check out our Presentation Design Services
- WideScreen Aspect ratio is becoming a very popular format. When you download this product, the downloaded ZIP will contain this product in both standard and widescreen format.
-

- Some older products that we have may only be in standard format, but they can easily be converted to widescreen.
- To do this, please open the SlideTeam product in Powerpoint, and go to
- Design ( On the top bar) -> Page Setup -> and select "On-screen Show (16:9)” in the drop down for "Slides Sized for".
- The slide or theme will change to widescreen, and all graphics will adjust automatically. You can similarly convert our content to any other desired screen aspect ratio.
Compatible With Google Slides

Get This In WideScreen
You must be logged in to download this presentation.
PowerPoint presentation slides
Every graphic can be customized in the presentation design as per need. Supportive images can be used to compliment message. Functions well in Windows 7, 8, 10, XP, and Vista. Editing and correction in presentation slide show can be done from anywhere with the use of any device. Human resource team, businessmen or industrial managers can put to function the PPT layout. Can be customized and has an extra advantage of being compatible with Google slides. PPT graphic offers font size which can be read from a distance.
People who downloaded this PowerPoint presentation also viewed the following :
Content of this Powerpoint Presentation
Slide 1: This slide introduces Human Resources Management Process. State company name and begin.
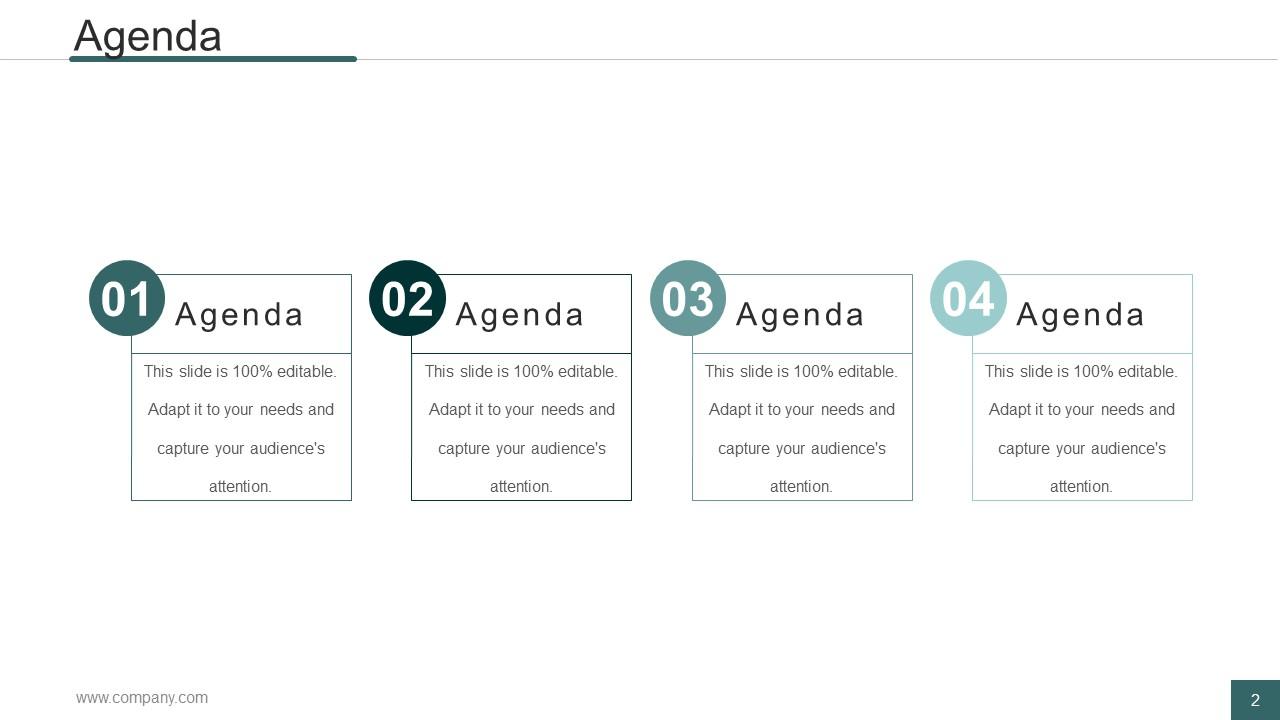
Slide 2: This is an Agenda slide. State your agendas here.
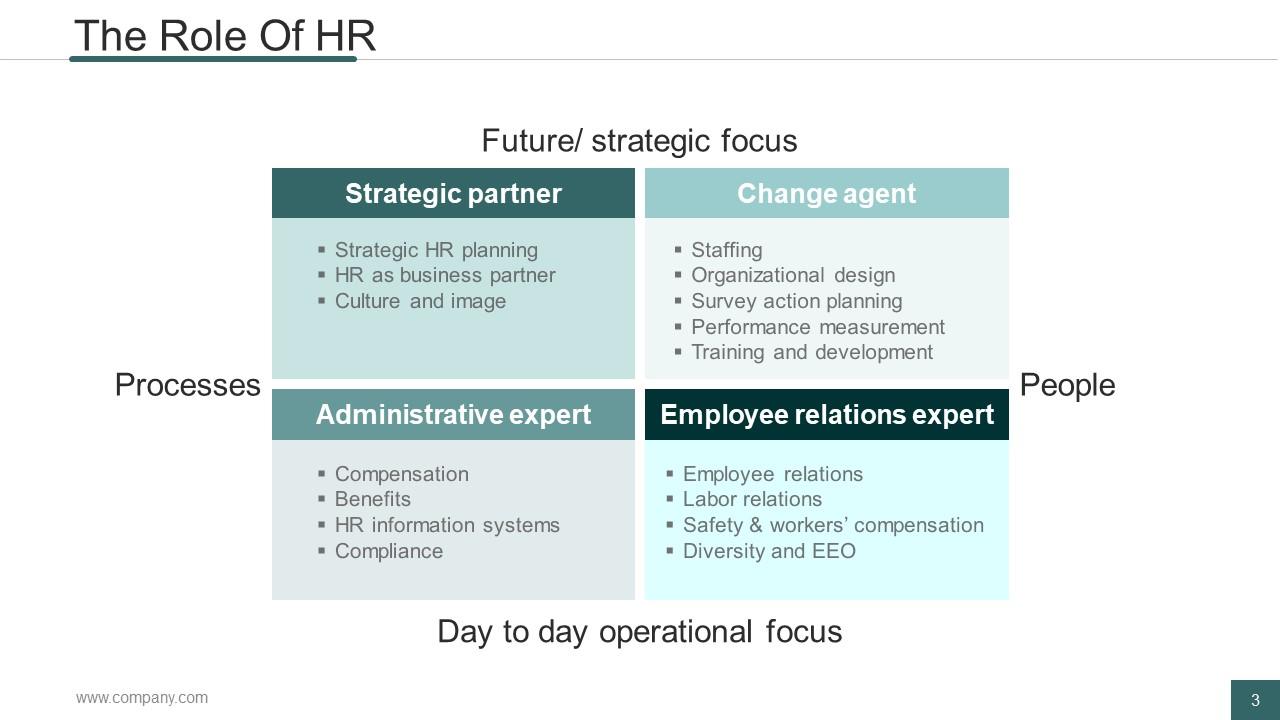
Slide 3: This slide states The Role Of HR with these 4 aspects- Strategic partner, Change agent, Administrative expert, Employee relations expert.
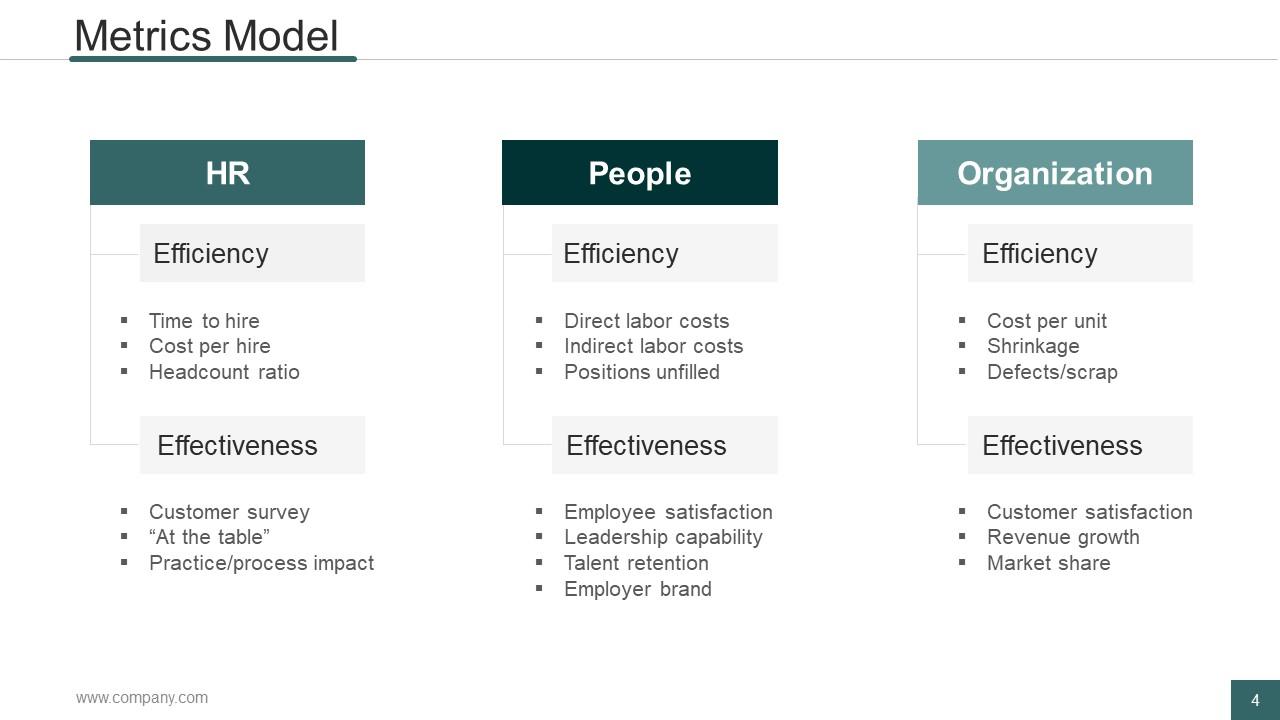
Slide 4: This slide showcases Metrics Model with the following sub headings- HR, People, Organization.
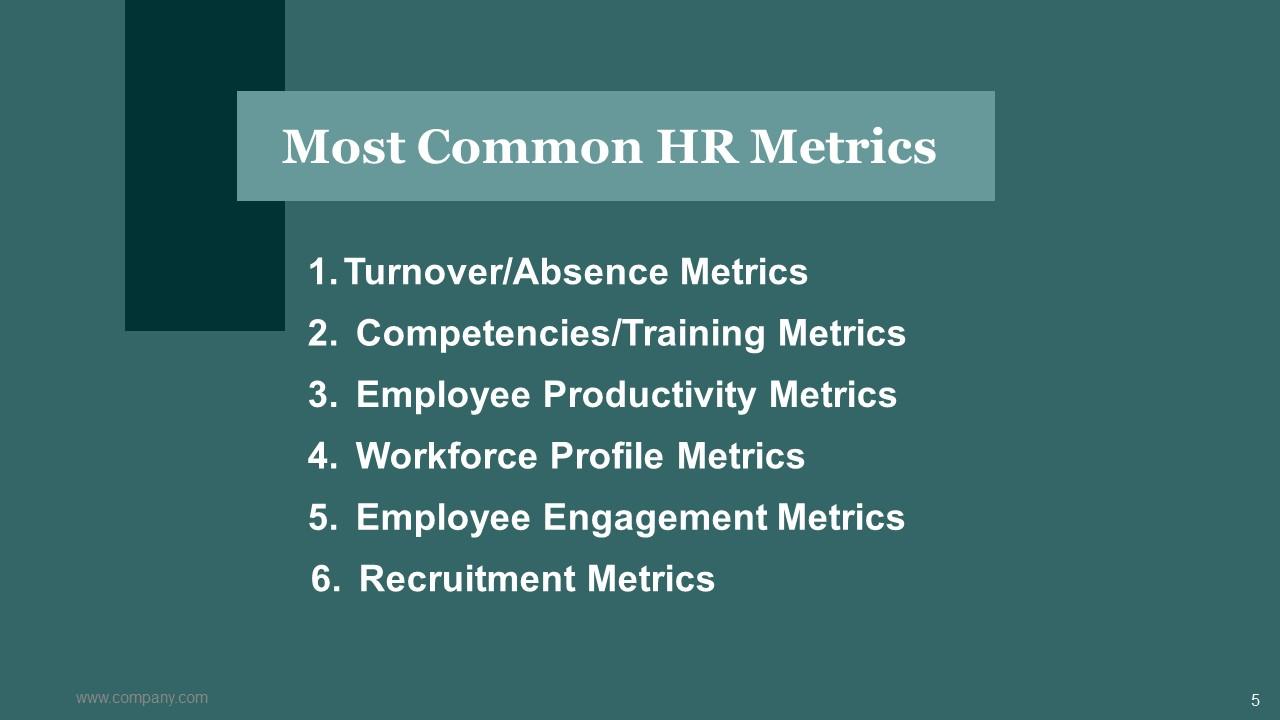
Slide 5: This slide showcases the Most Common HR Metrics. These are- Competencies/Training Metrics, Employee Productivity Metrics, Turnover/Absence Metrics, Recruitment Metrics, Workforce Profile Metrics, Employee Engagement Metrics.
Slide 6: This slide is titled Turnover/Absence Metrics.
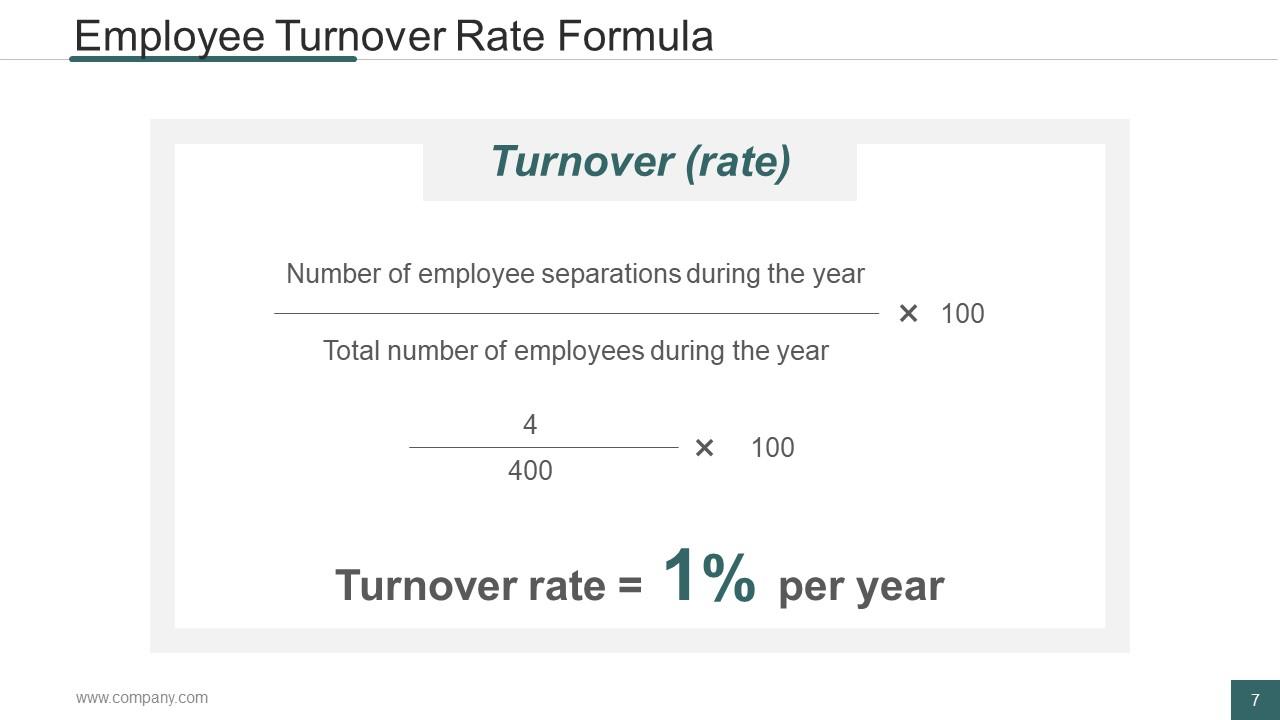
Slide 7: This slide state Employee Turnover Rate Formula. Use it to calculate your Employee Turnover Rate.
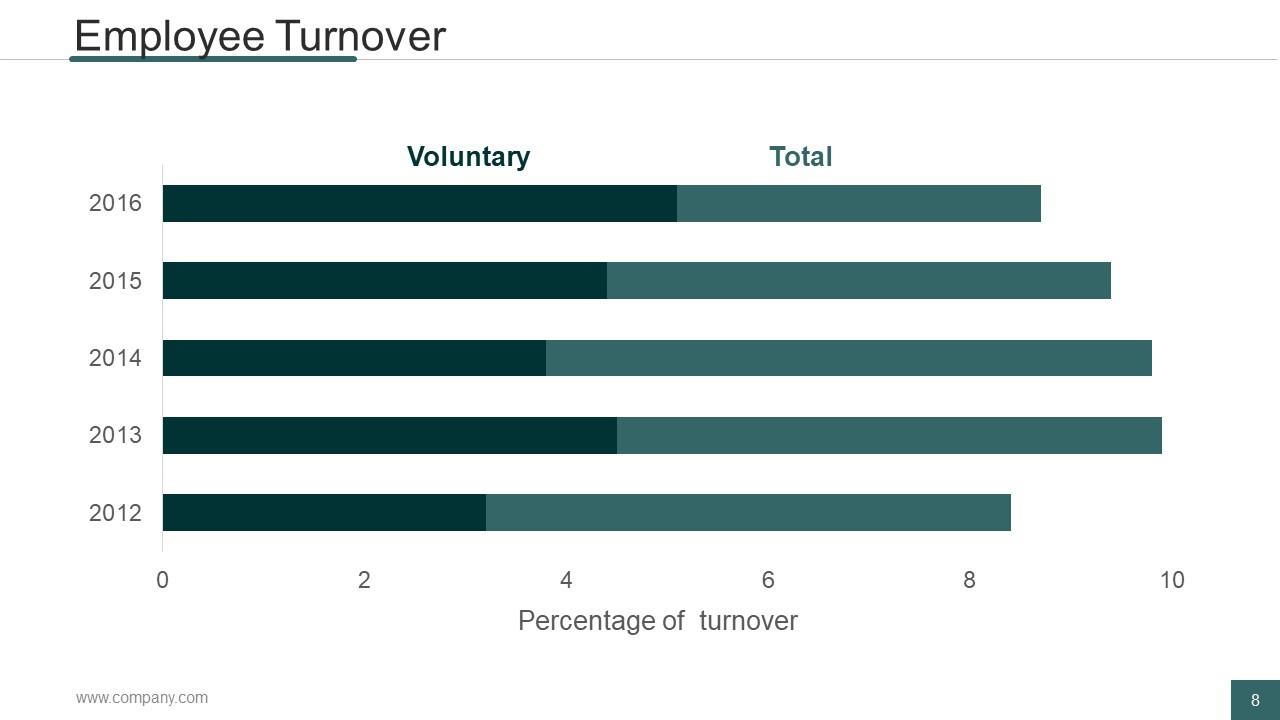
Slide 8: This is Employee Turnover slide in a bar graph/ chart form. Use it to assess the percentage of employee turnover etc.
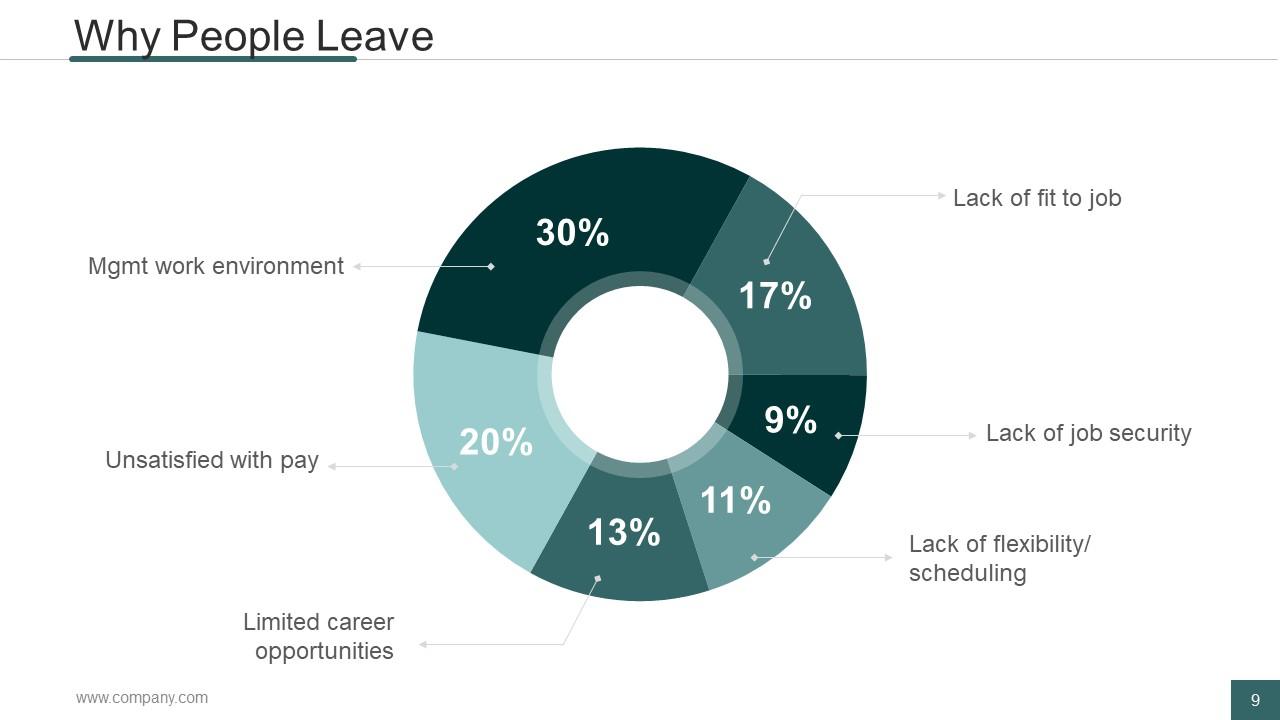
Slide 9: This is Why People Leave slide. State its various reasons in a pie chart form here. Some of the reasons are- Unsatisfied with pay, Lack of job security, Lack of fit to job, Lack of flexibility/ scheduling, Limited career opportunities, Mgmt work environment.
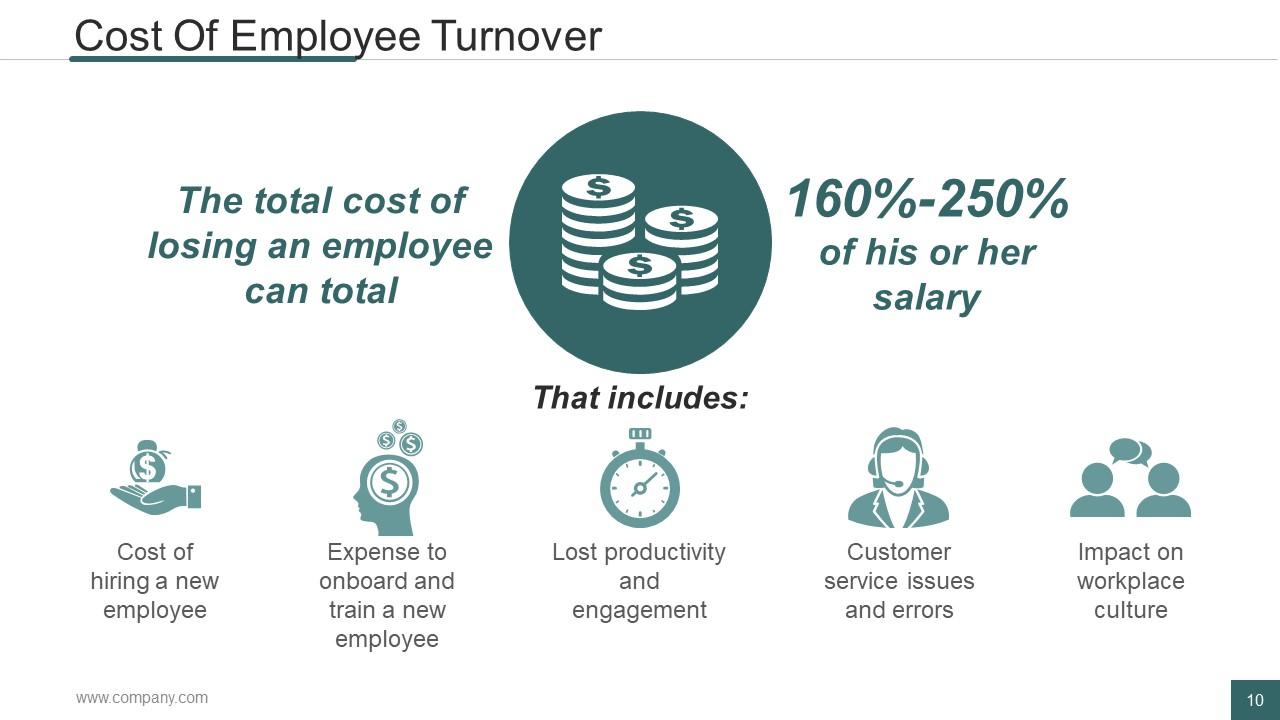
Slide 10: This slide showcases the Cost Of Employee Turnover which includes the following factors- Impact on workplace culture, Customer service issues and errors, Lost productivity and engagement, Expense to onboard and train a new employee, Cost of hiring a new employee.
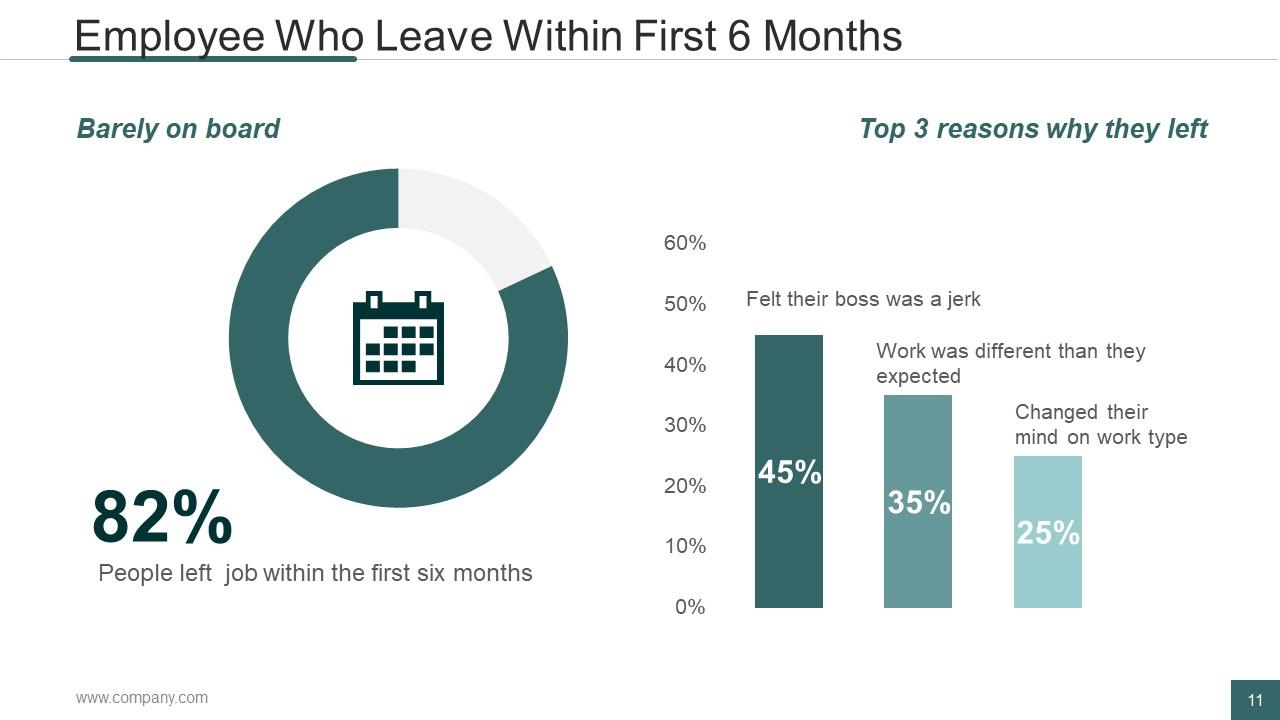
Slide 11: This slide showcases the stats of Employee Who Leave Within First 6 Months in a bar graph/ chart form.
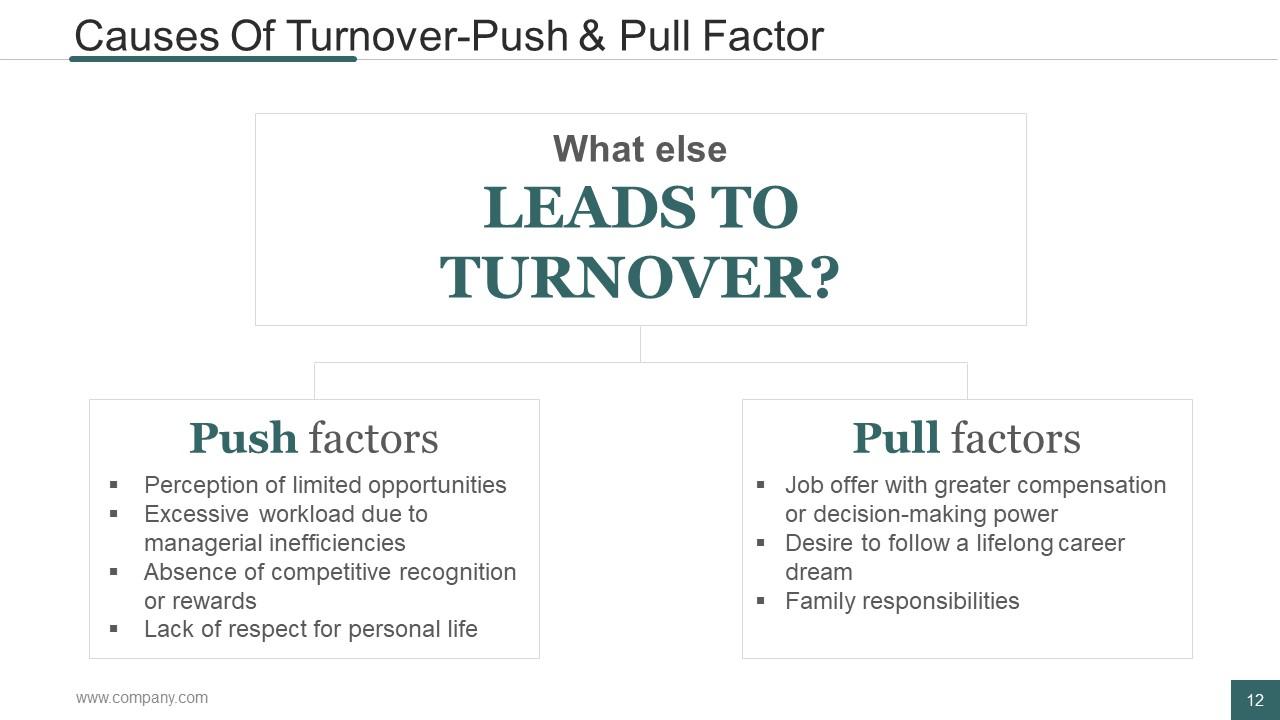
Slide 12: This slide states Causes Of Turnover-Push & Pull Factor. State them here
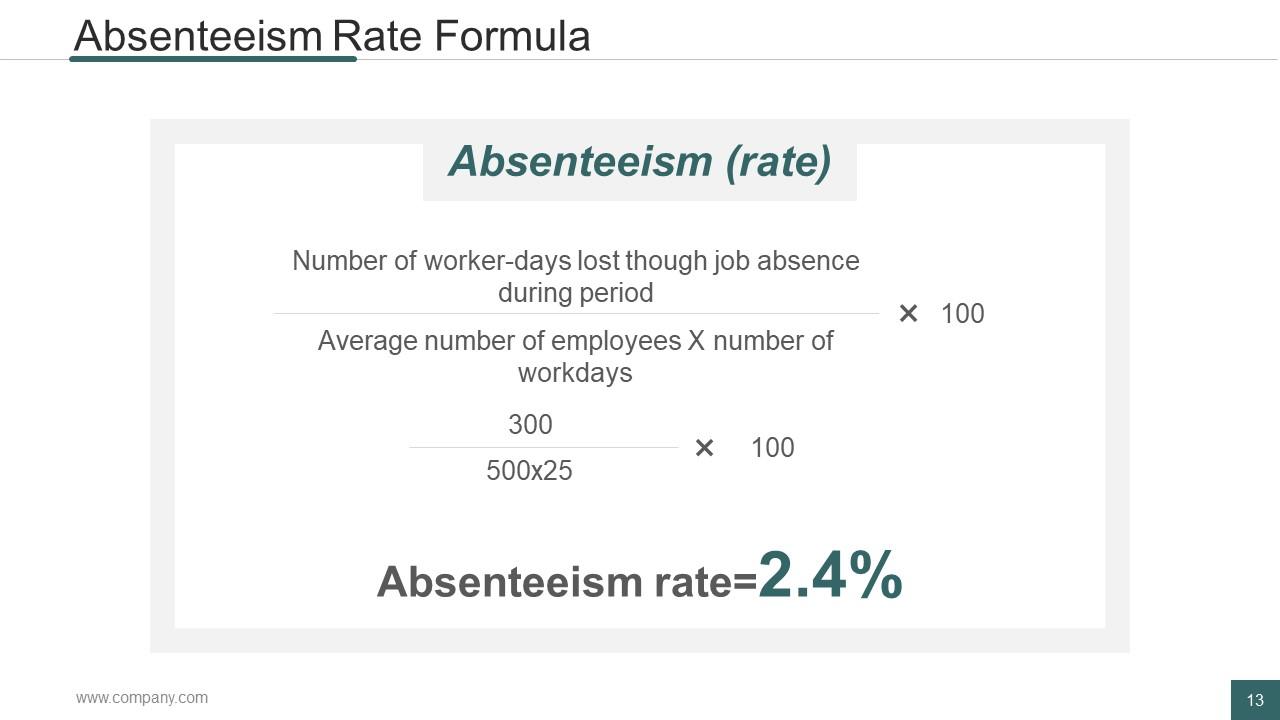
Slide 13: This slide showcases Absenteeism Rate Formula. Use it to calculate your own.
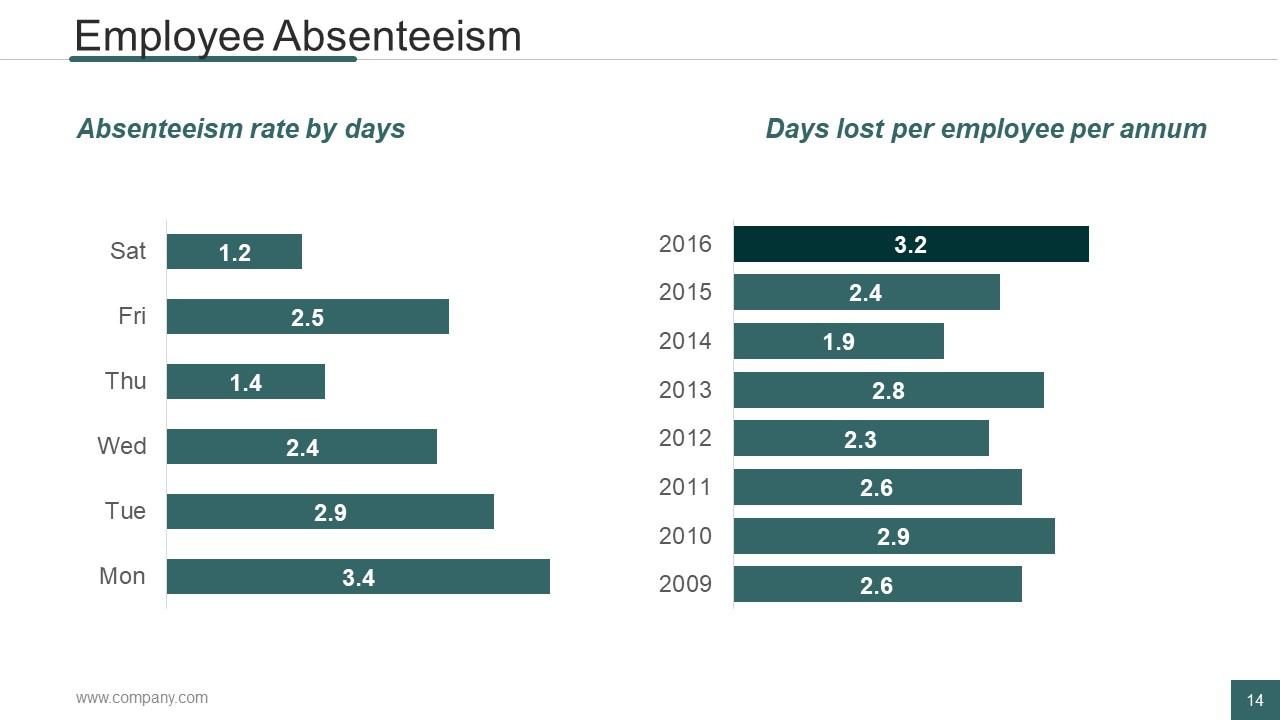
Slide 14: This is Employee Absenteeism rate slide. Use it to calculate your own employee absenteeism rate as per the formula.
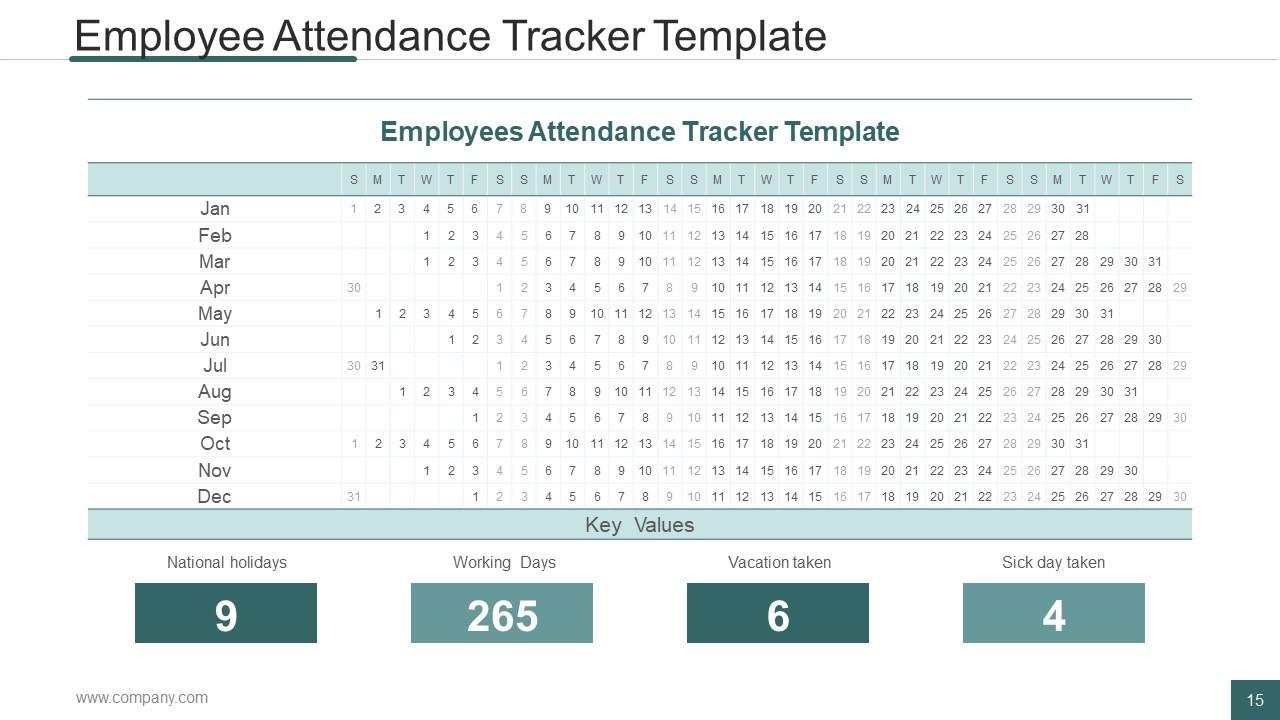
Slide 15: This slide showcases Employee Attendance Tracker Template in a tabular form. Use as per your own need.
Slide 16: This slide states Competencies/Training Metrics.
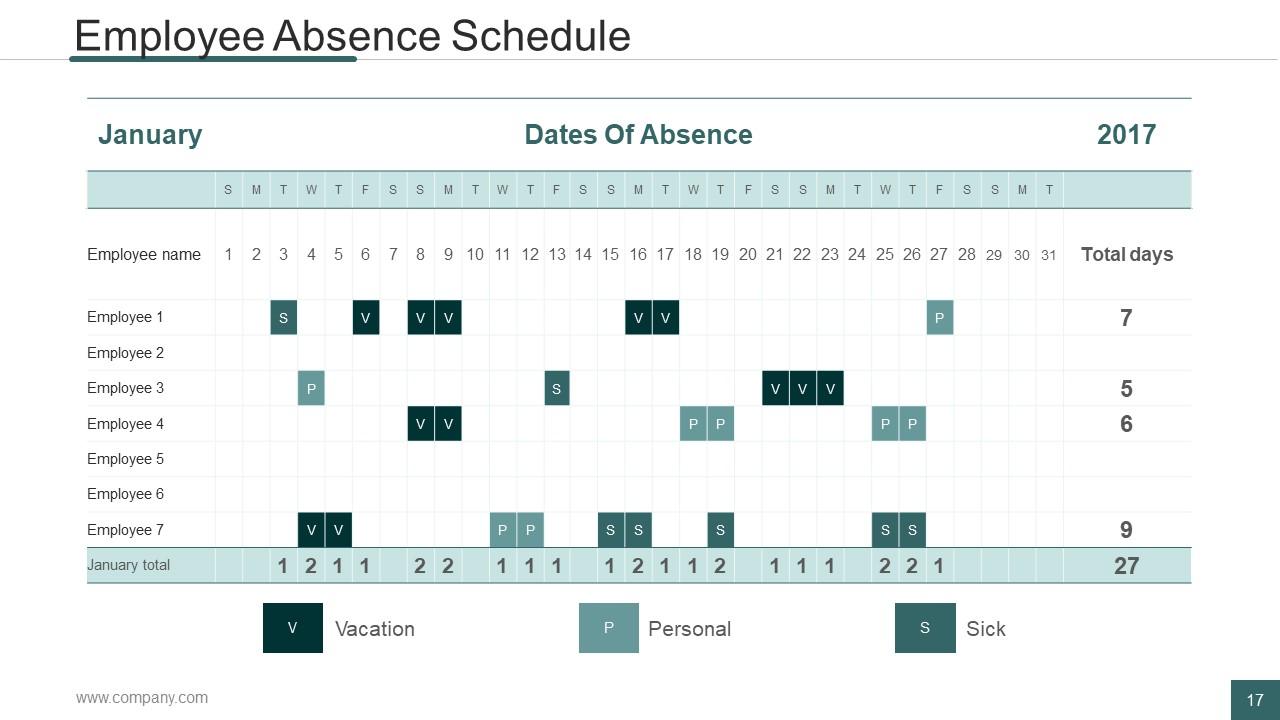
Slide 17: This slide showcases Employee Absence Schedule in a tabular form. Mark vacation, personal and sick aspects in this table here.
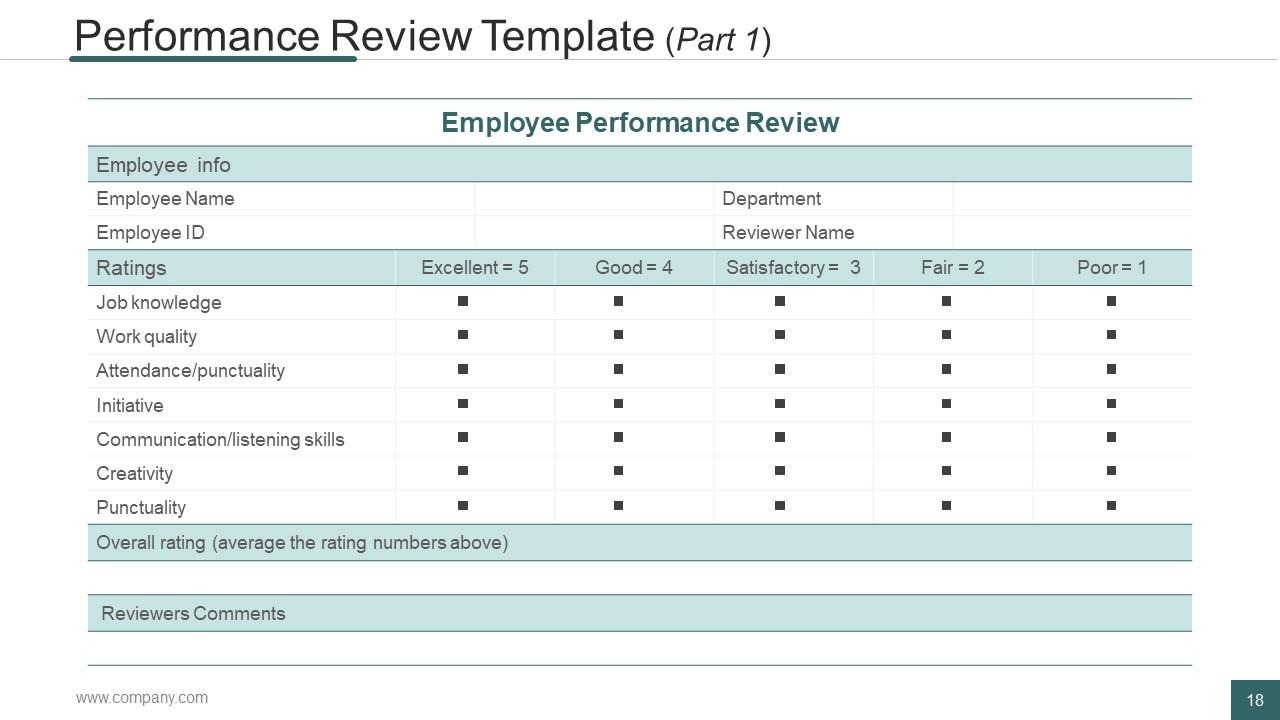
Slide 18: This slide presents Performance Review Template with respect to Employee Performance Review. State relevant information here in a tabular form.
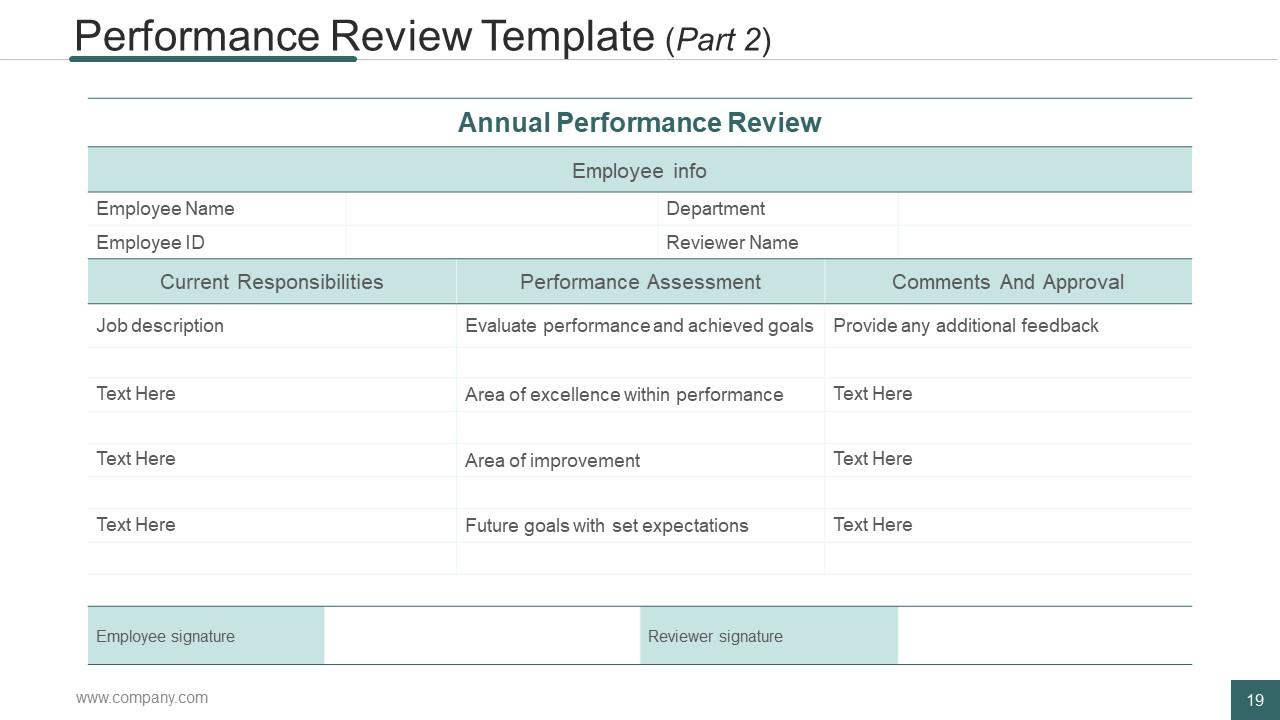
Slide 19: This slide also presents Performance Review Template showing Annual Performance Review in tabular form.
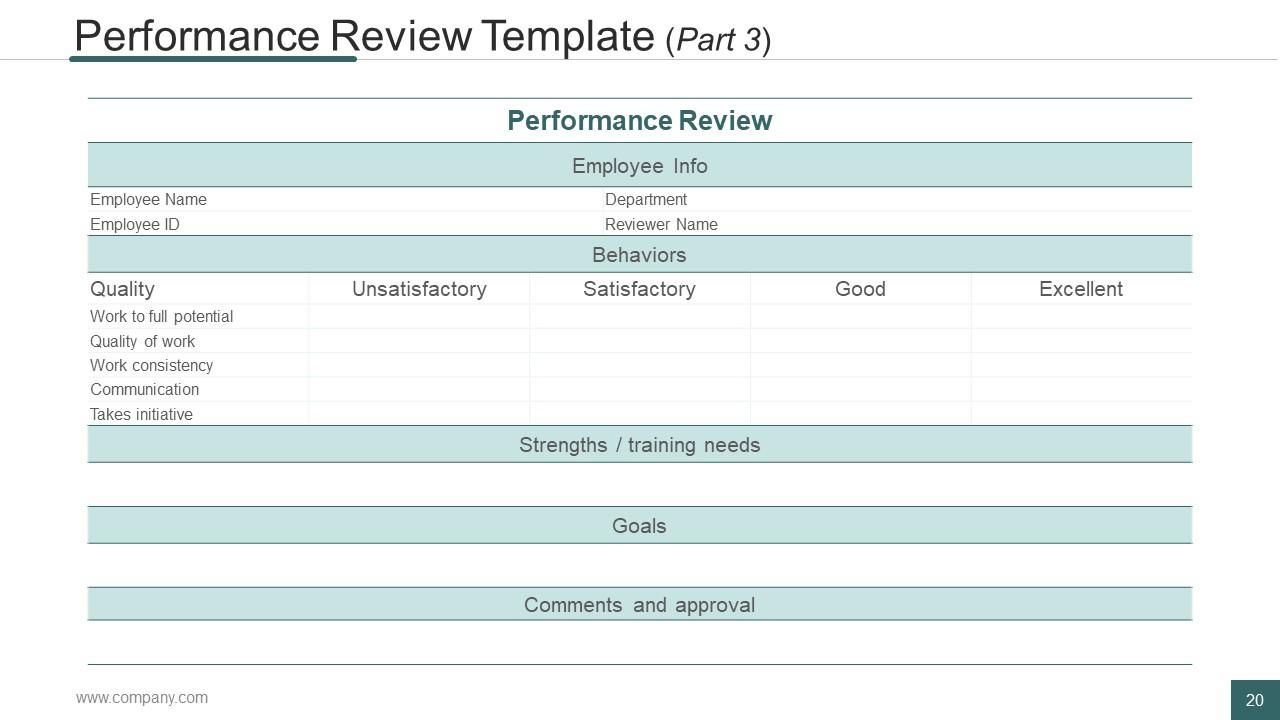
Slide 20: This is another slide showing Performance Review Template in tabular form.
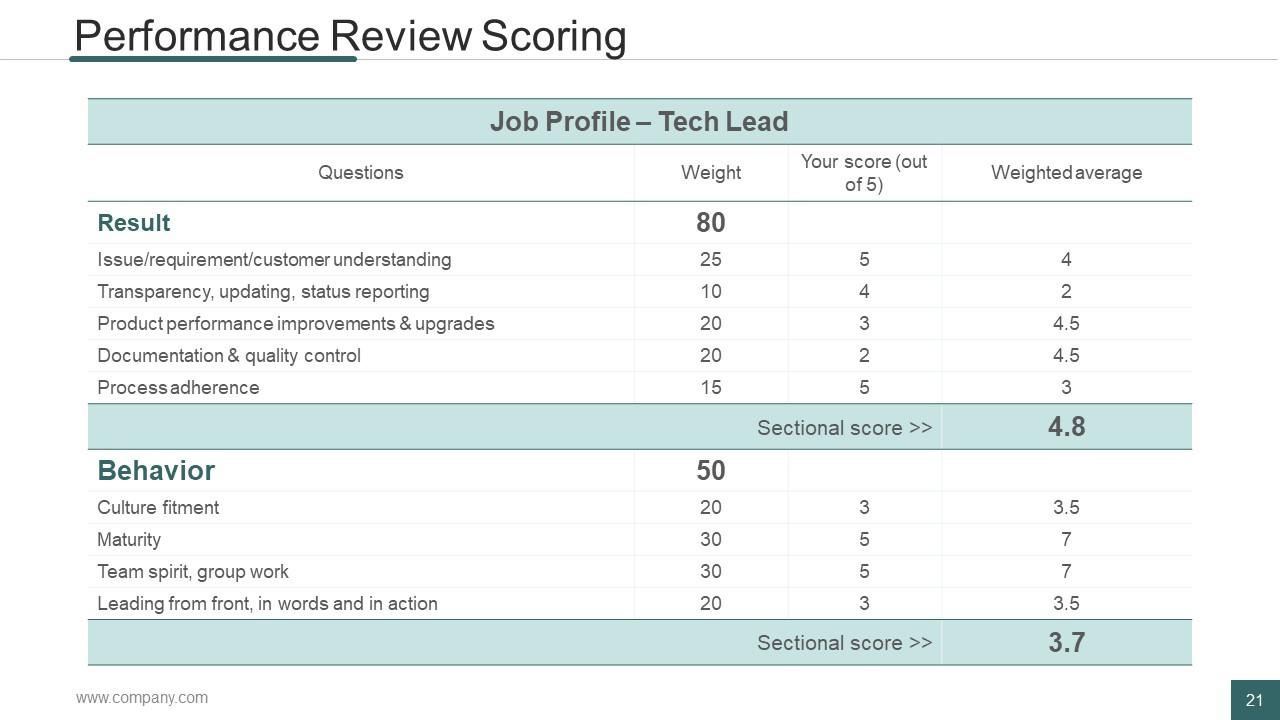
Slide 21: This slide showcases Performance Review Scoring in tabular form.
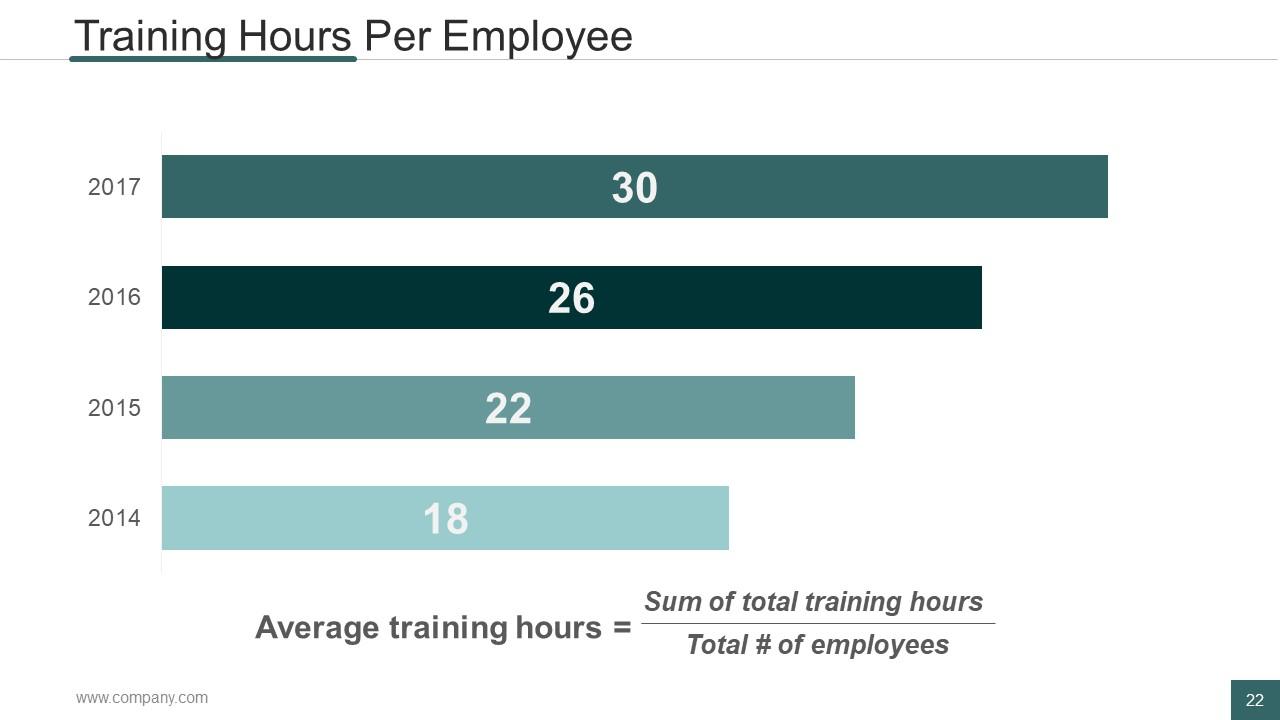
Slide 22: This slide showcases Training Hours Per Employee in a bar graph/ chart image form. State them here.
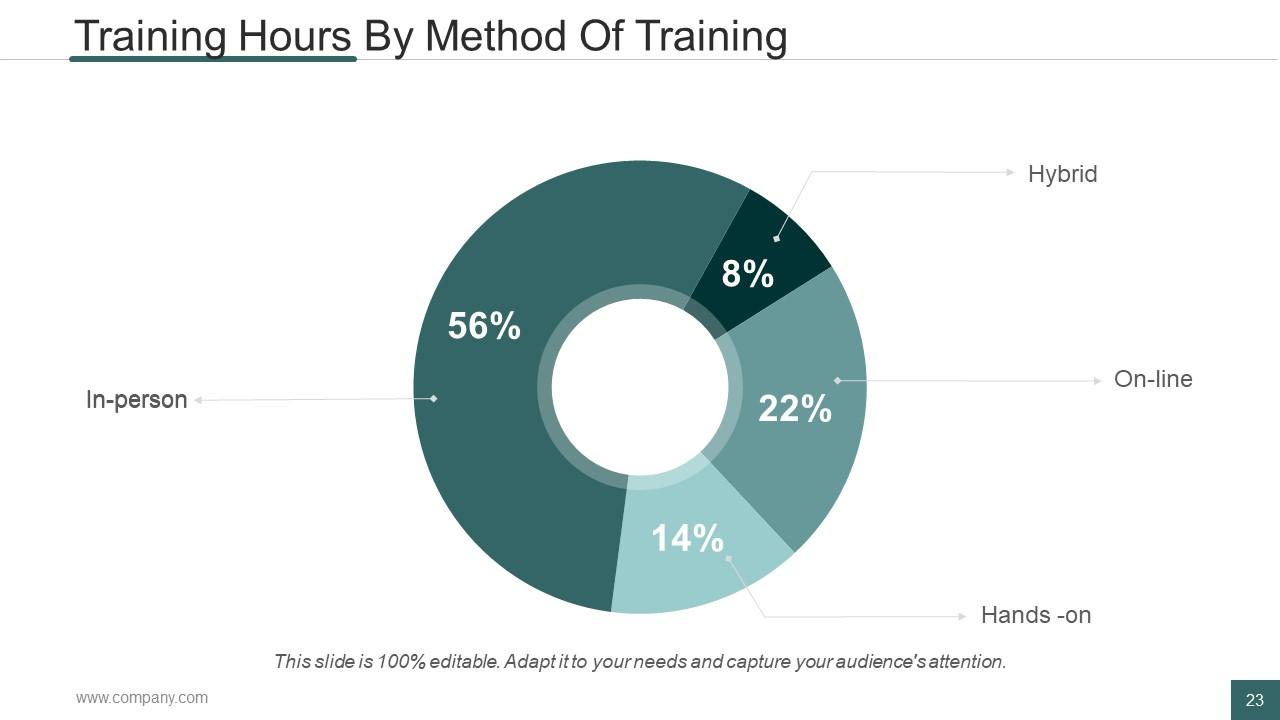
Slide 23: This slide showcases Training Hours By Method Of Training in a pie chart/ graph form. Use it to present the stats of the following- On-line, In-person, Hybrid, Hands -on.
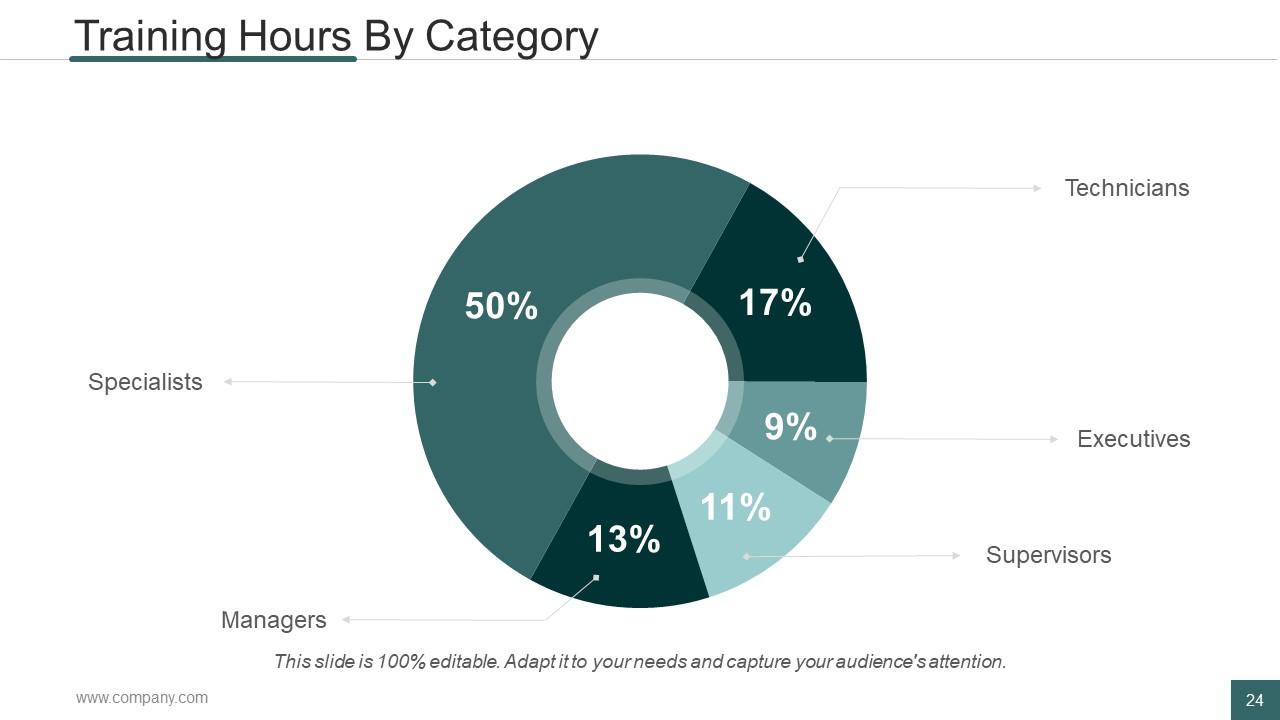
Slide 24: This slide showcases Training Hours By Category in a pie chart form. These categories are- Technicians, Executives, Specialists, Managers, Supervisors.
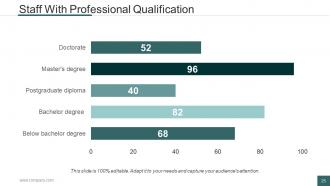
Slide 25: This slide showcases Staff With Professional Qualification in a bar graph/ chart fom. Use it to present your own staff qualifications.
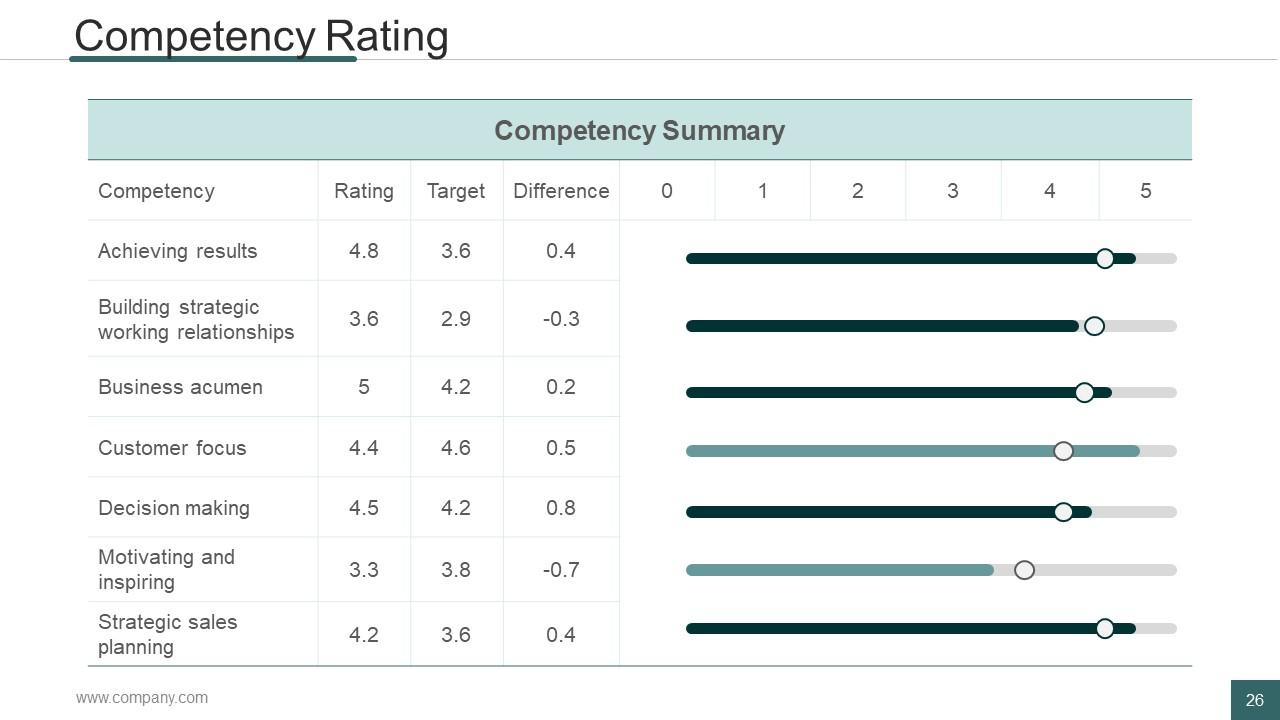
Slide 26: This slide showcases Competency Rating with Competency Summary in a tabular form.
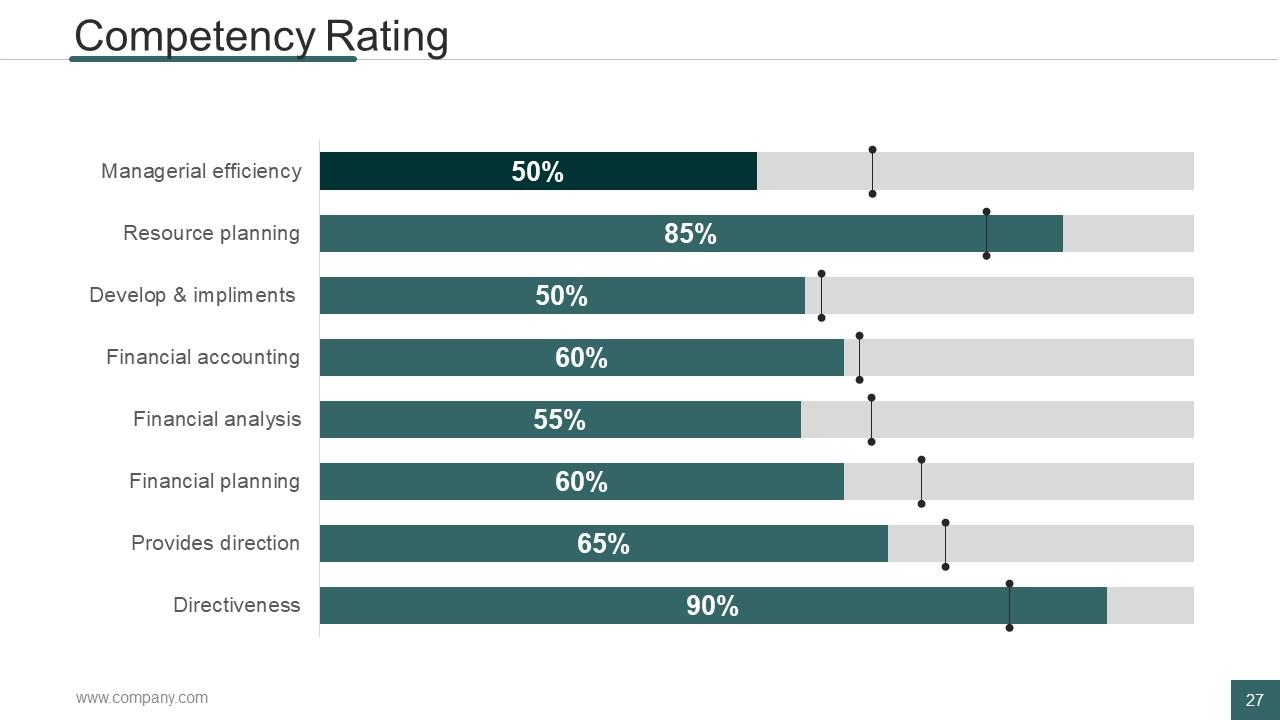
Slide 27: This is Competency Rating slide showing the following aspects in a bar graph/ chart form- Managerial efficiency, Resource Planning, Develop and impliments, Financial accounting, Financial analysis, Financial planning, Provides Direction, Directiveness.
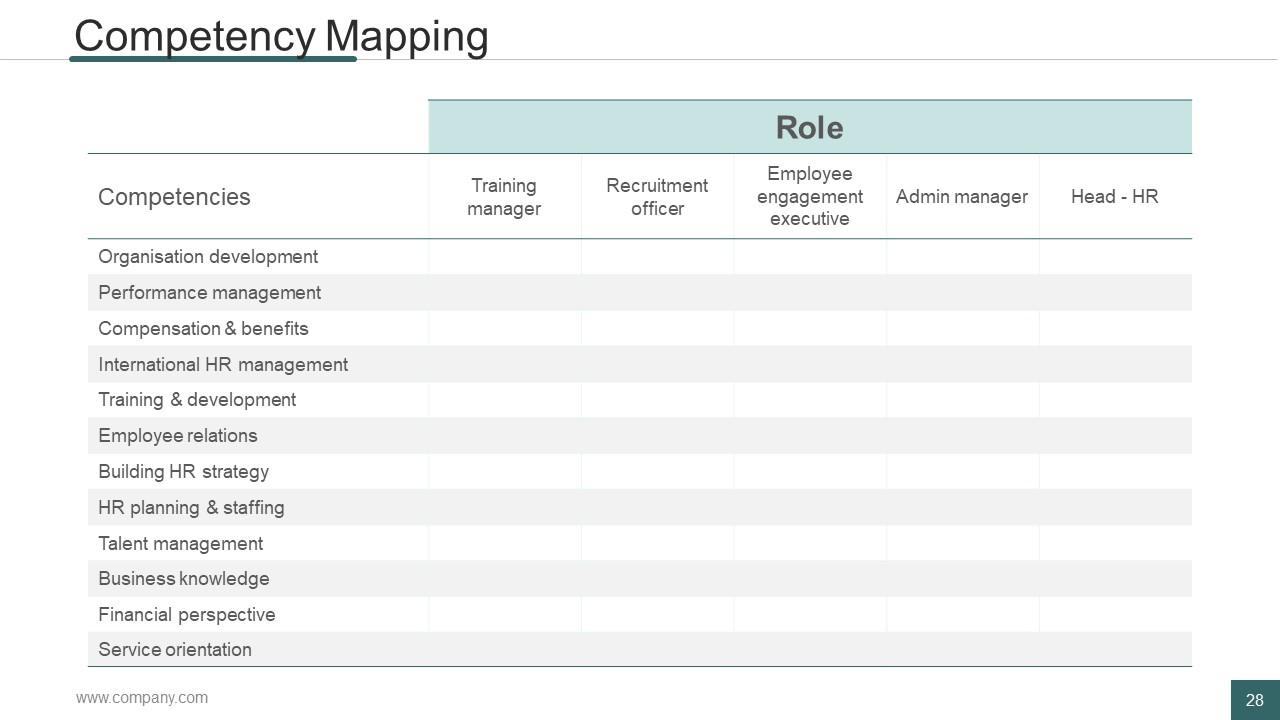
Slide 28: This slide showcases Competency Mapping table. Present relevant information here.
Slide 29: This is Employee Productivity Metrics slide to state.
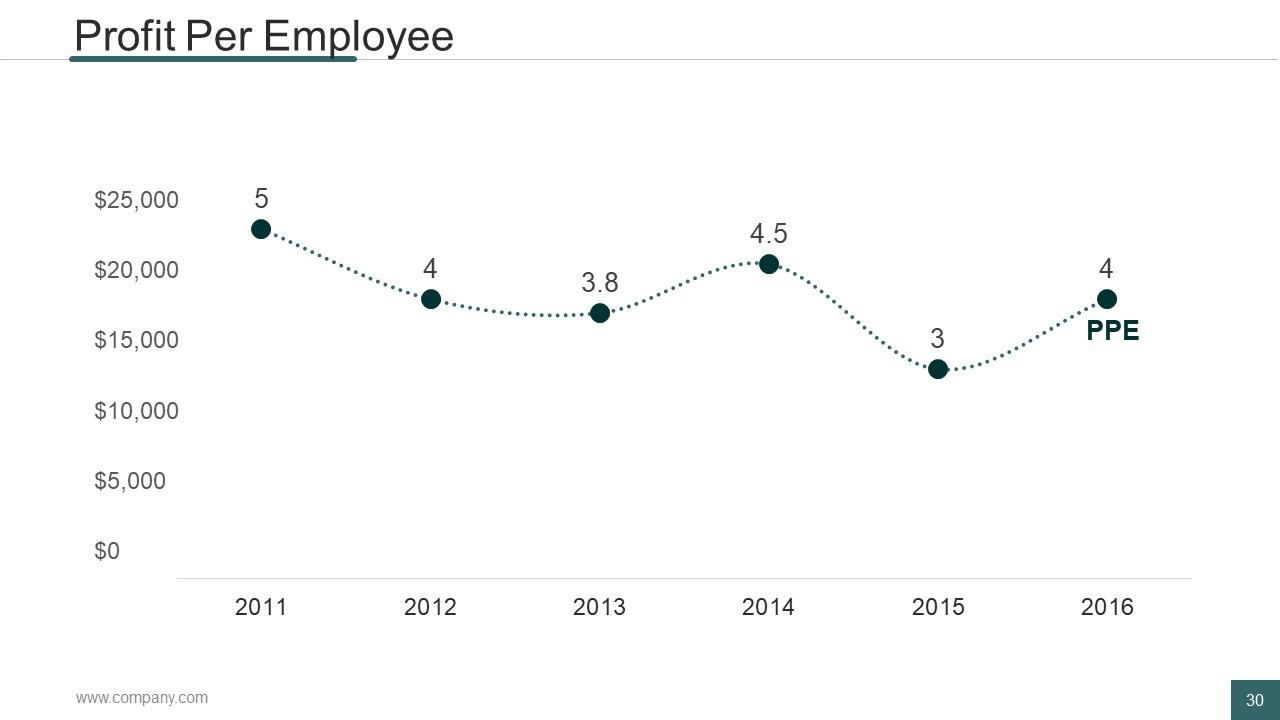
Slide 30: This slide showcases Profit Per Employee in a graph form.
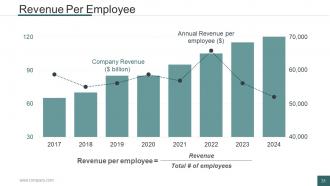
Slide 31: This slide showcases Revenue Per Employee graph. Use it for analysis etc.
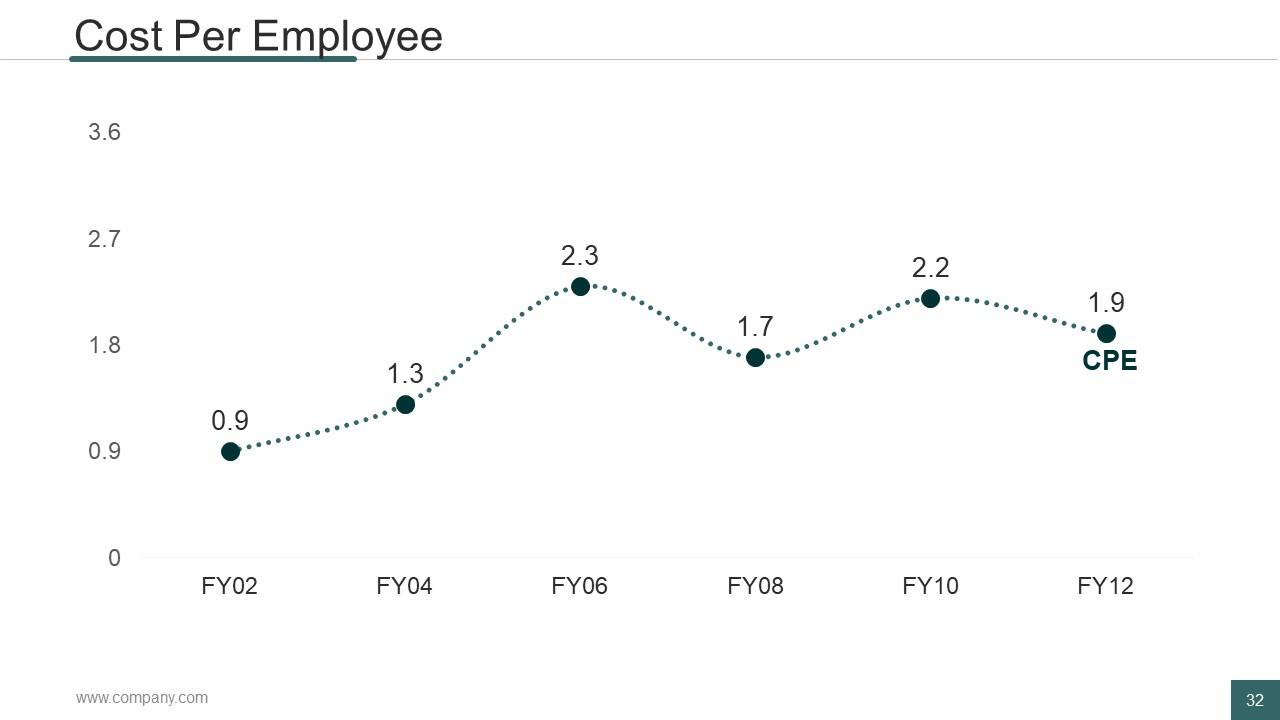
Slide 32: This slide showcases Cost Per Employee graph. Use it to assess your own cost.
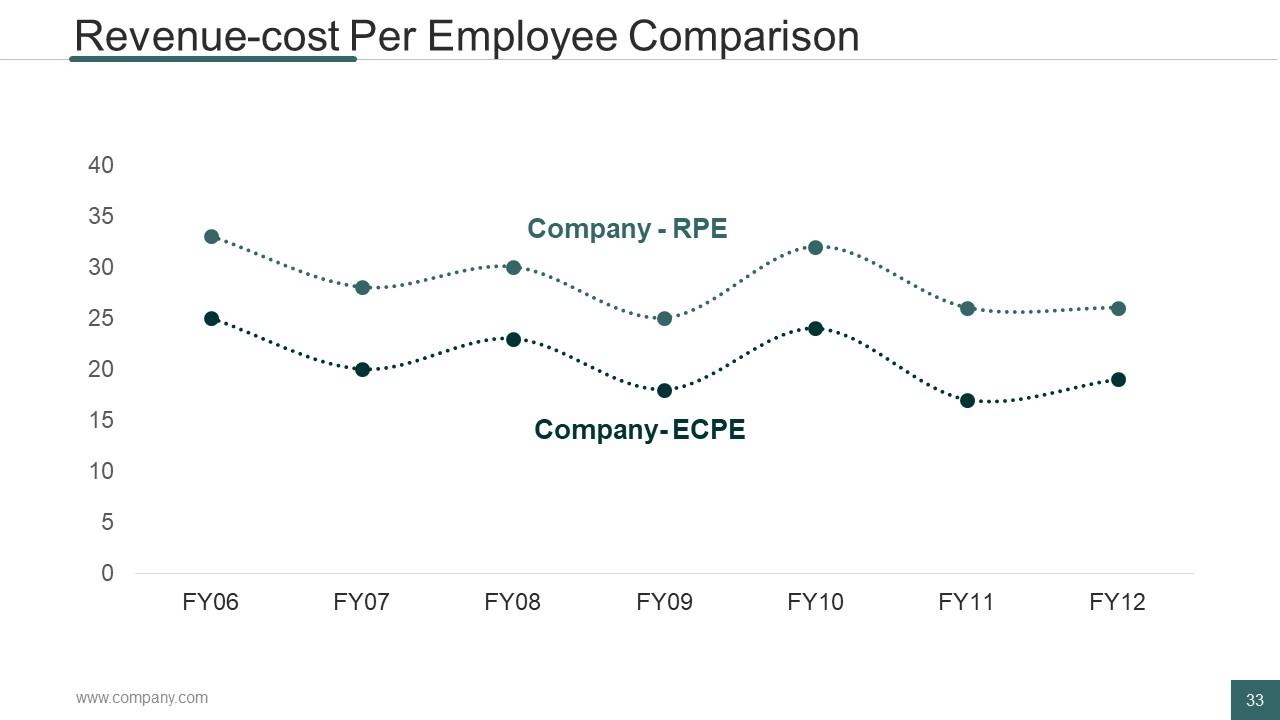
Slide 33: This is Revenue-cost Per Employee Comparison slide in a graph form. Use it to state a comparison between the following- Company - RPE, Company- ECPE.
Slide 34: This is Workforce Profile Metrics slide.
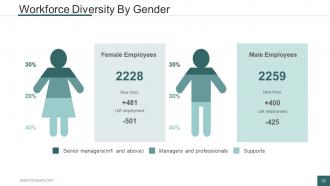
Slide 35: This slide showcases Workforce Diversity By Gender with male and female imagery. Present the stats of your male employees and female employees here.
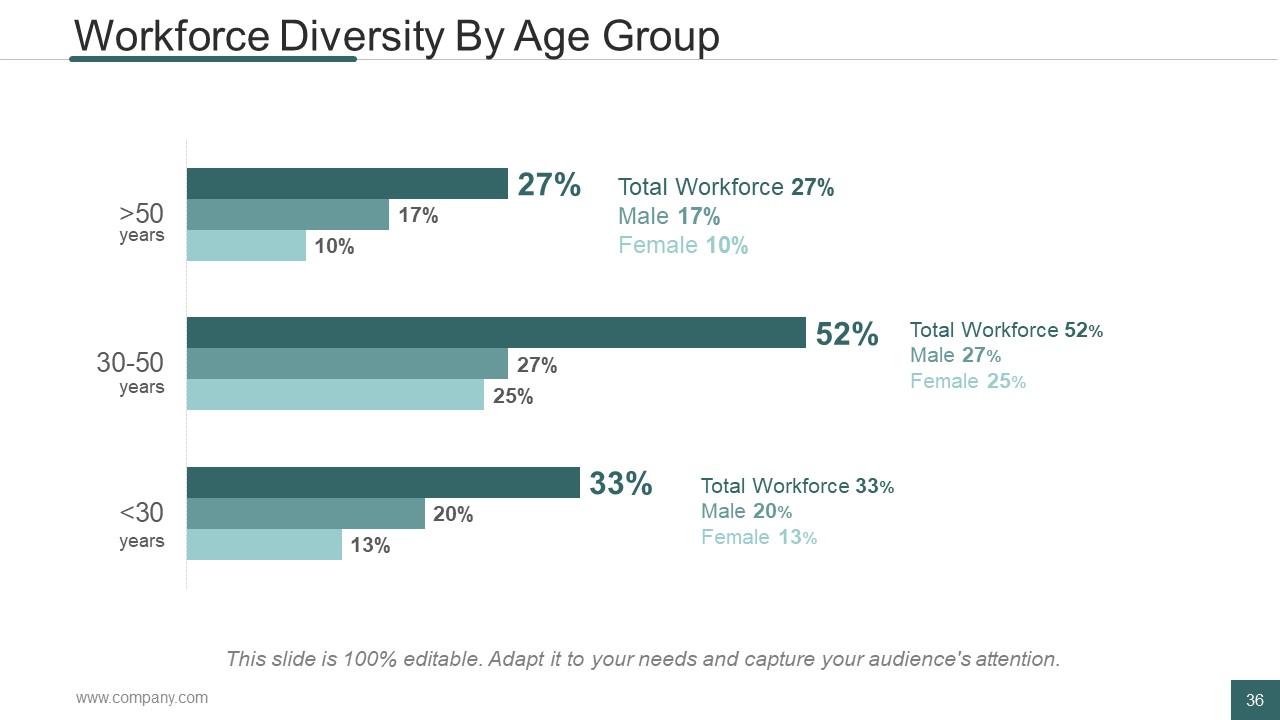
Slide 36: This slide shows Workforce Diversity By Age Group in a bar graph/ chart form.
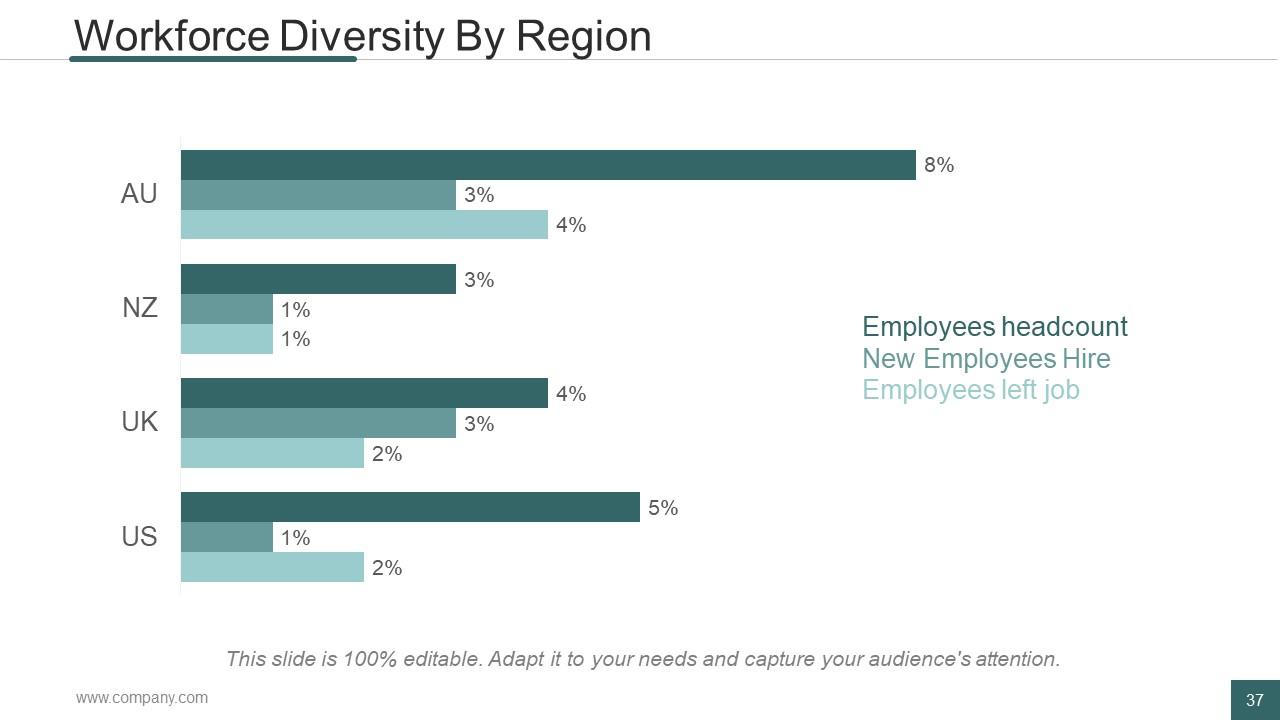
Slide 37: This slide showcases Workforce Diversity By Region in a bar graph/ chart form. Use it to present the stats of following aspects- Employees headcount, New Employees Hire, Employees left job.
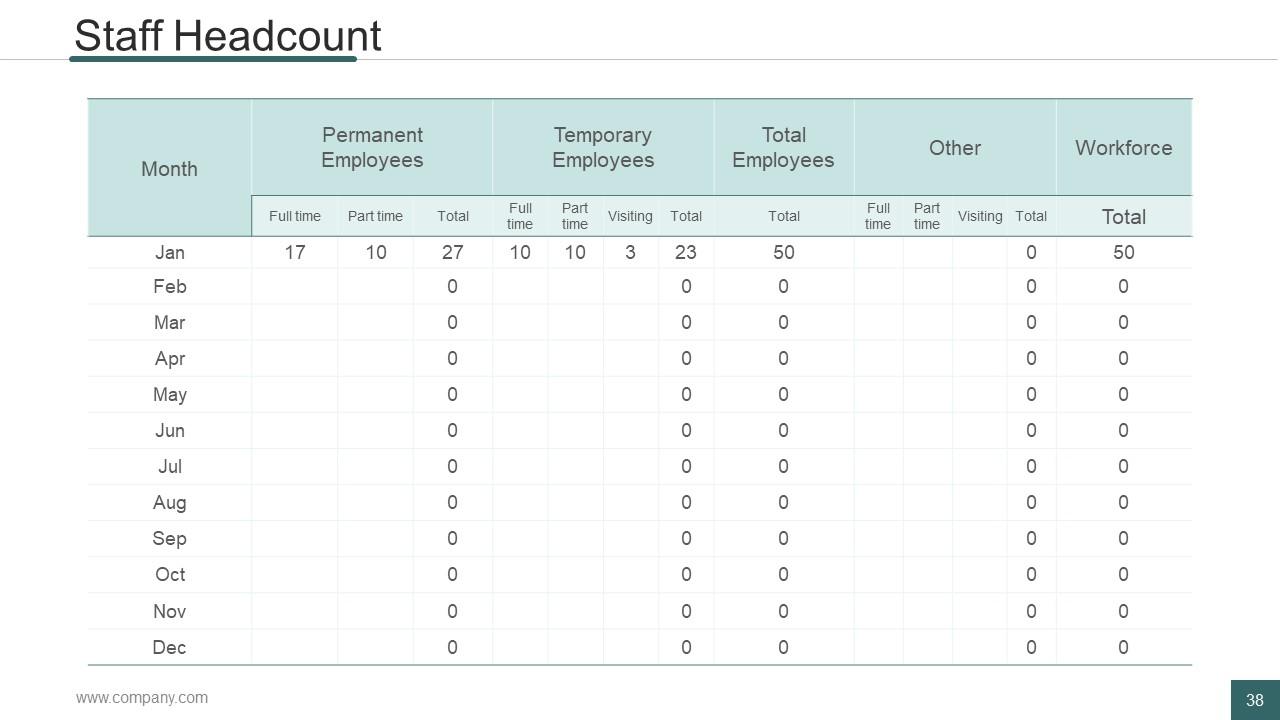
Slide 38: This slide showcases Staff Headcount in a tabular form. State them here.
Slide 39: This is Employee Engagement Metrics slide to move forward.
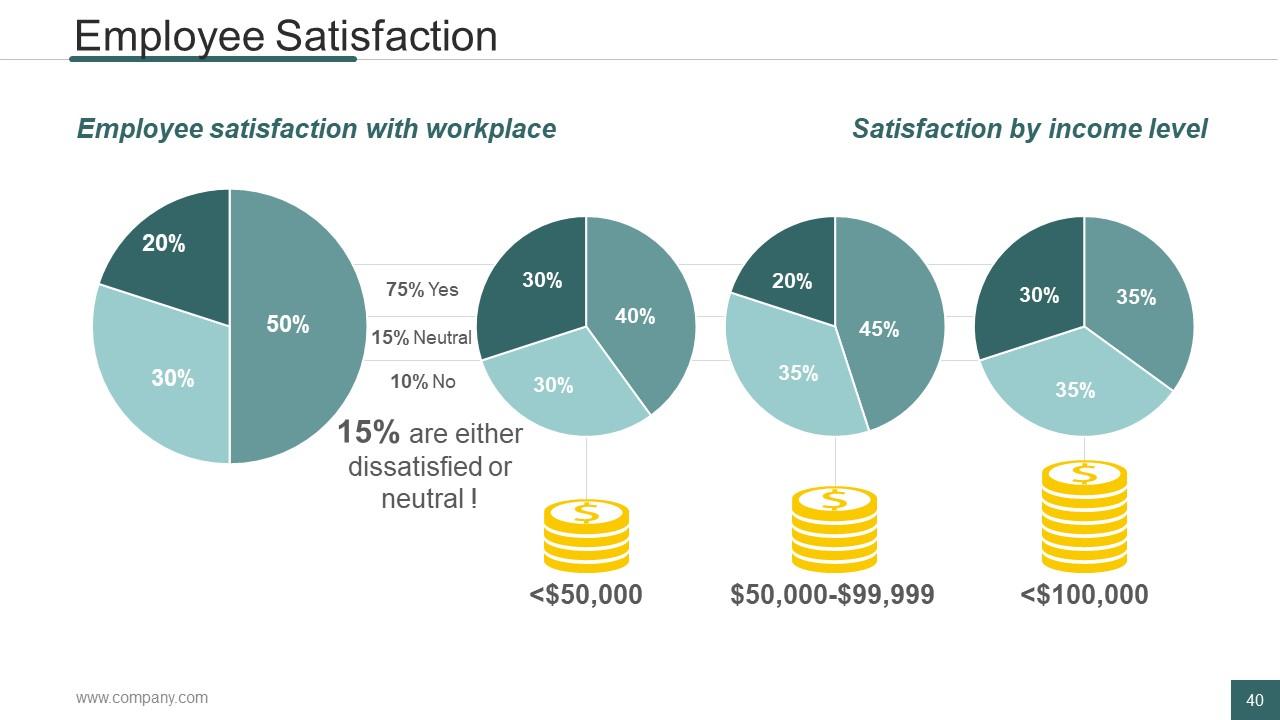
Slide 40: This is an Employee Satisfaction slide in a pie chart form. Use it to present the following- Employee satisfaction with workplace, Satisfaction by income level.
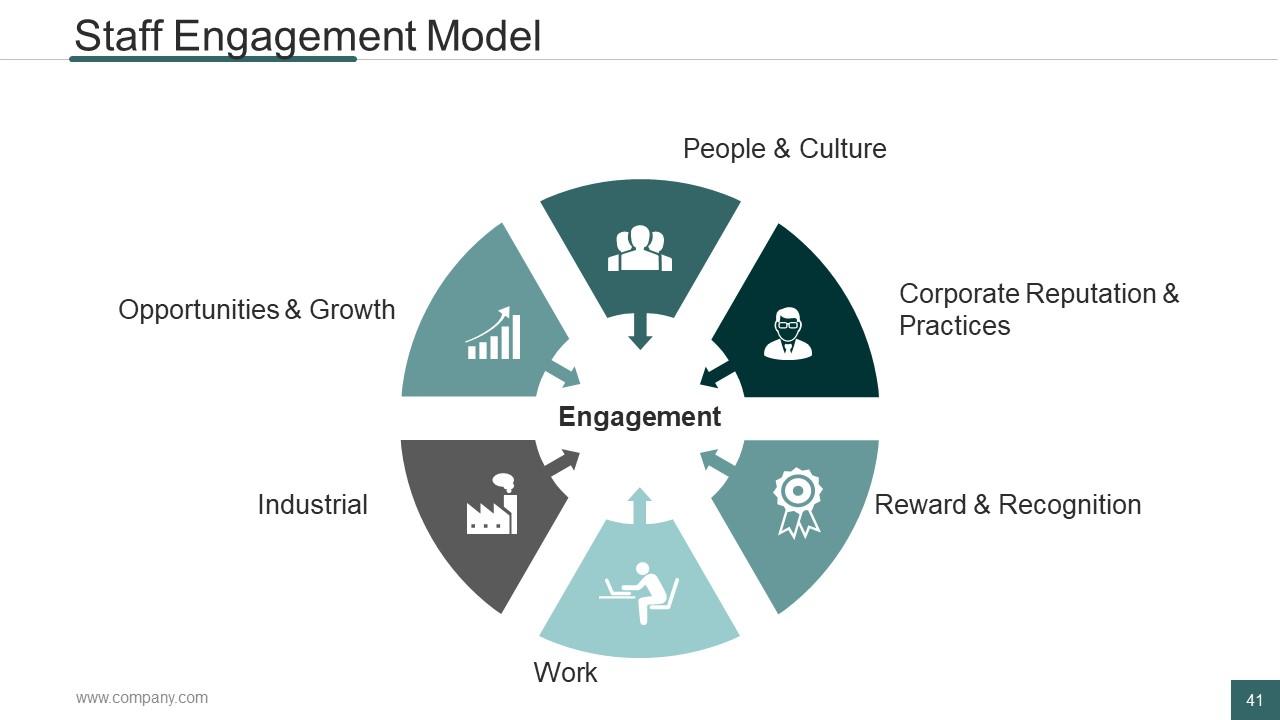
Slide 41: This slide showcases Staff Engagement Model in a circular image form. It consists of the following factors- People & Culture, Corporate Reputation & Practices, Reward & Recognition, Work, Industrial, Opportunities & Growth, Engagement.
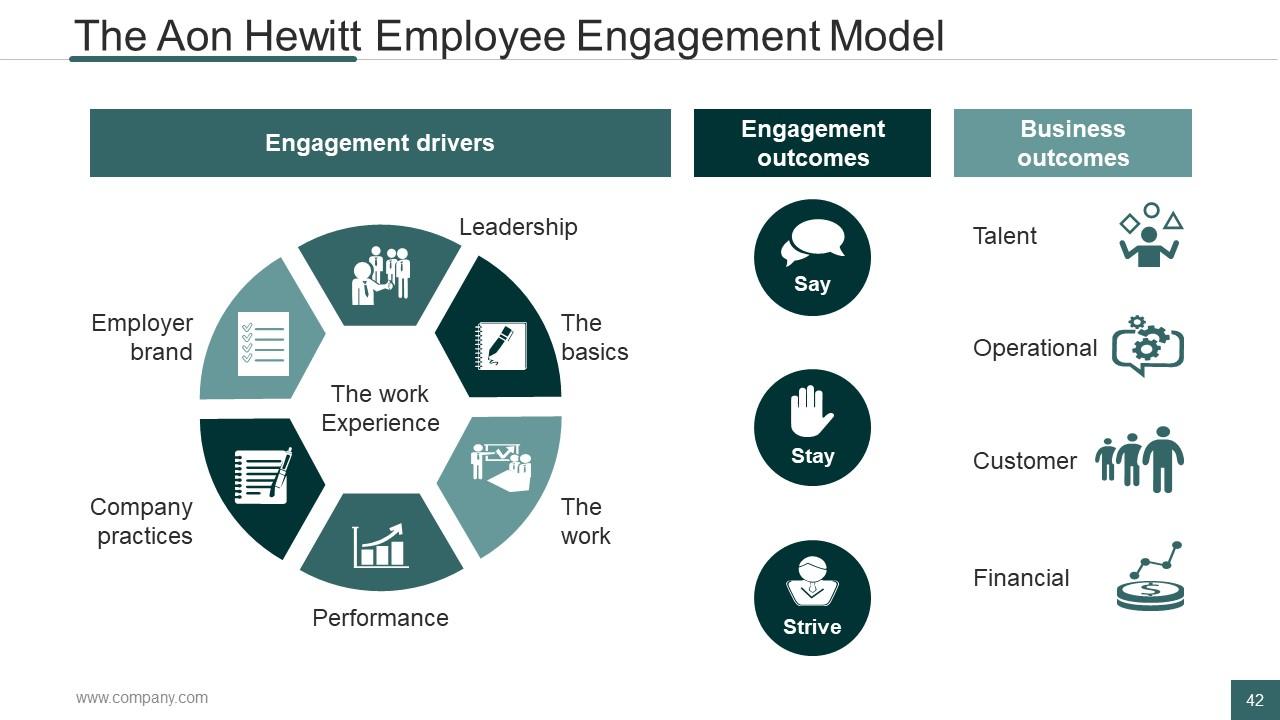
Slide 42: This is The Aon Hewitt Employee Engagement Model slide showing- Engagement outcomes, Business outcomes, Engagement drivers.
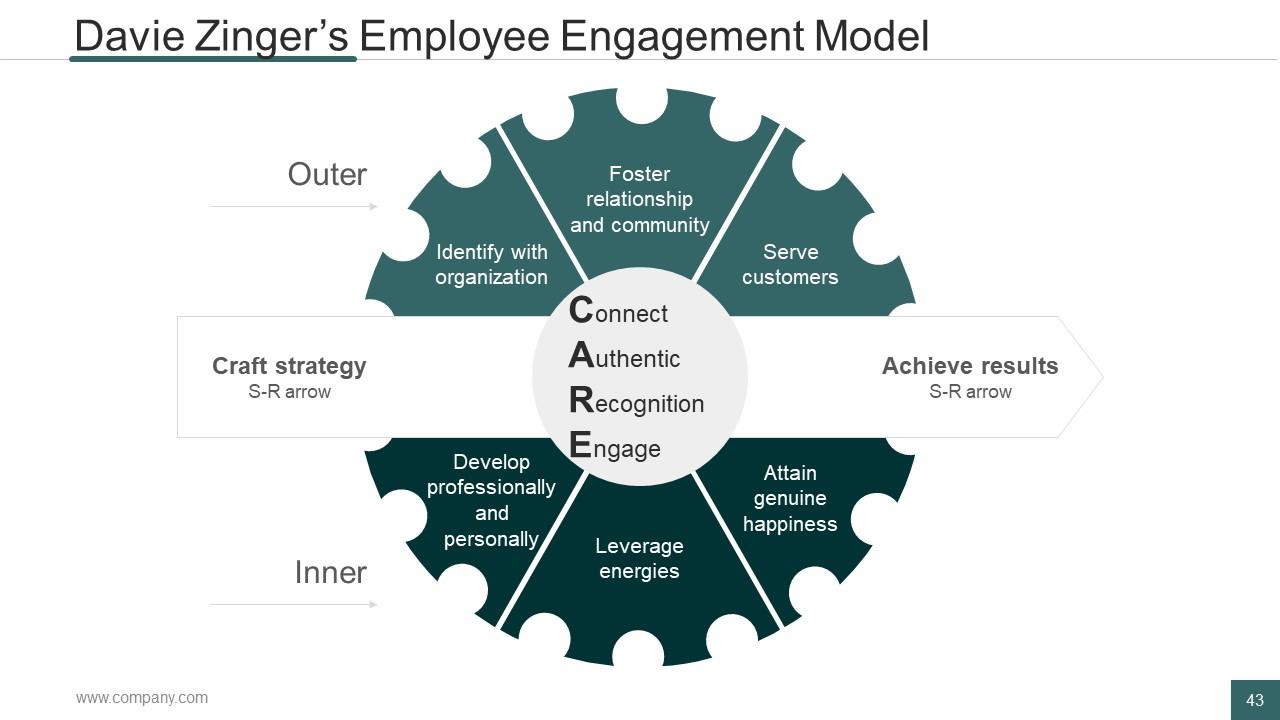
Slide 43: This slide showcases Davie Zinger’s Employee Engagement Model in a circular form.
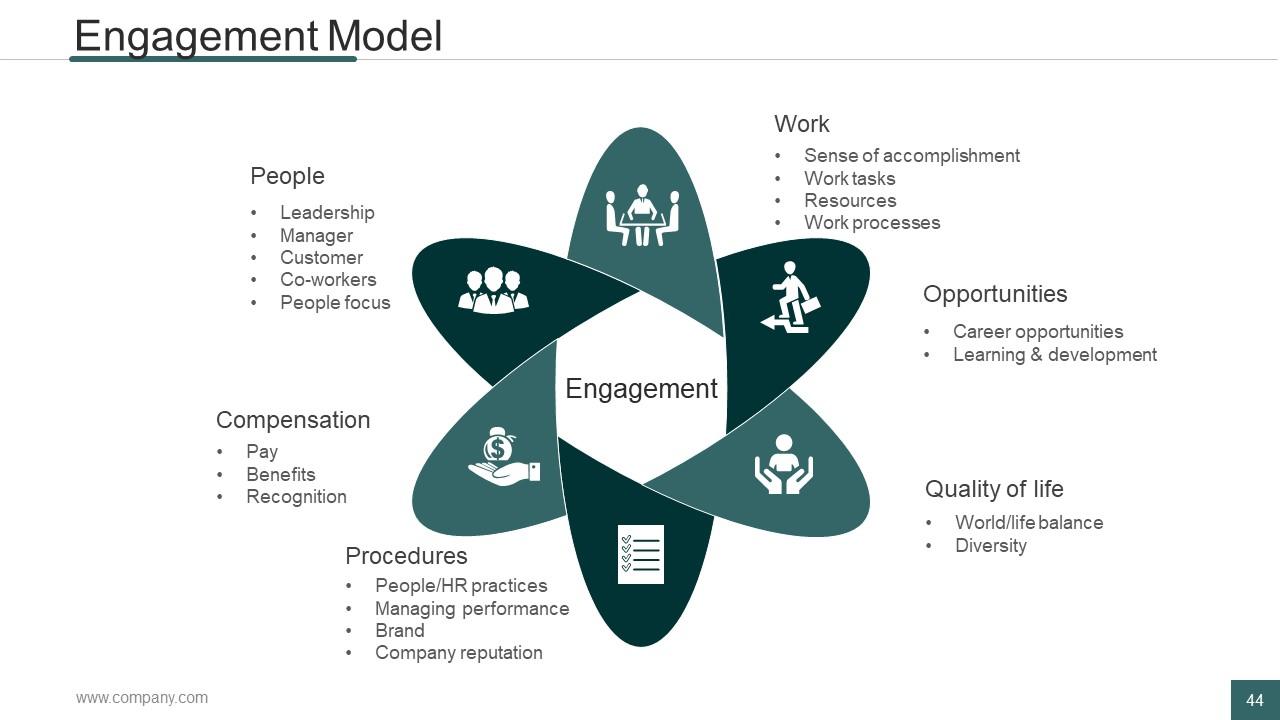
Slide 44: This slide showcases Engagement Model in a creative form with icon imagery. Use it to state the following factors- Work, Opportunities, Quality of life, Procedures, Compensation, People.
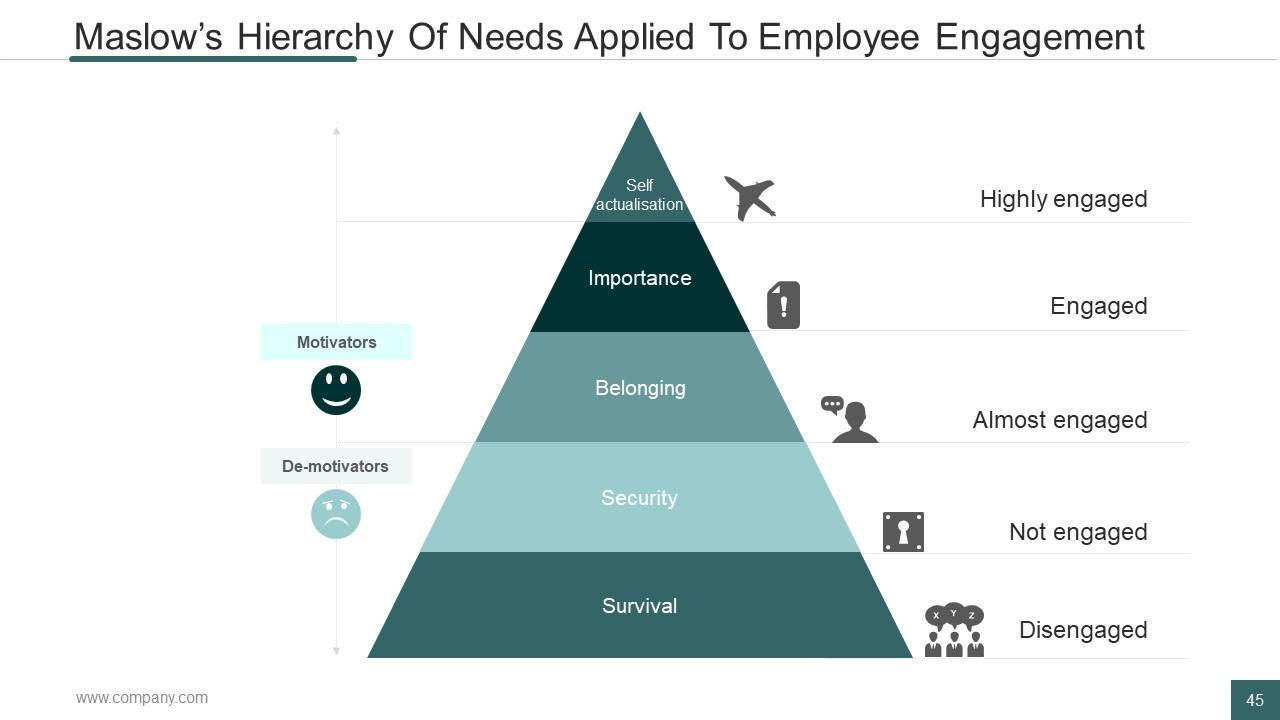
Slide 45: This slide showcases Maslow’s Hierarchy Of Needs Applied To Employee Engagement in a pyramid form. It has 5 levels which are- Self actualisation, Survival, Importance, Security, Belonging. Each of the level further shows the level of engagement. Use it as per your own need.
Slide 46: This is Recruitment Metrics slide to move ahead.
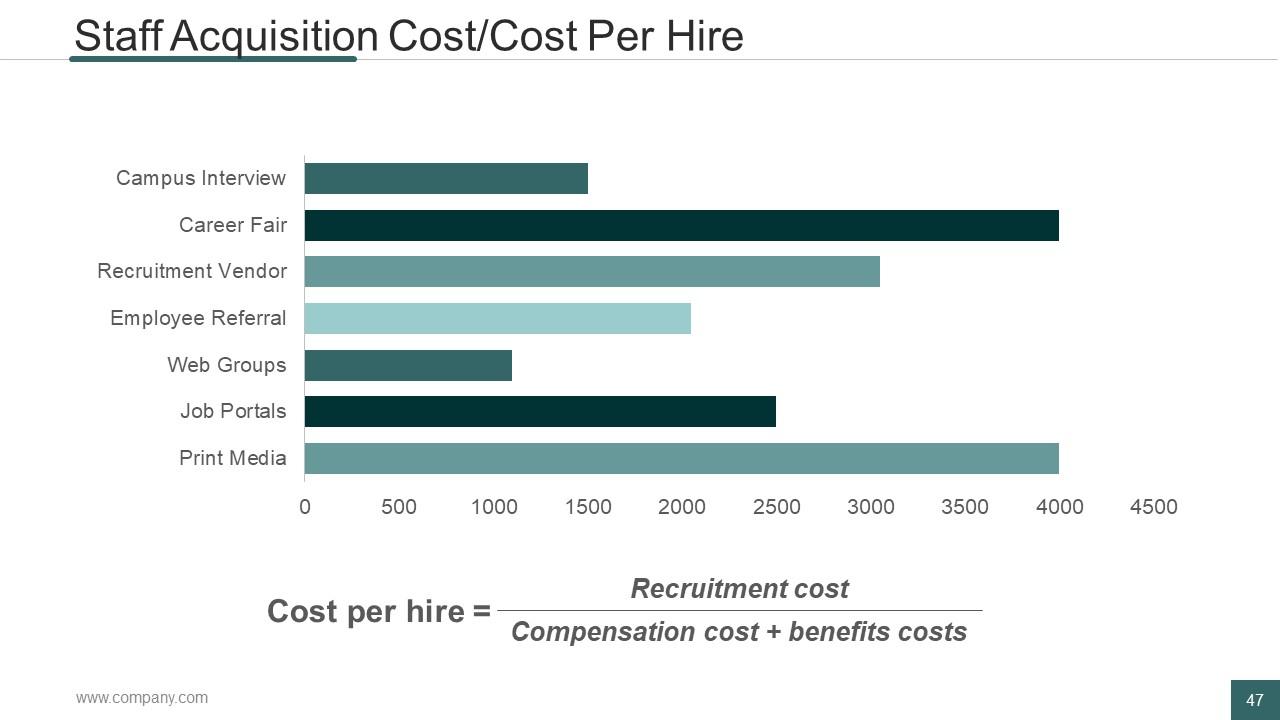
Slide 47: This slide shows Staff Acquisition Cost/Cost Per Hire. Present it here in a bar graph/ chart form.
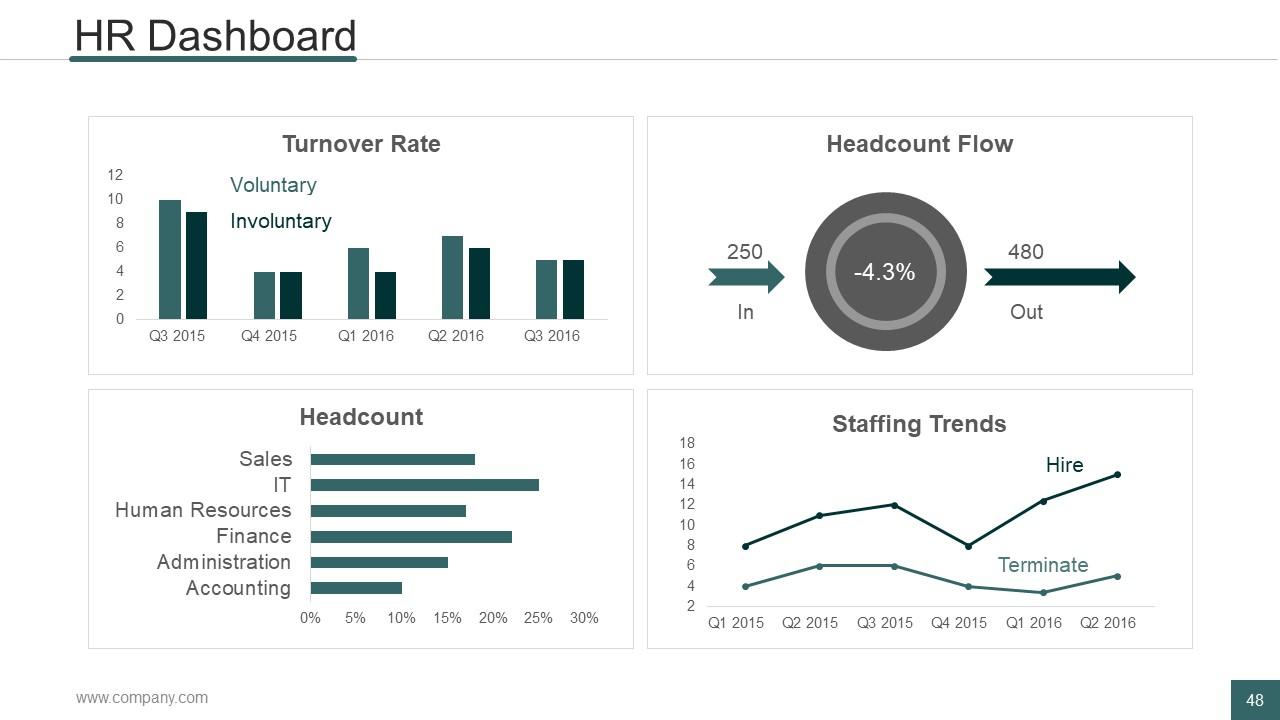
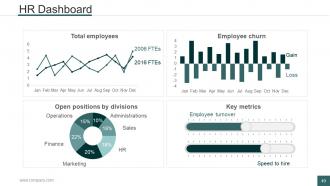
Slide 48: This slide showcases HR Dashboard in charts and graphs. Use it according to your need.
Slide 49: This slide also showcases HR Dashboard in charts and graphs.
Slide 50: This slide is titled Additional Slides to move forward. You can change the slide content as per need.
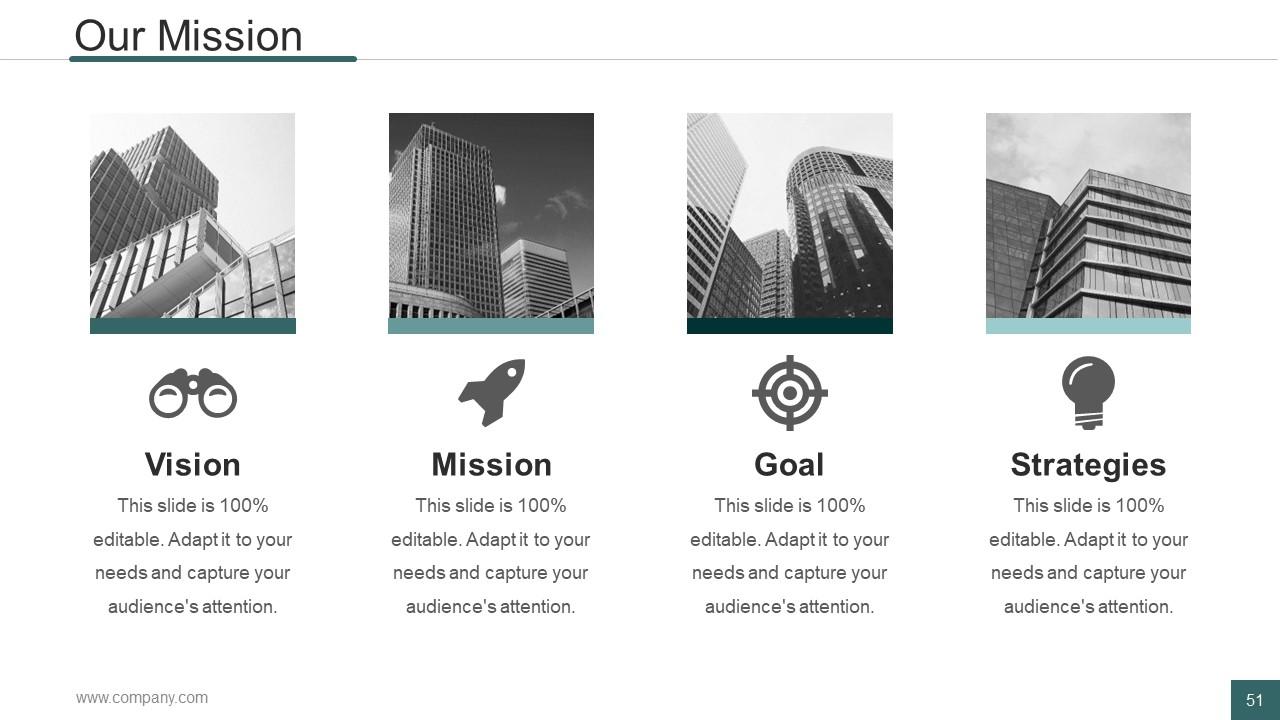
Slide 51: This is Our Mission slide. State it here.
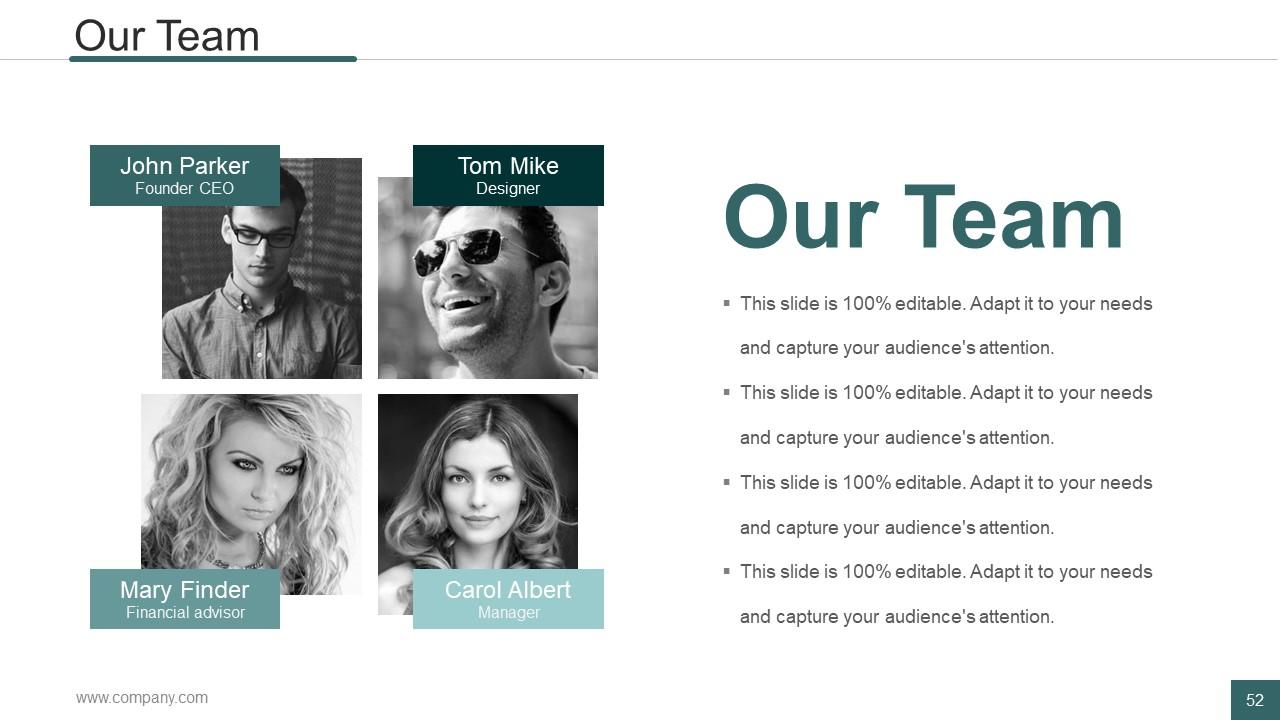
Slide 52: This slide showcases Our team with name, designation and image boxes.
Slide 53: This is Our Goal slide with imagery. State your goals here.
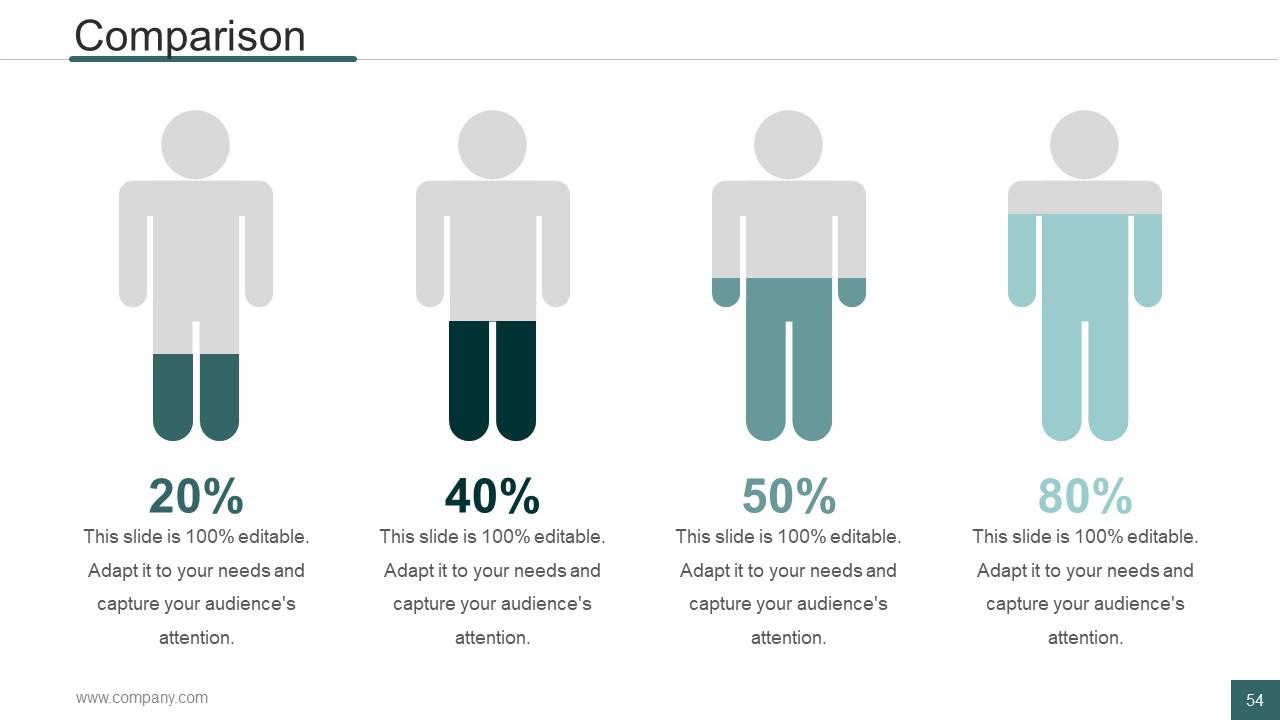
Slide 54: This is a Comparison slide to compare product/enitities etc.
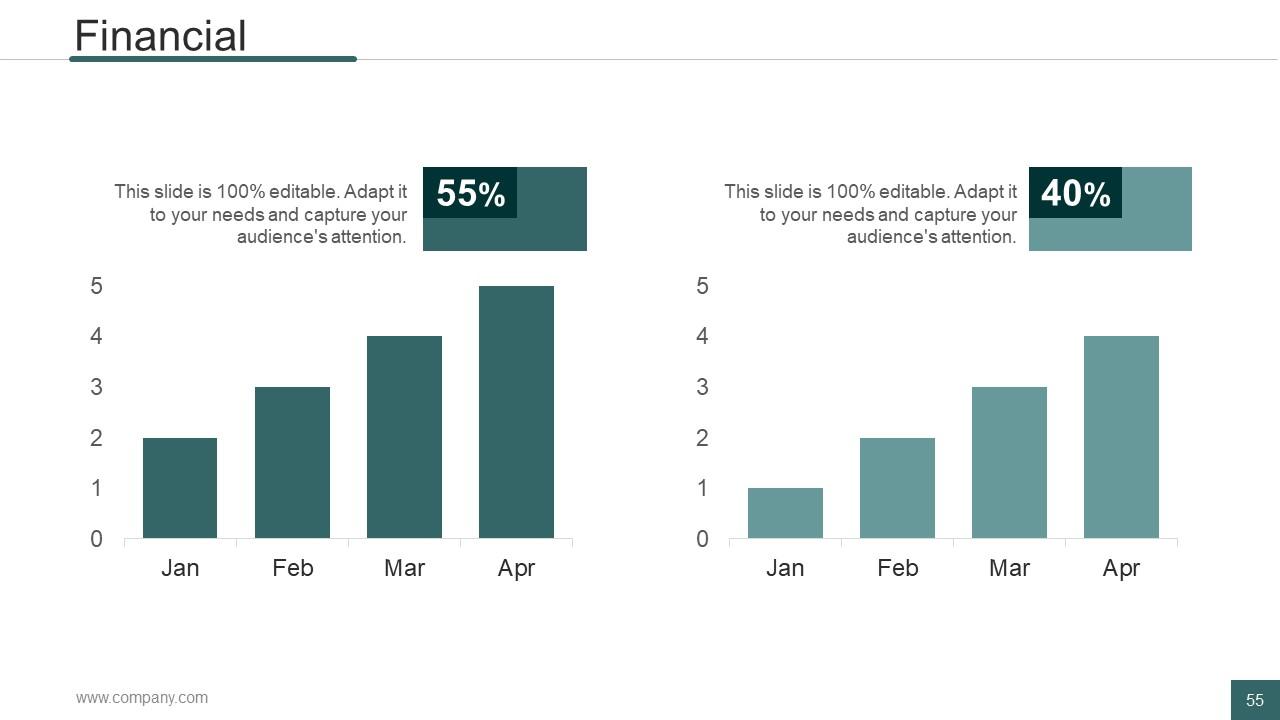
Slide 55: This is a Financial score slide. State financial aspects etc. here.
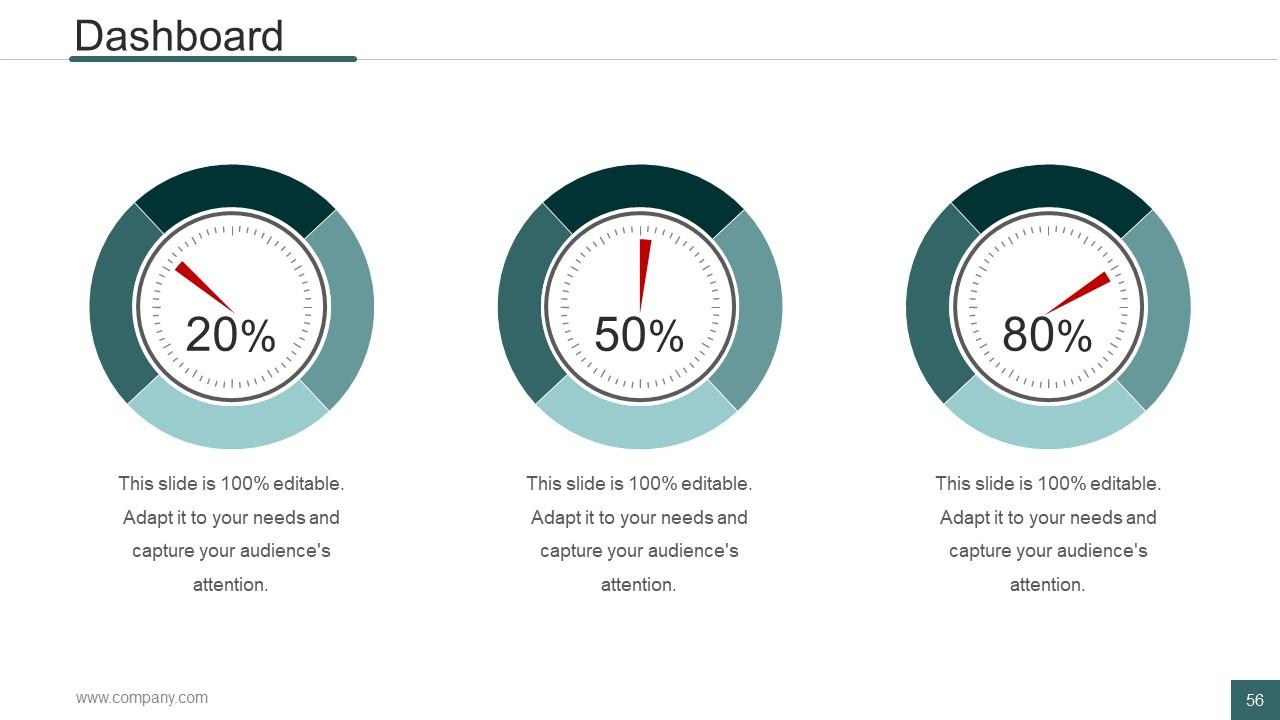
Slide 56: This is Dashboard slide to show information in percentages etc.
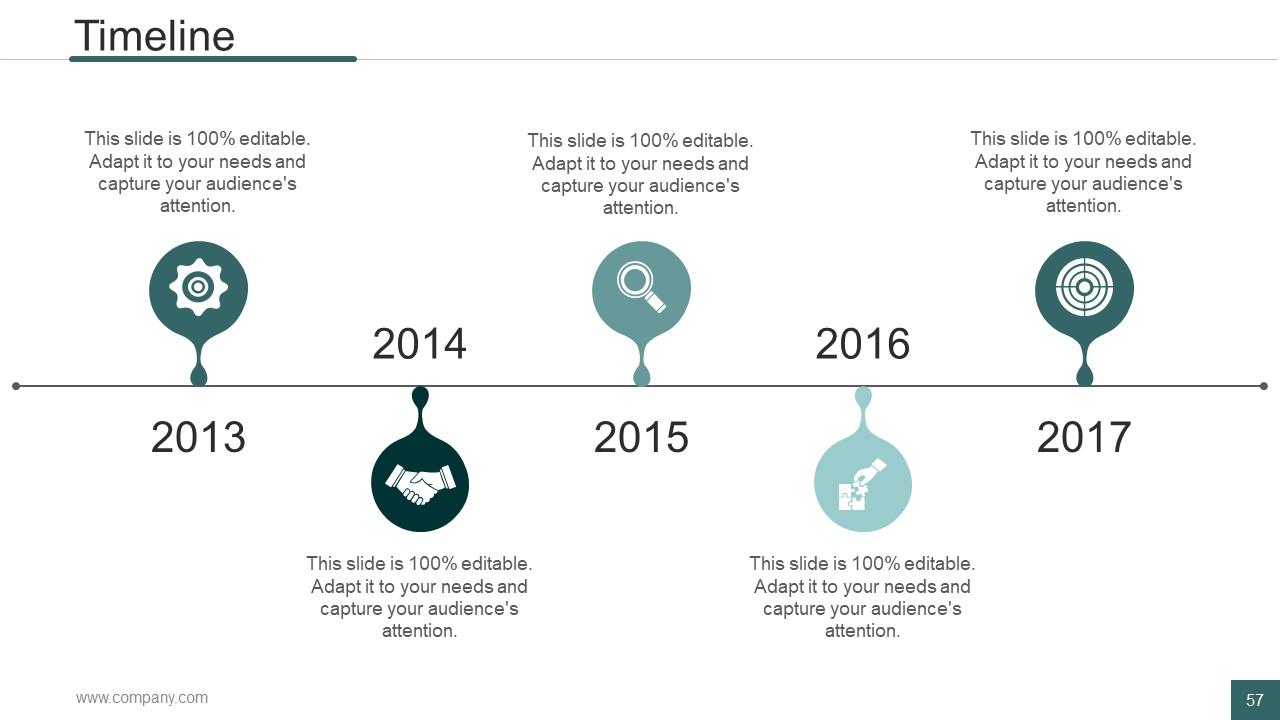
Slide 57: This slide presents a Timeline to show growth, milestones etc.
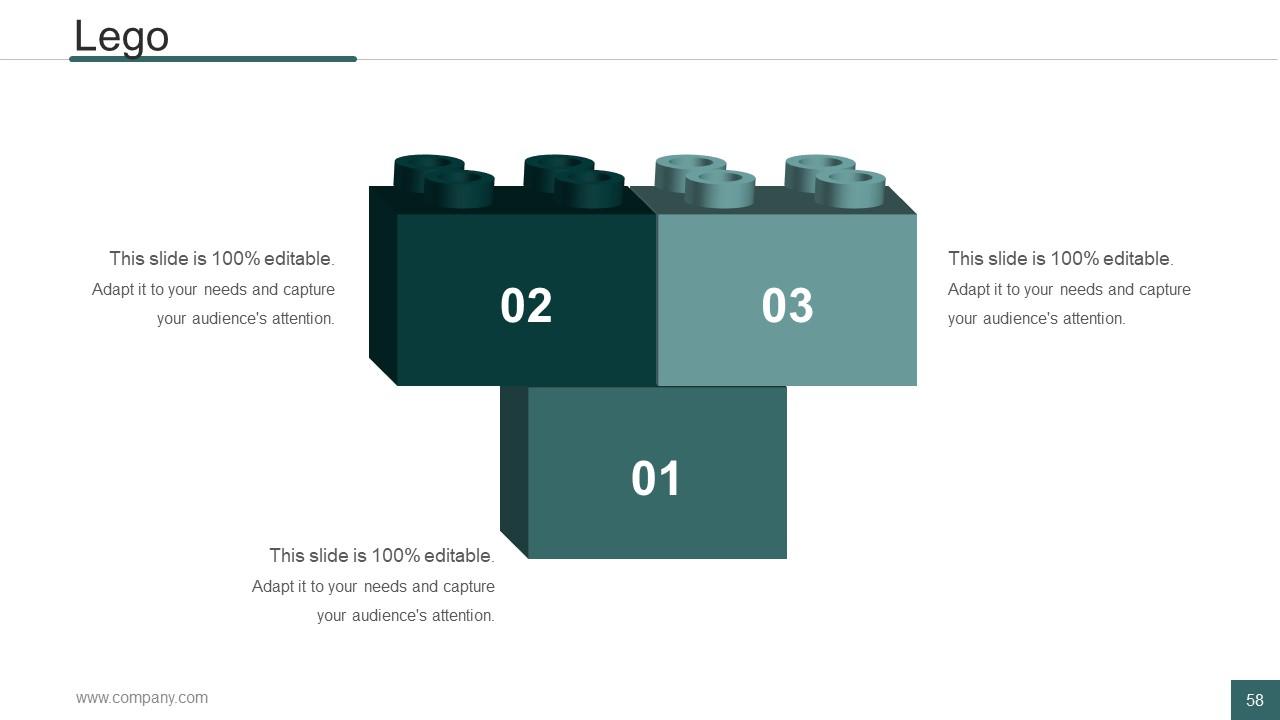
Slide 58: This is a LEGO slide with text boxes to show information.
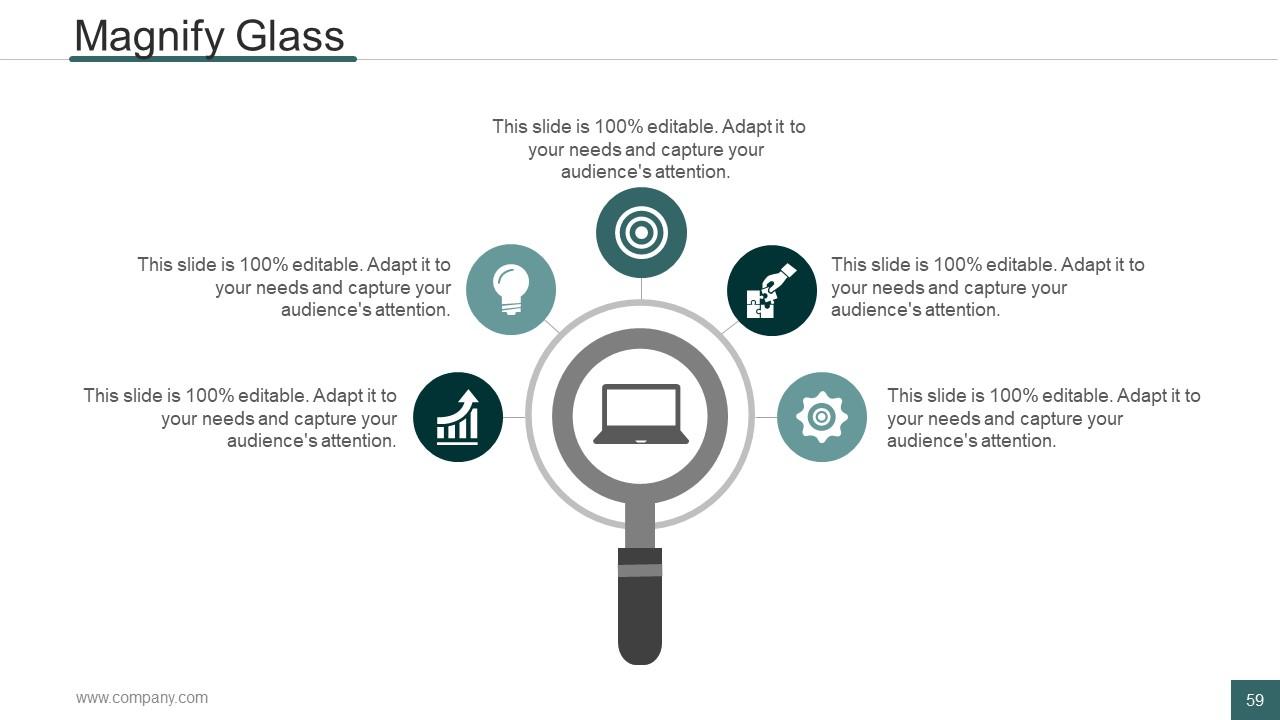
Slide 59: This is a Magnifying glass image slide to show information, scoping aspects etc.
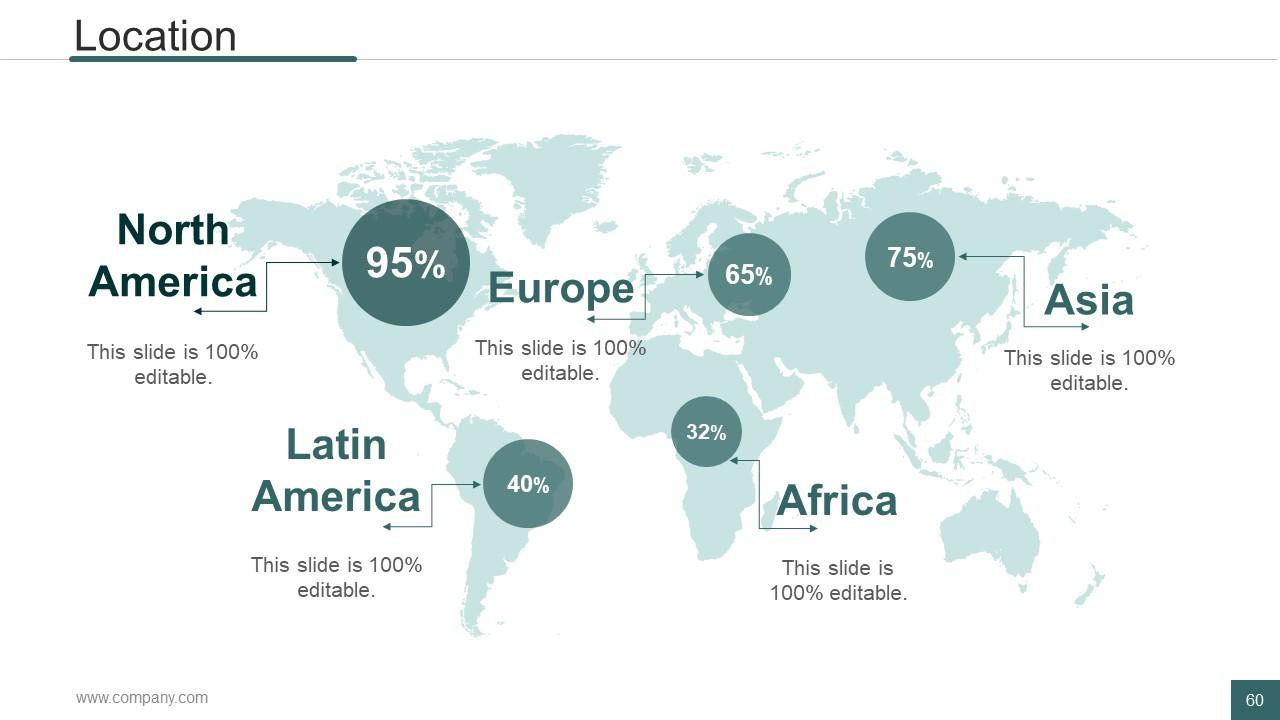
Slide 60: This is a Location slide to show global segregation, presence etc. on a world map and text boxes to make it explicit.
Slide 61: This is a Thank You slide with Address# street number, city, state, Contact Numbers, Email Address.
Human Resources Management Process Powerpoint Presentation Slides with all 61 slides:
Rough design can kill even the best planned presentation. Our Human Resources Management Process Powerpoint Presentation Slides will lend your projects world class design.
-
Unique and attractive product design.
-
Best way of representation of the topic.


