Pdca cycle and continuous improvement powerpoint presentation slides
Here we are showcasing our readymade 80 slides complete deck Pdca Cycle And Continuous Improvement Powerpoint Presentation Slides as it is the one thing that you really don’t want to mess up your PDCA presentation. Using this PPT example you can highlight the importance of multi-step management method used in business for the control and continual improvement of processes and products. This Pdca Cycle And Continuous Improvement presentation deck sample has slides like agenda, Kaizen 5S framework, 4M checklist namely man, machine, material, method, PDCA cycle, kaizen vs. innovation, problem and statement, our goals, action plan, competitor analysis, histograms, lead time and cycle time, solutions to the problem and many more. In addition, our PowerPoint show supports to highlight the understanding on types of waste like overproduction, waiting, transportation/moving, process inefficiencies, inventories/storage, unnecessary motions and defective products for better utilization of resources and to overcome business roadblocks. Using presentation templates of this visual communication you can discuss various Pdca models thereby motivating project team to become a part of this decision-making process. As we have included exclusive PowerPoint presentation slides like pareto analysis, implement countermeasures, kaizen report form, bar chart, pie chart, scatter area slides, comparison, dashboard etc. to make it complete. In short, our Pdca cycle and improvement presentation deck not only saves time, but also has everything that a professional Pdca Cycle And Continuous Improvement PPT example must carry. Just click to download and amaze your colleagues. Our Pdca Cycle And Continuous Improvement Powerpoint Presentation Slides are an exceptional companion. Your brilliance will find a good friend.
- Google Slides is a new FREE Presentation software from Google.
- All our content is 100% compatible with Google Slides.
- Just download our designs, and upload them to Google Slides and they will work automatically.
- Amaze your audience with SlideTeam and Google Slides.
-
Want Changes to This PPT Slide? Check out our Presentation Design Services
- WideScreen Aspect ratio is becoming a very popular format. When you download this product, the downloaded ZIP will contain this product in both standard and widescreen format.
-

- Some older products that we have may only be in standard format, but they can easily be converted to widescreen.
- To do this, please open the SlideTeam product in Powerpoint, and go to
- Design ( On the top bar) -> Page Setup -> and select "On-screen Show (16:9)” in the drop down for "Slides Sized for".
- The slide or theme will change to widescreen, and all graphics will adjust automatically. You can similarly convert our content to any other desired screen aspect ratio.
Compatible With Google Slides

Get This In WideScreen
You must be logged in to download this presentation.
PowerPoint presentation slides
Grab our professionally designed Pdca Cycle And Continuous Improvement PowerPoint presentation that is sure to impress executives, inspire team members and other audience. With a complete set of 80 slides, this PPT is the most comprehensive summary of Pdca you could have asked for. The content is extensively researched and designs are professional. Our PPT designers have worked tirelessly to craft this deck using beautiful PowerPoint templates, graphics, diagrams and icons. On top of that, the deck is 100% editable in PowerPoint so that you can enter your text in the placeholders, change colors if you wish to, and present in the shortest time possible.
People who downloaded this PowerPoint presentation also viewed the following :
Content of this Powerpoint Presentation
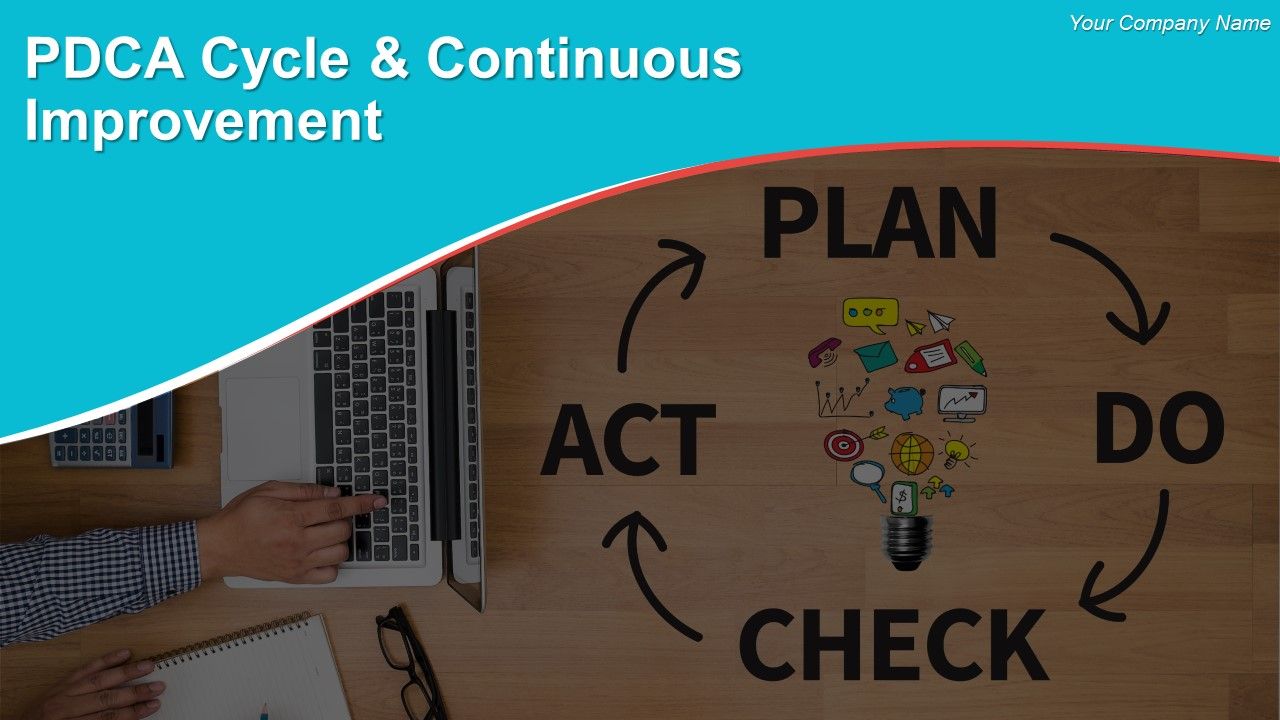
Slide 1: This slide introduces PDCA Cycle & Continuous Improvement. State Your Company Name and get started.
Slide 2: This is an Agenda slide. State your agendas here.
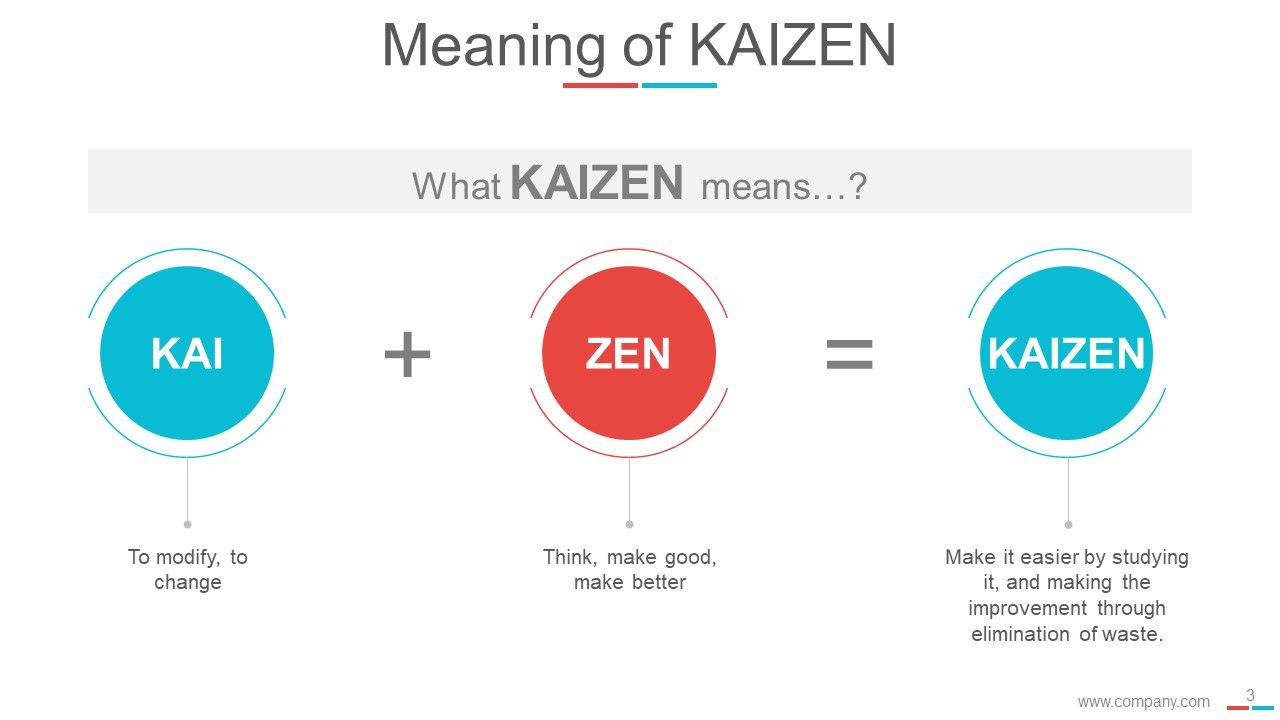
Slide 3: This slide presents Meaning of Kaizen with its definition.
Slide 4: This slide shows Kaizen 5S Framework- Good Housekeeping with the following points- Short (Organization): Separate needed items from unneeded and eliminate the latter. Set in order (Orderliness): Keep needed items in the correct place to allow easy and fast retrieval. Shine (Cleanliness): Keep the workspace swept and clean. Standardize (Standardized Cleanup): Creates a consistent approach with which tasks and procedures are done. Sustain(Orderliness): Habit To Maintain Established Processes.
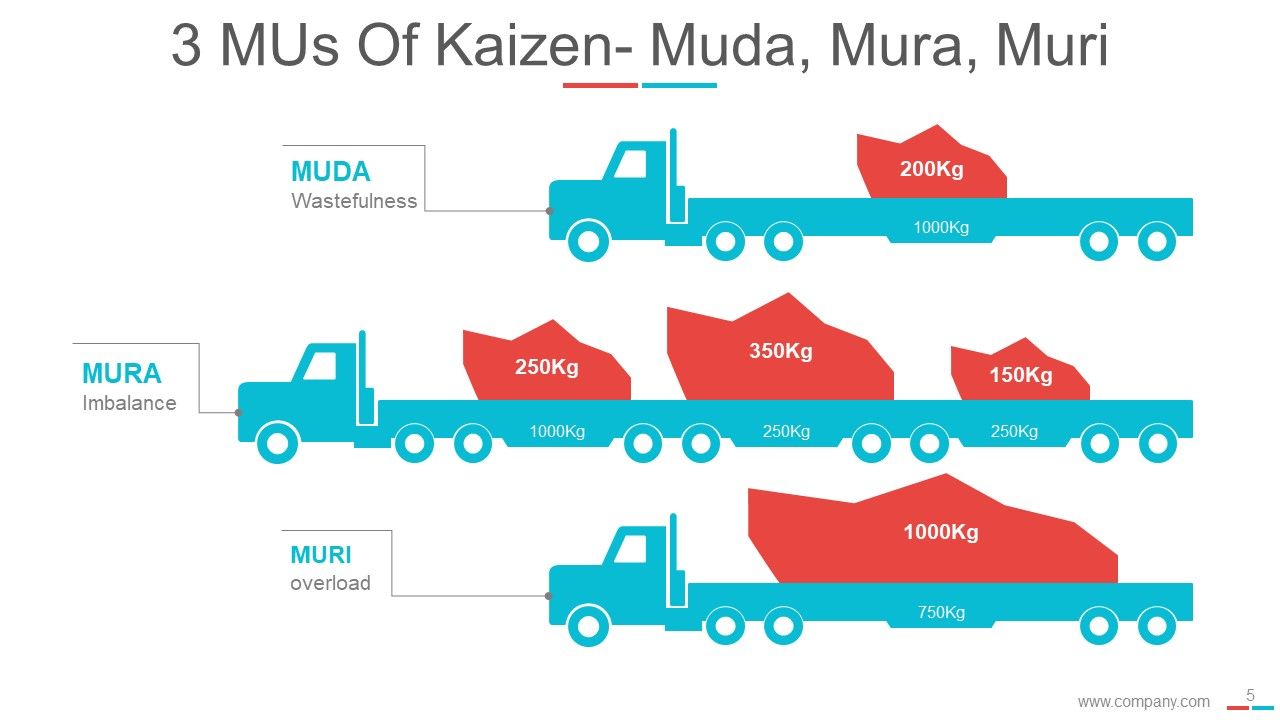
Slide 5: This slide presents 3 MUs Of Kaizen- MUDA, MURA, MURI as Wastefulness, Imbalance, Overload.
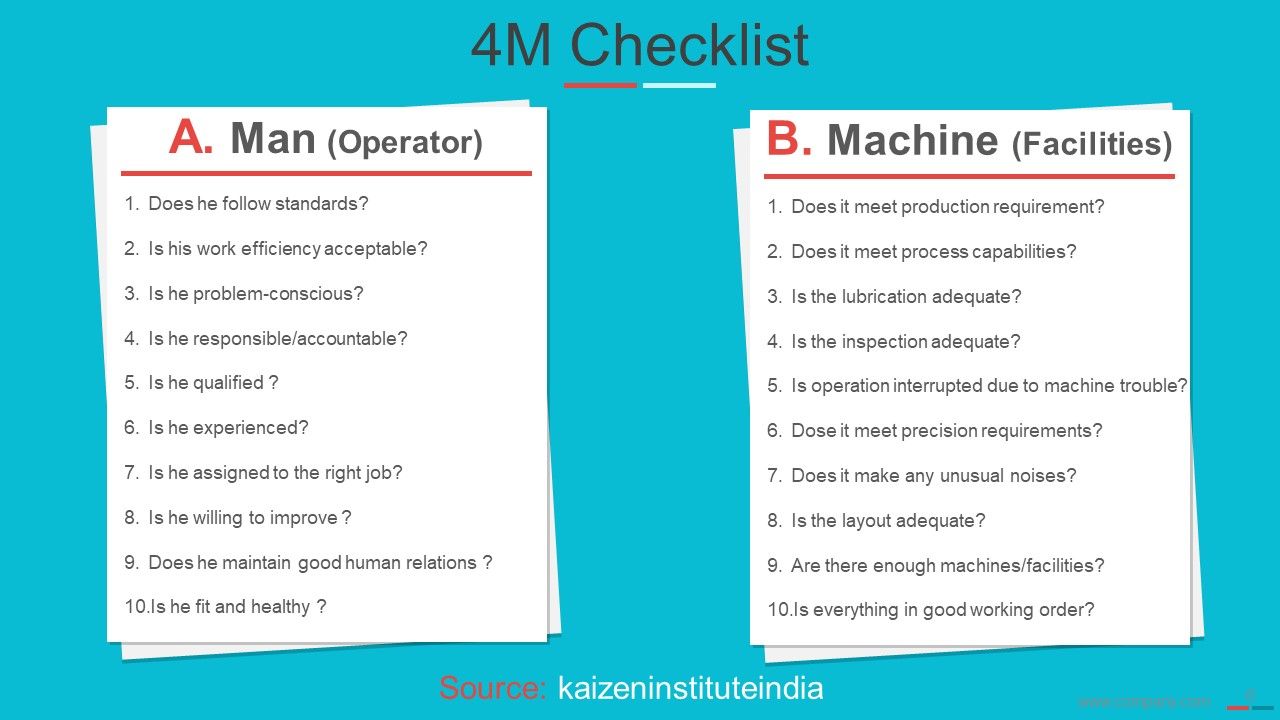
Slide 6: This slide shows 4M Checklist divdided into- 1.Man(Operator): Does the follow standards? Is his work efficiency acceptable? Is he problem-conscious? Is he responsible/accountable? Is he qualified ? Is he experienced? Is he assigned to the right job? Is he willing to improve ? Does he maintain good human relations ? Is he fit and healthy ? 2. Machine (Facilities): Does it meet production requirement? Does it meet process capabilities? Is the lubrication adequate? Is the inspection adequate? Is operation interrupted due to machine trouble? Dose it meet precision requirements? Does it make any unusual noises? Is the layout adequate? Are there enough machines/facilities? Is everything in good working order?
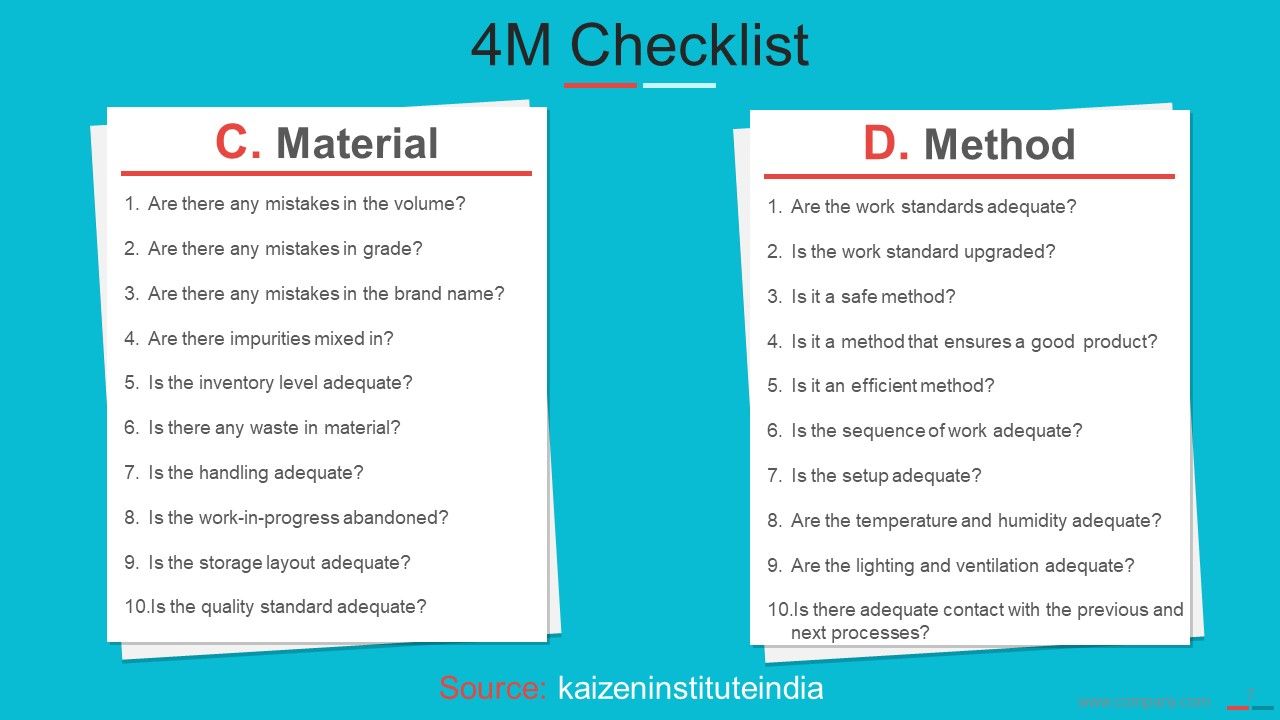
Slide 7: This slide shows 4M Checklist divdided into- 3. Material: Are there any mistakes in the volume? Are there any mistakes in grade? Are there any mistakes in the brand name? Are there impurities mixed in? Is the inventory level adequate? Is there any waste in material? Is the handling adequate? Is the work-in-progress abandoned? Is the storage layout adequate? Is the quality standard adequate? 4. Method: Are the work standards adequate? Is the work standard upgraded? Is it a safe method? Is it a method that ensures a good product? Is it an efficient method? Is the sequence of work adequate? Is the setup adequate? Are the temperature and humidity adequate? Are the lighting and ventilation adequate? Is there adequate contact with the previous and next processes?
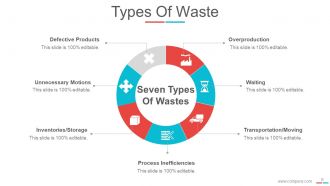
Slide 8: This slide showcases Types Of Waste Overproduction, Waiting, Transportation/Moving, Process Inefficiencies, Inventories/Storage, Unnecessary Motions, Defective Products.
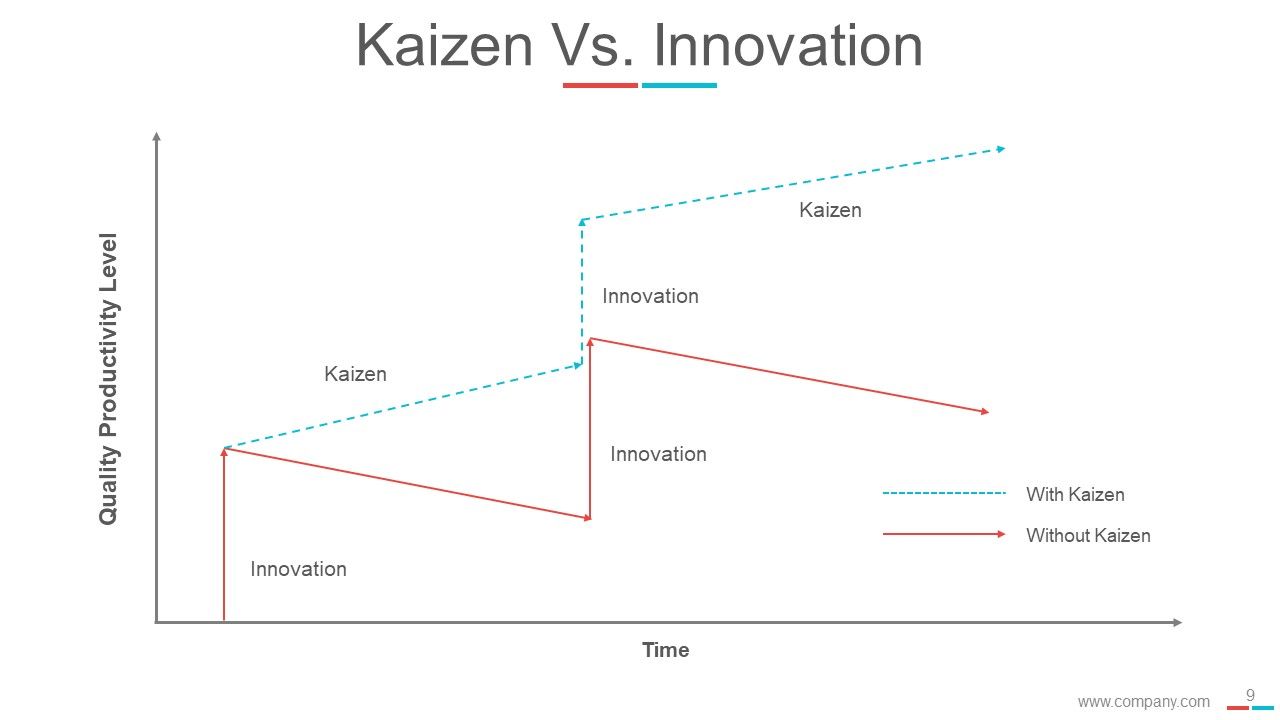
Slide 9: This is a Kaizen Vs. Innovation graph form slide.
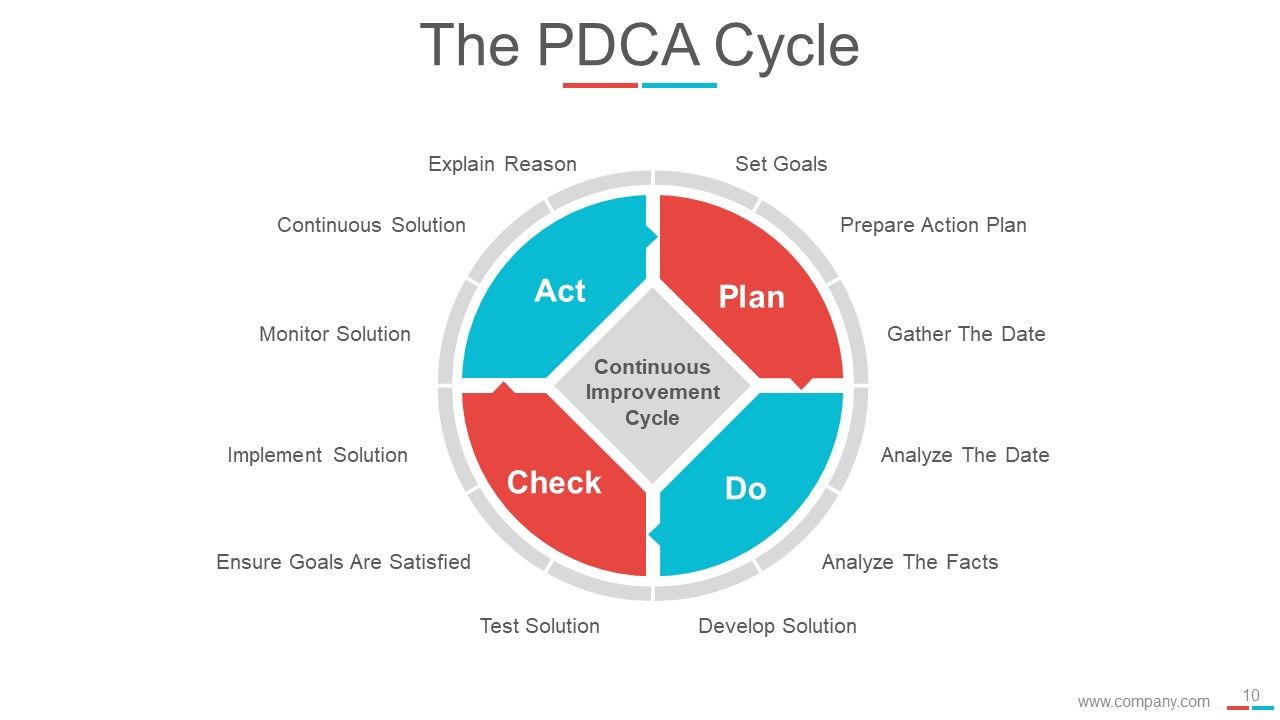
Slide 10: This slide showcases The PDCA Cycle subheaded as Continuous Improvement Cycle divided into- Explain Reason, Set Goals, Prepare Action Plan, Gather The Date, Analyze The Date, Analyze The Facts, Develop Solution, Test Solution, Ensure Goals Are Satisfied, Implement Solution, Monitor Solution, Continuous Solution, Act, Check, Do, Plan.
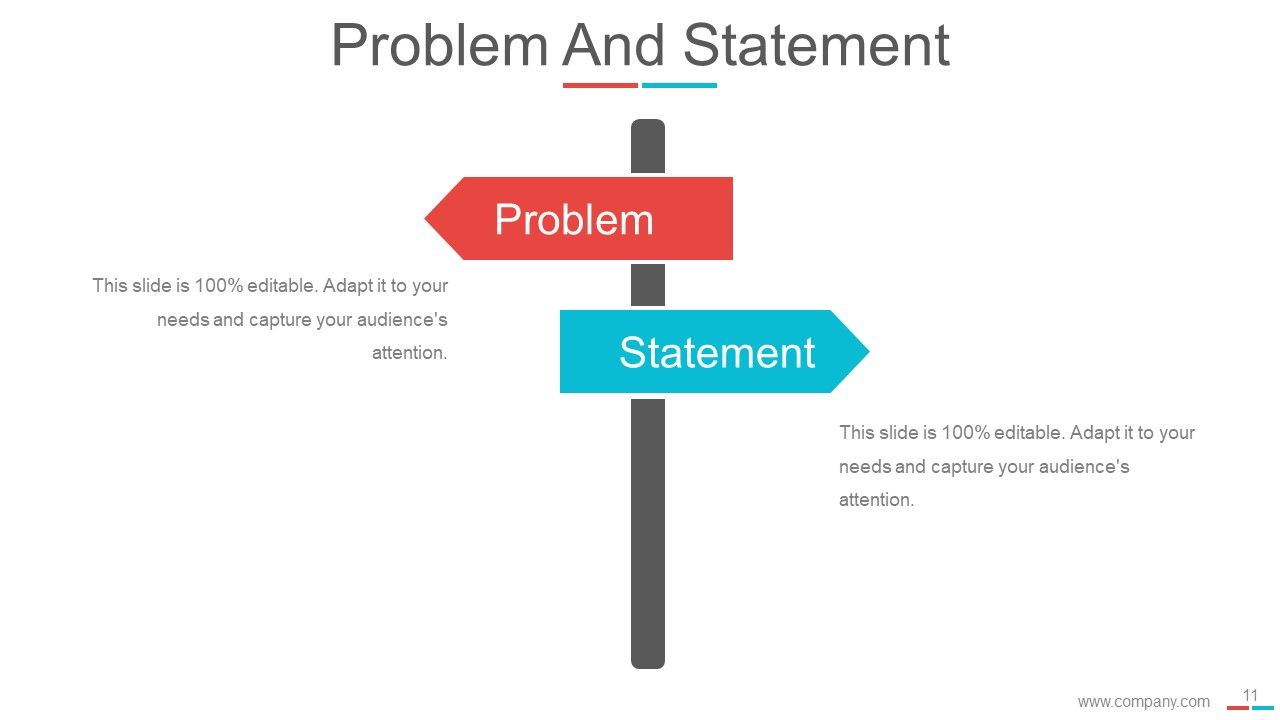
Slide 11: This slide showcases Problem Statement stating- Statement and Problem.
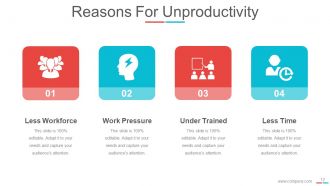
Slide 12: This slide showcases Reasons For Unproductivity such as- Less Workforce, Work Pressure, Under Trained, Less Time.
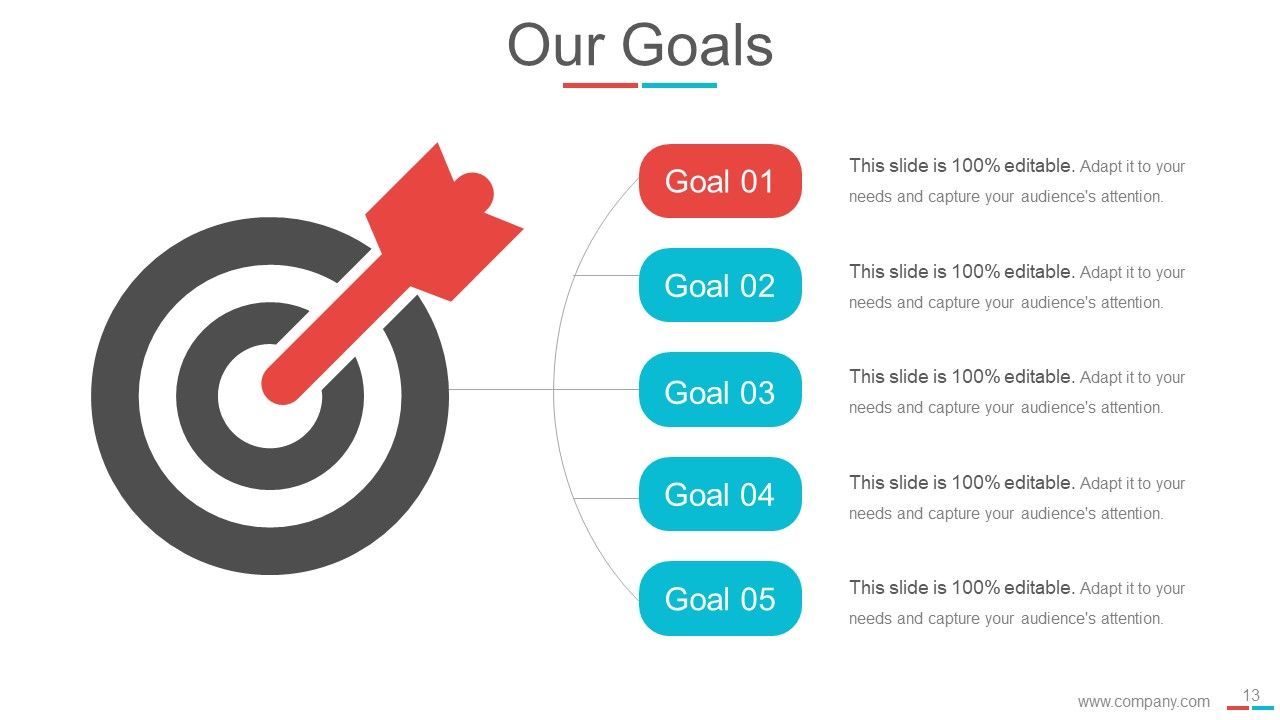
Slide 13: This is Our Goal slide. State your goals here.
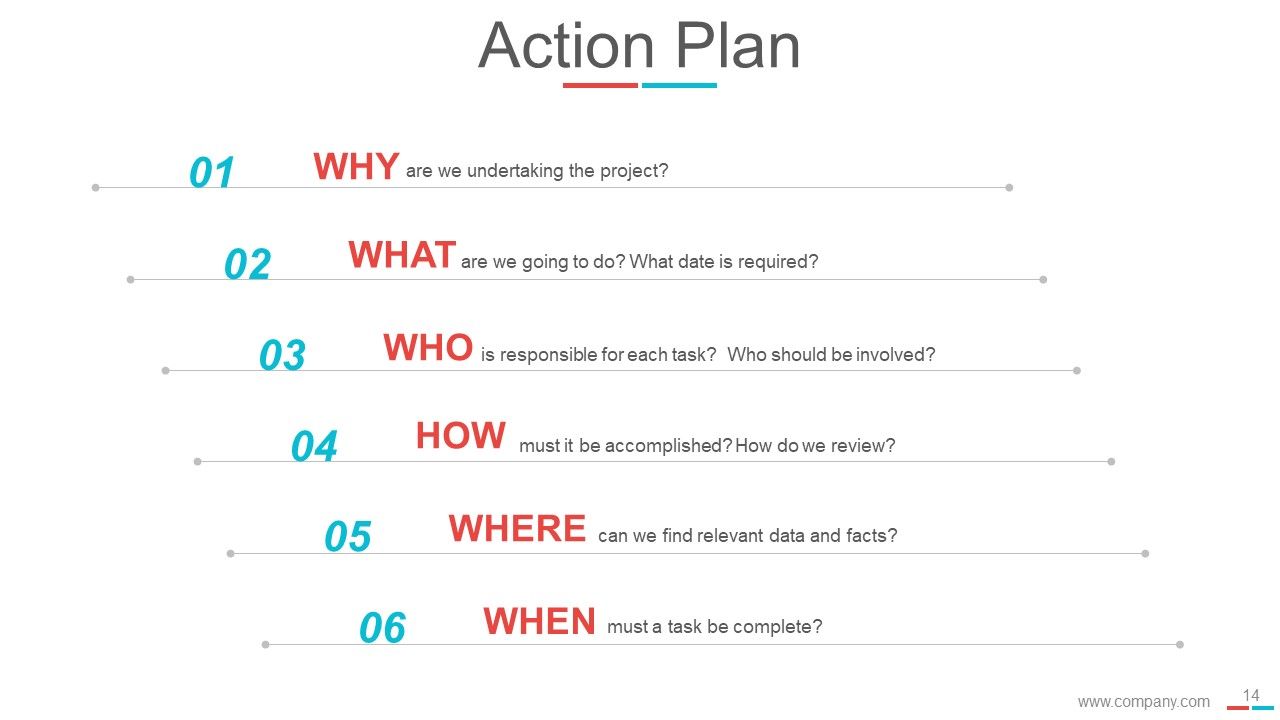
Slide 14: This slide showcases an Action Plan with- WHY are we undertaking the project. WHAT are we going to do? What date is required. WHO is responsible for each task? Who should be involved? HOW must it be accomplished? How do we review? WHERE can we find relevant data and facts? WHERE must a task be complete
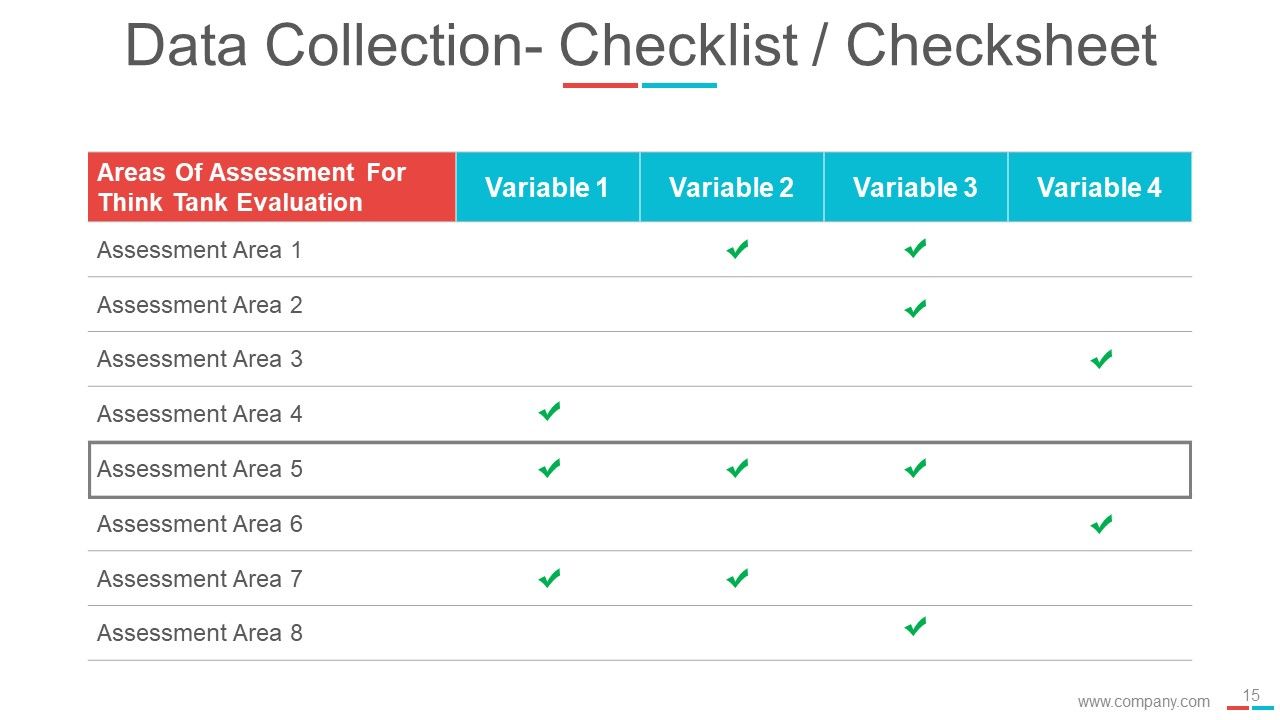
Slide 15: This slide presents Data Collection- Checklist/ Checksheet.
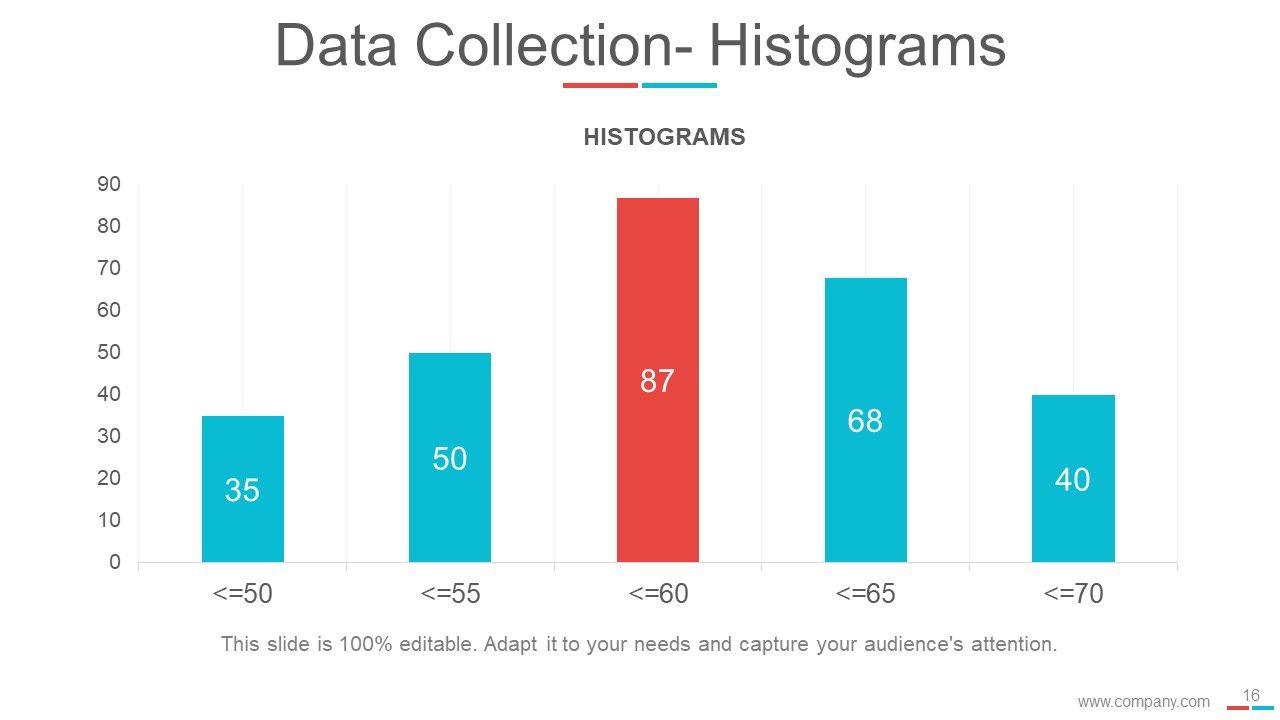
Slide 16: This slide presents Data Collection- Histograms.
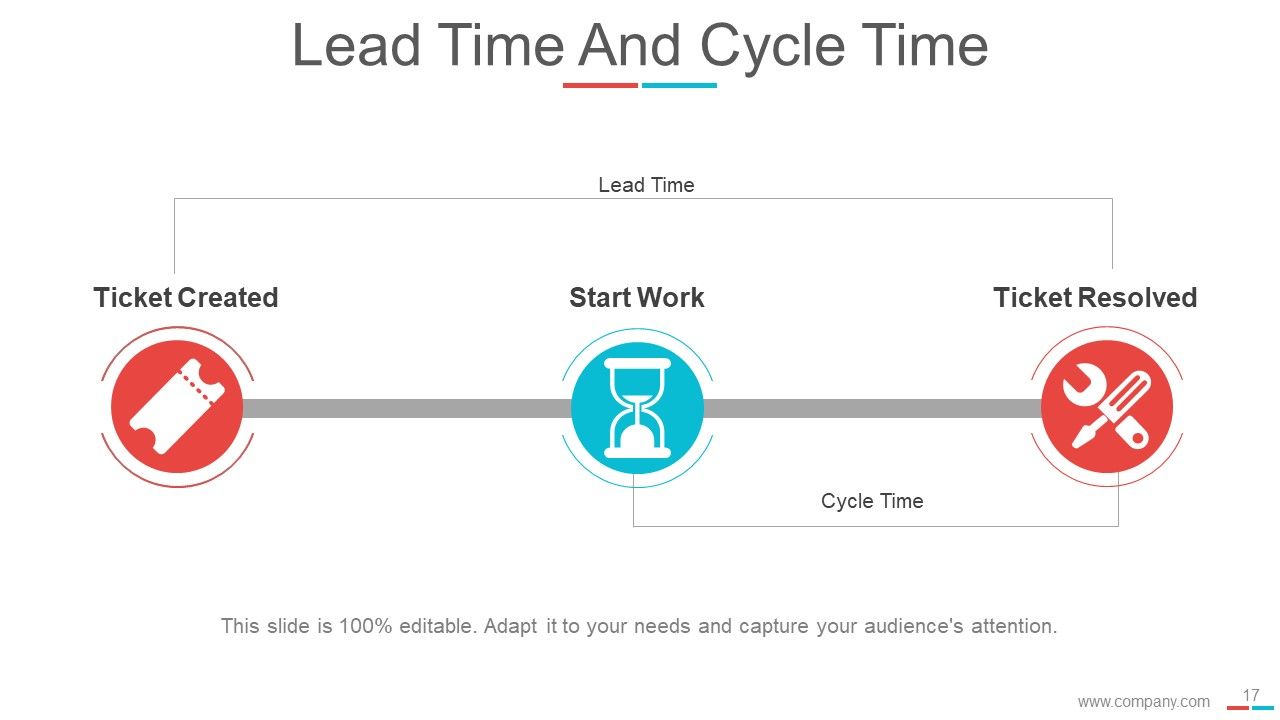
Slide 17: This slide showcases Lead Time And Cycle Time showing- Ticket Created, Ticket Resolved, Cycle Time, Lead Time, Start Work.
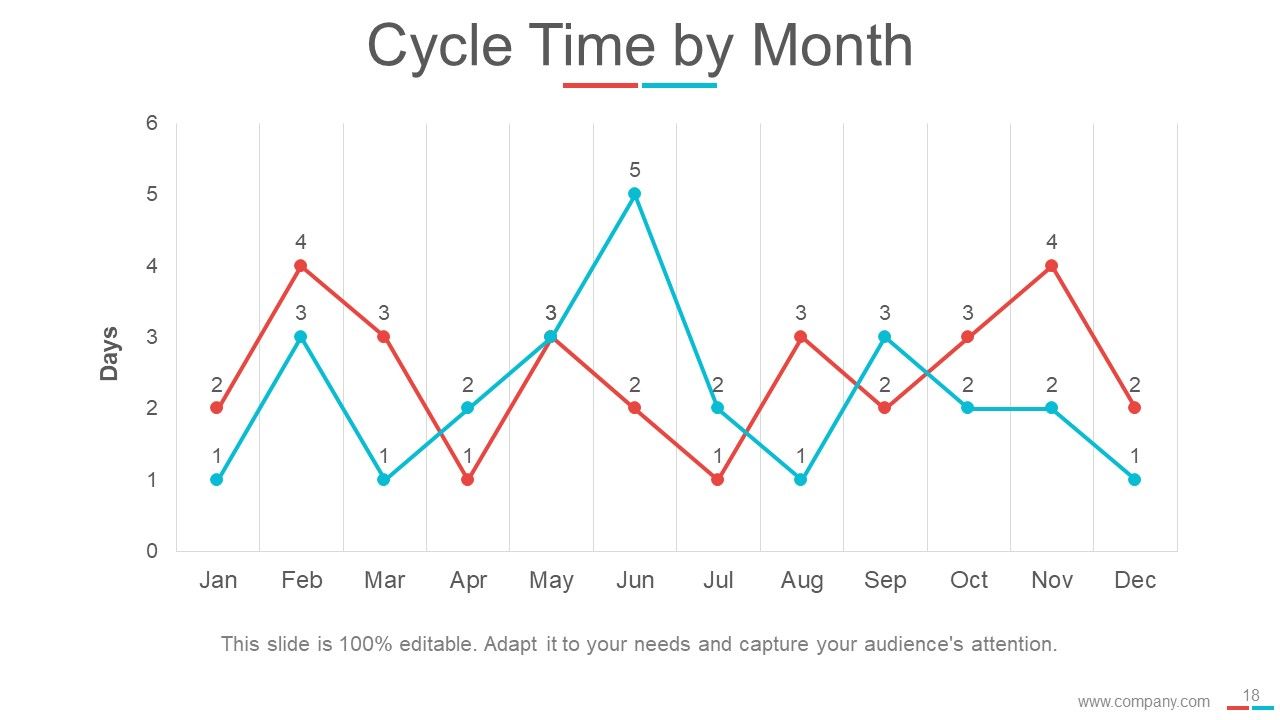
Slide 18: This slide showcases Cycle Time By Month in graph form.
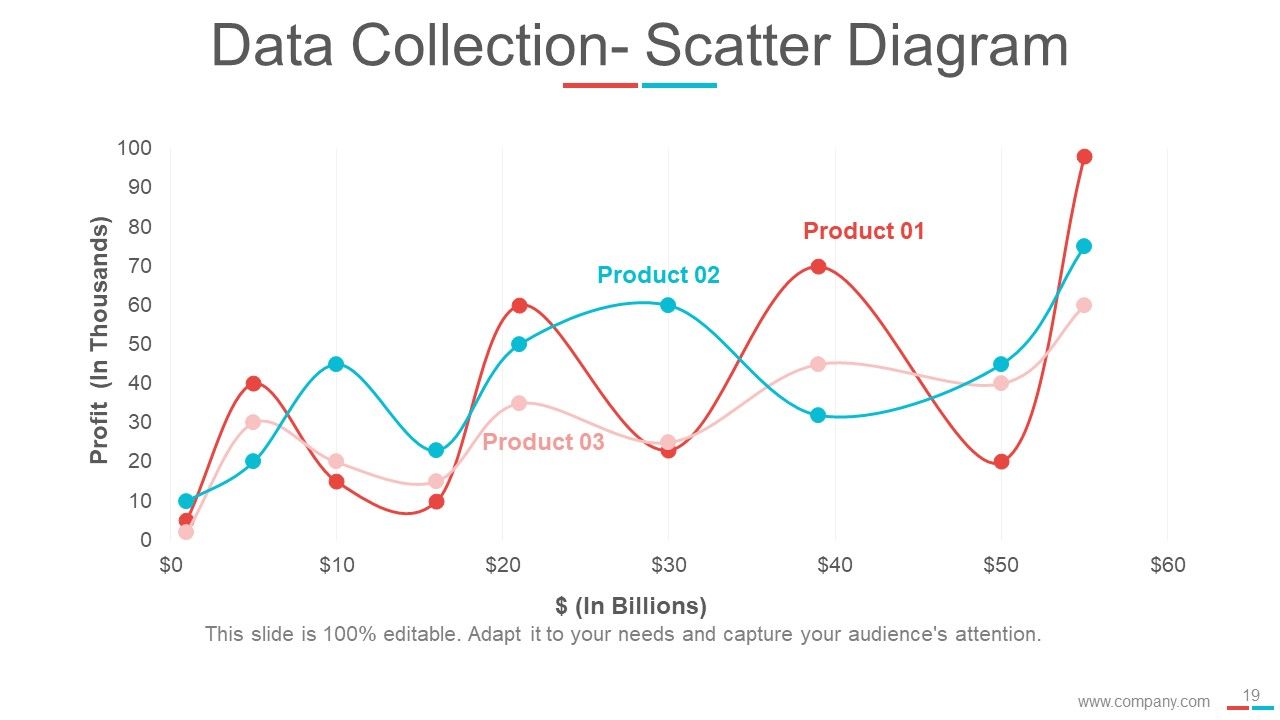
Slide 19: This is a Data Collection- Scatter Diagram.
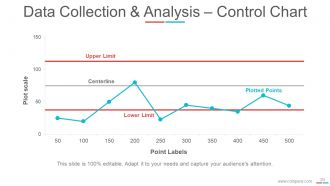
Slide 20: This slide presents Data Collection & Analysis- Control Chart displaying- Centerline, Upper Limit, Plotted Points, Lower Limit.
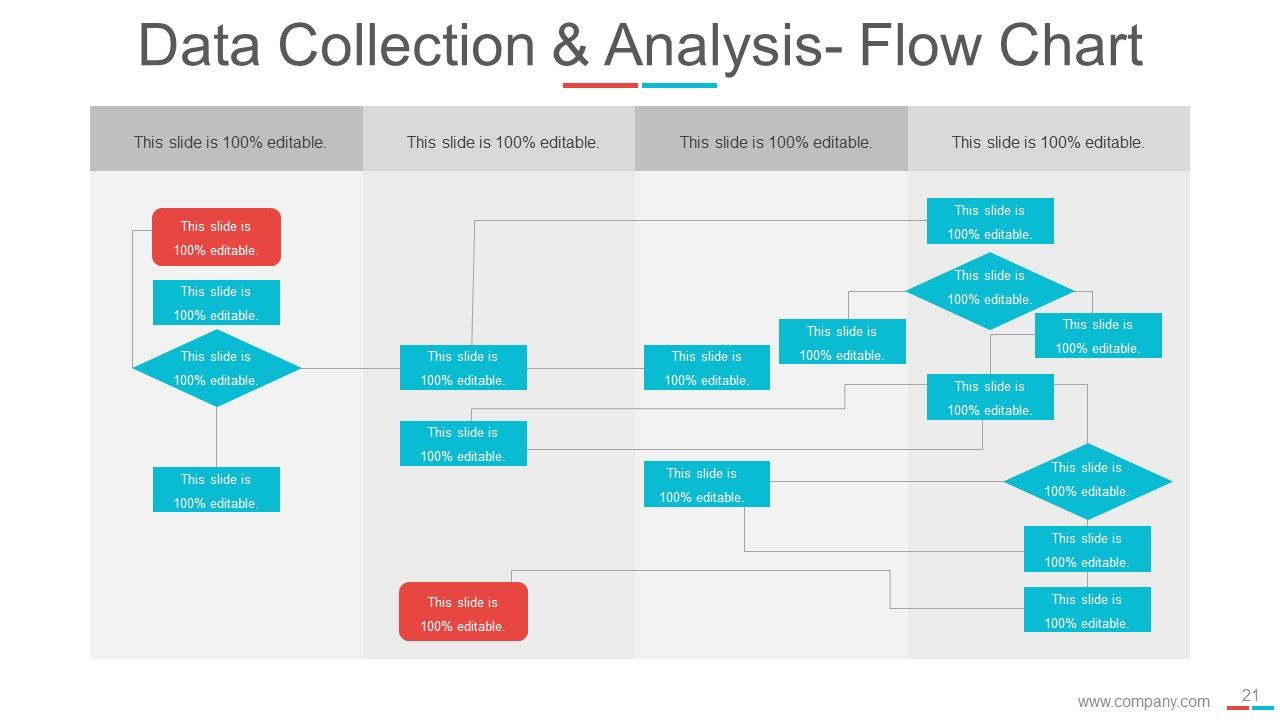
Slide 21: This slide shows Data Collection & Analysis- Flow Chart.
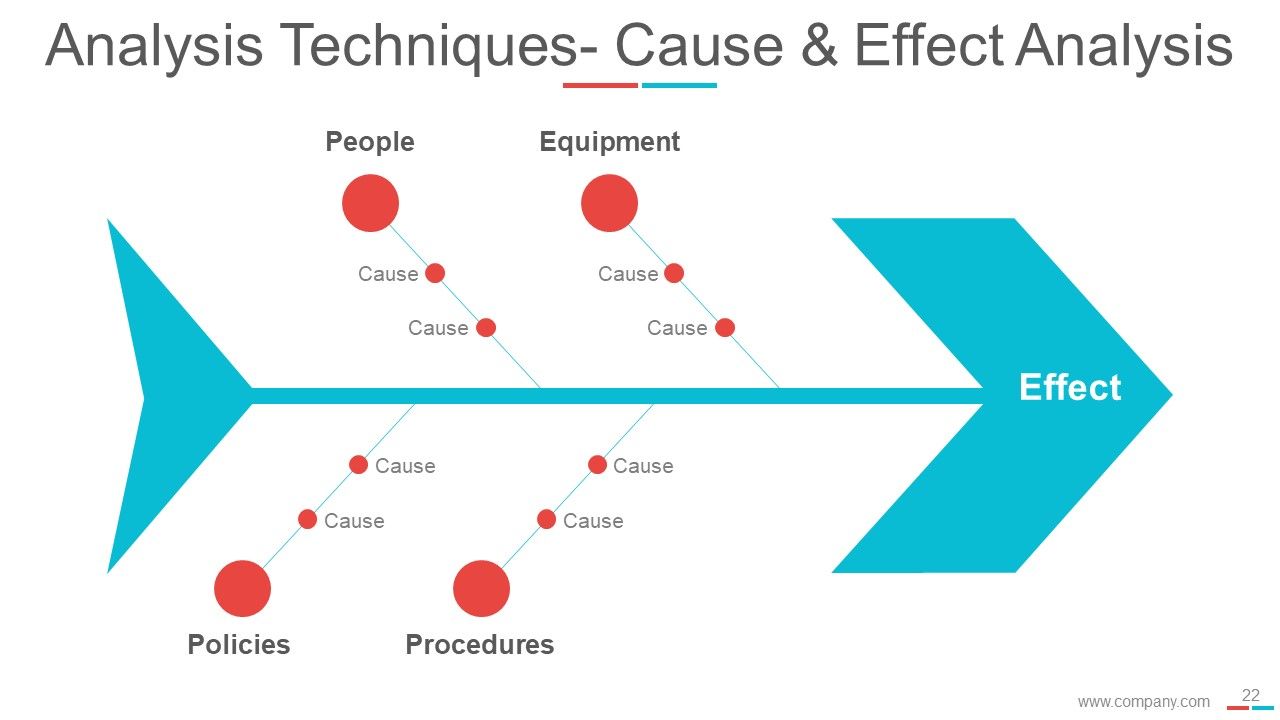
Slide 22: This slide presents Analysis Techniques- Cause & Effect Analysis People, Equipment, Policies, Procedures, Cause.
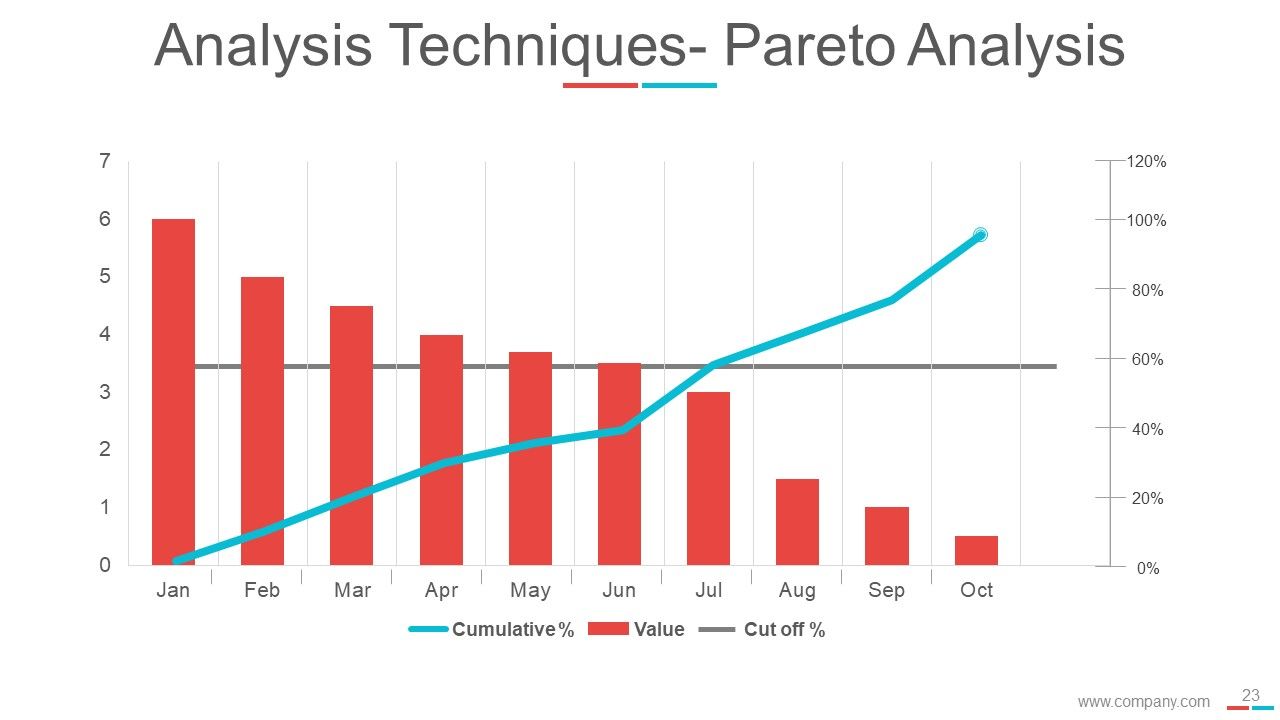
Slide 23: This is an Analysis Techniques- Pareto Analysis slide.
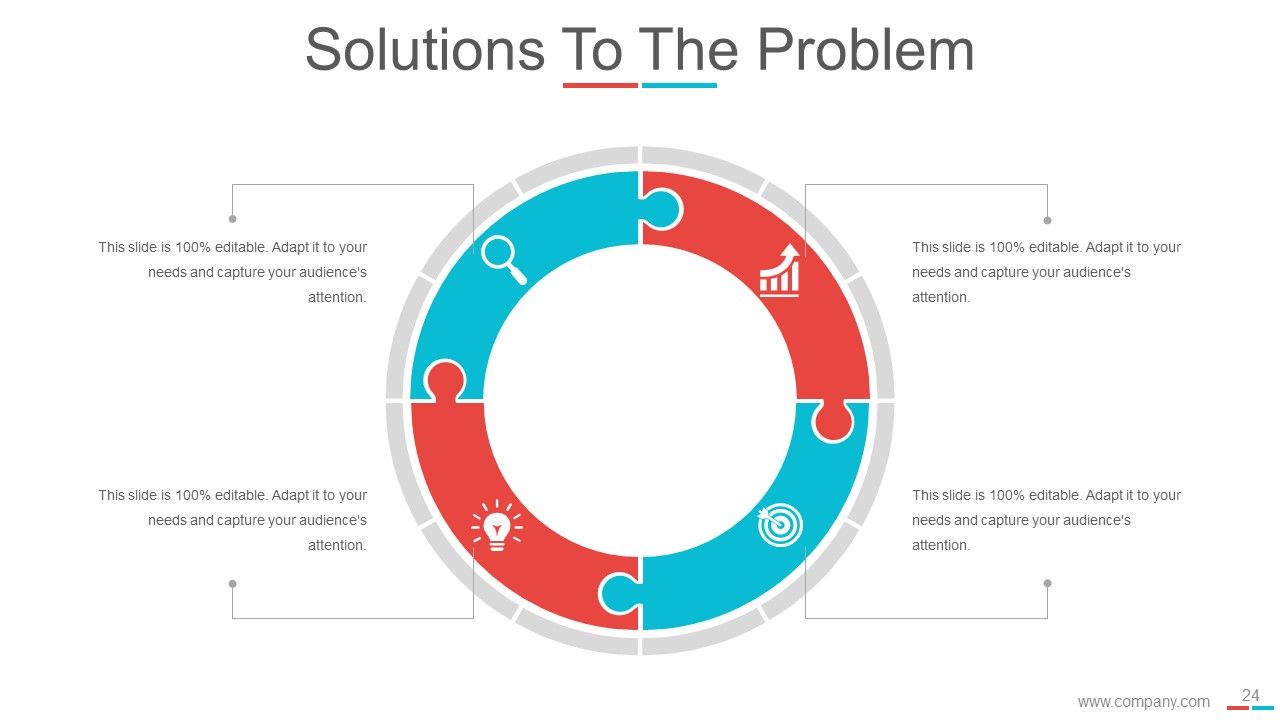
Slide 24: This slide shows Solutions to Problems provided.
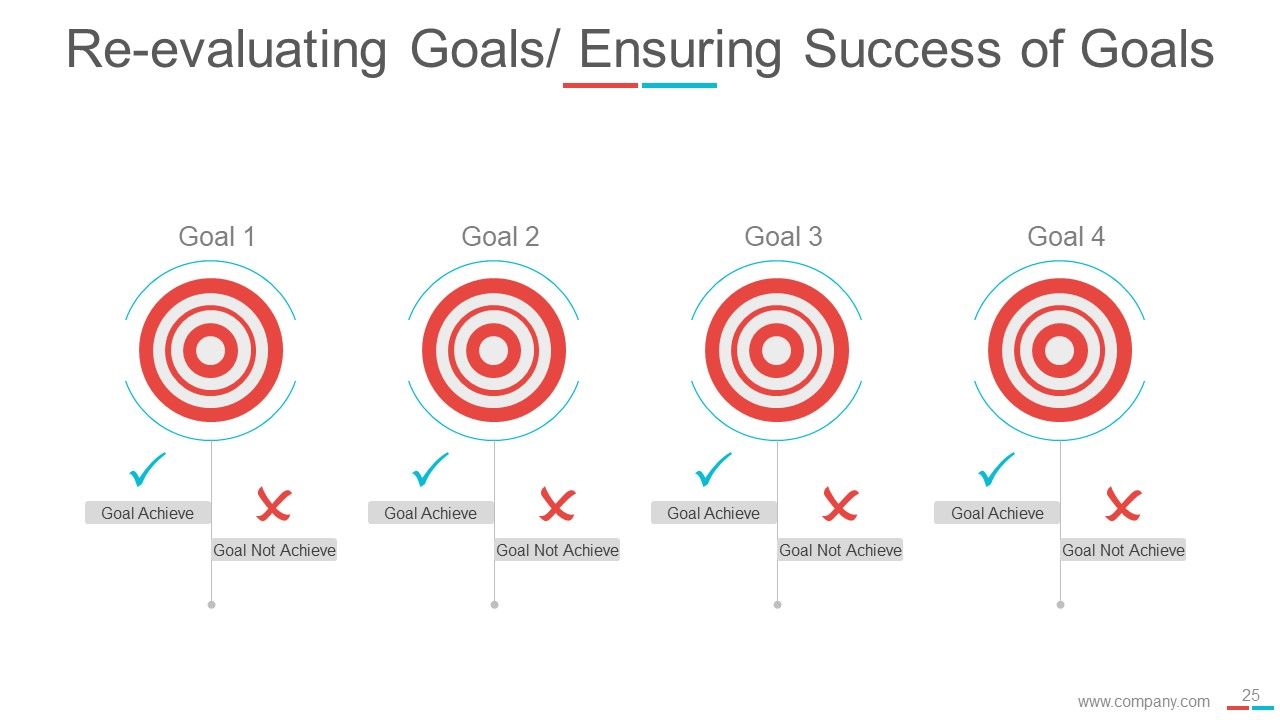
Slide 25: This slide showcases Re-evaluating ensuring success of goals.
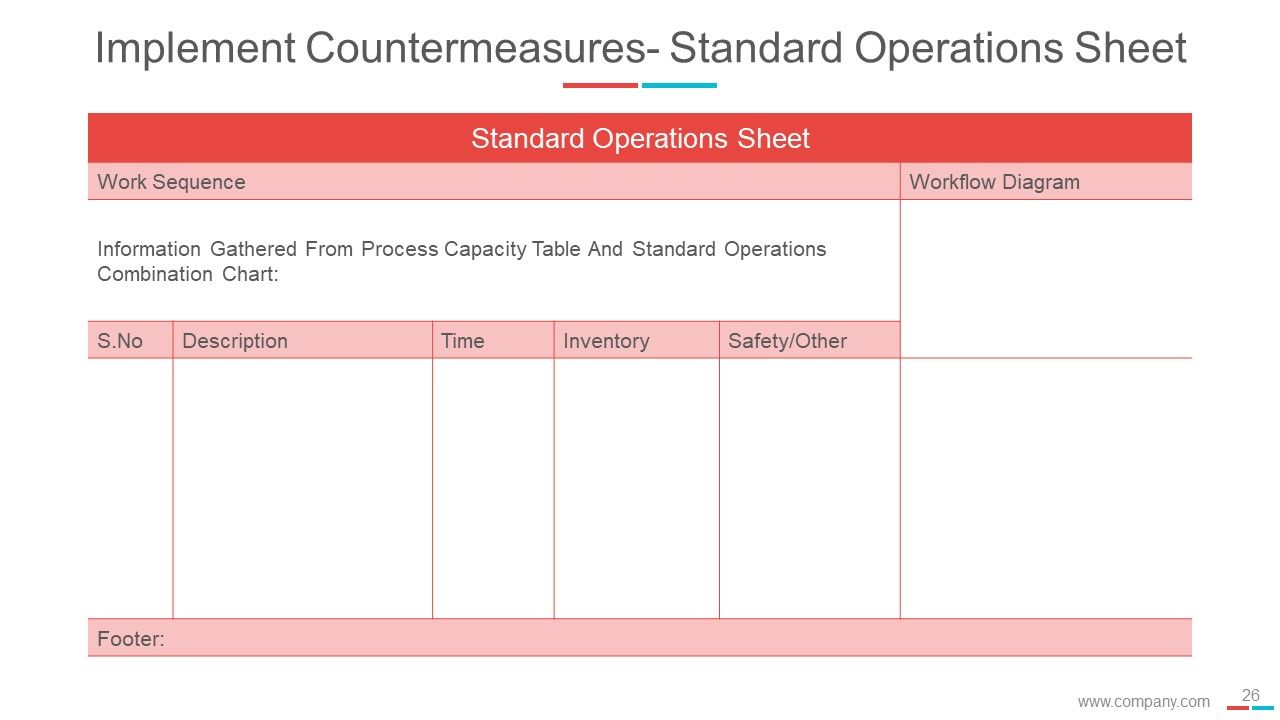
Slide 26: This is an Implement Countermeasures- Standard Operating Sheet slide.
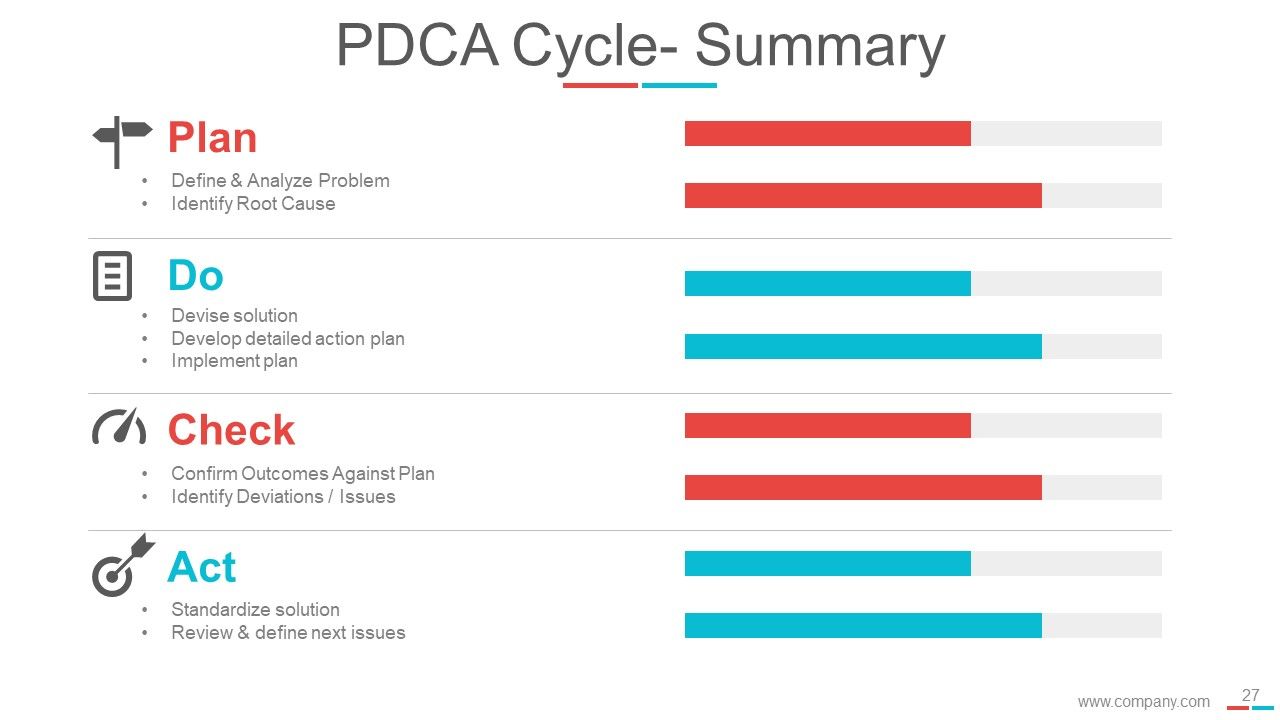
Slide 27: This is a PDCA Cycle- Summary slide with Plan, Do, Check and Act. Plan: Define & Analyze Problem, Identify Root Cause. Do: Devise solution, Develop detailed action plan, Implement plan. Check: Confirm Outcomes Against Plan, Identify Deviations / Issues. Act: Standardize solution, Review & define next issues.
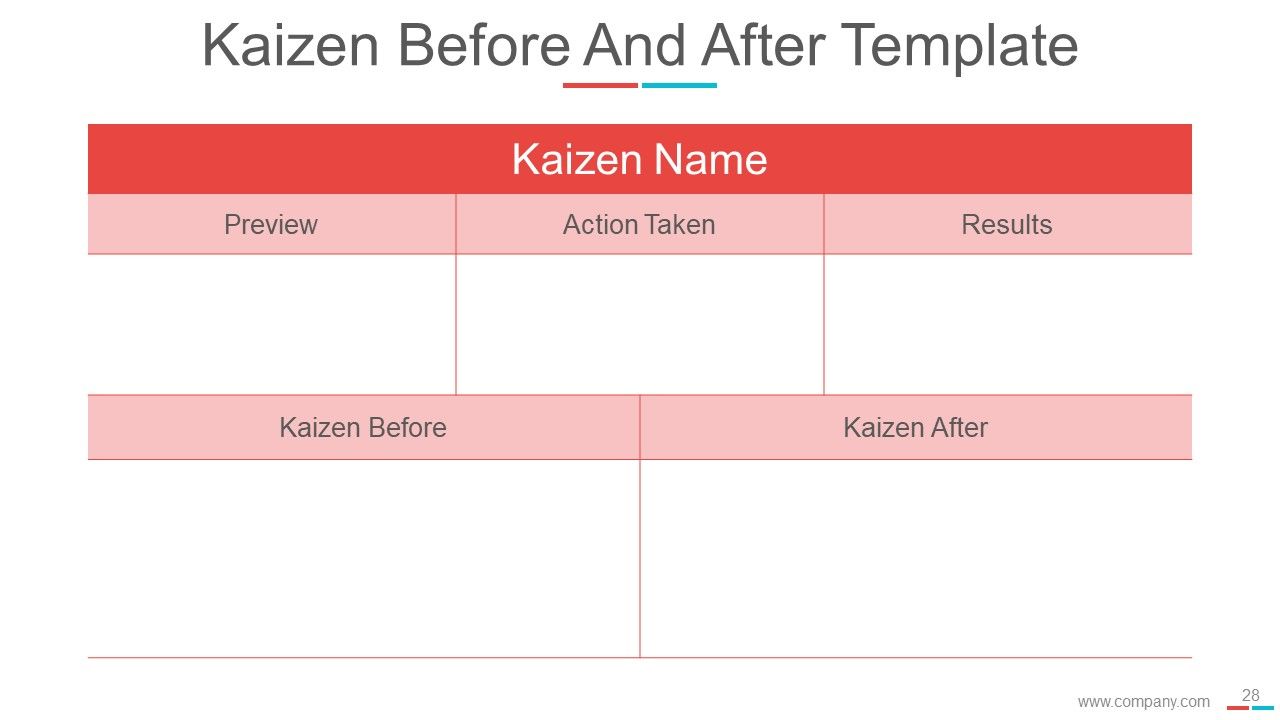
Slide 28: This is a Kaizen Before And After Template slide.
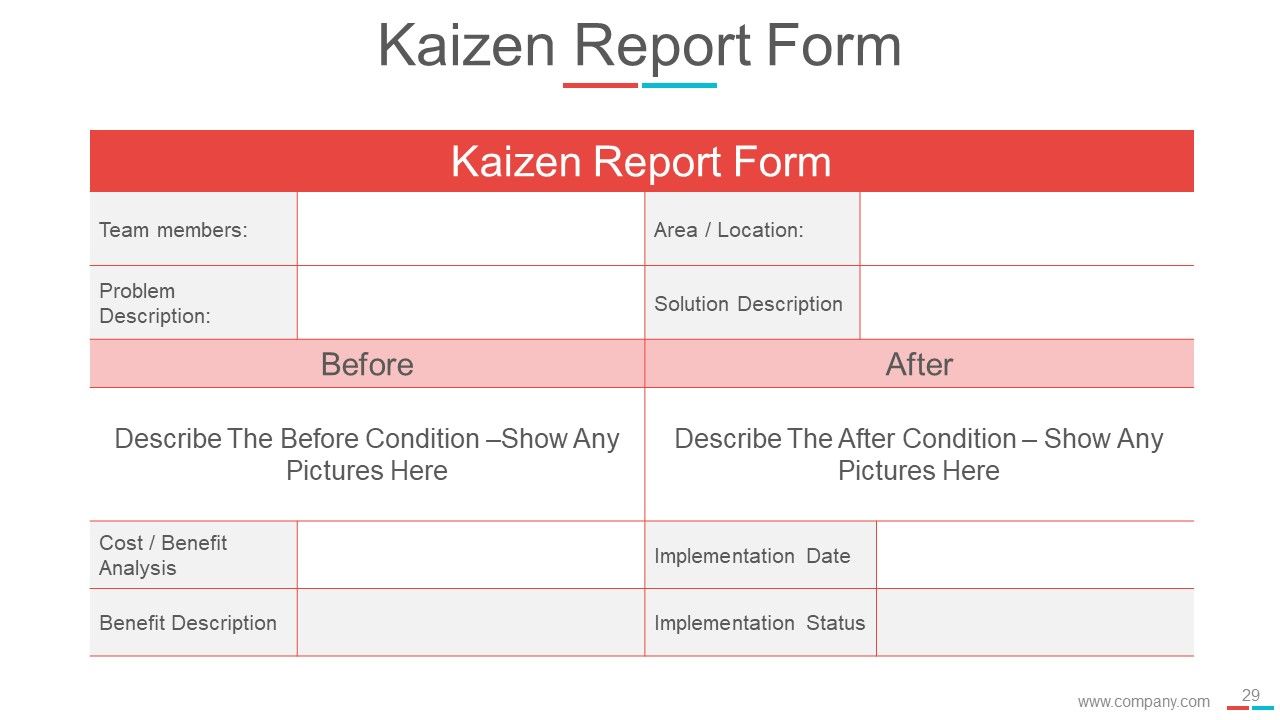
Slide 29: This is a Kaizen Report Form slide.
Slide 30: This is a Coffee Break image slide to halt. You can change the slide content as per need.
Slide 31: This is a Bar Chart slide to show information, comparison, specifications etc.
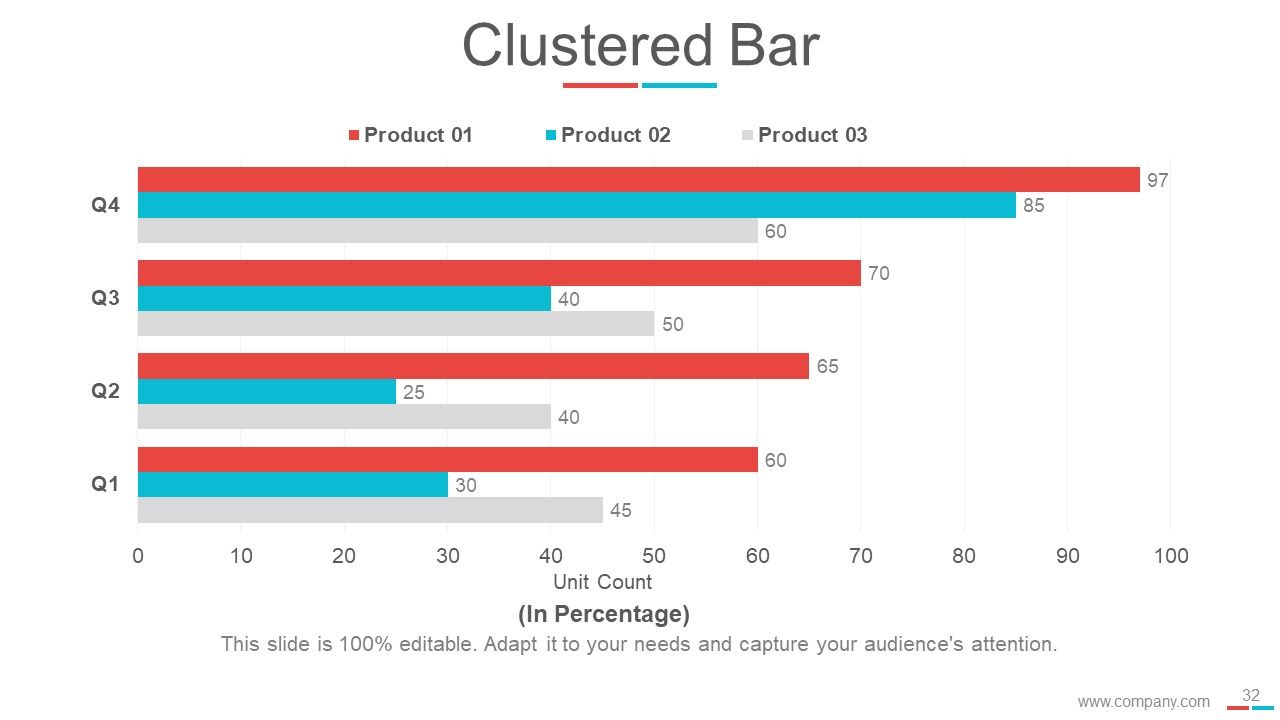
Slide 32: This slide presents a Clustered Chart for showcasing product/company growth, comparison, specifications etc.
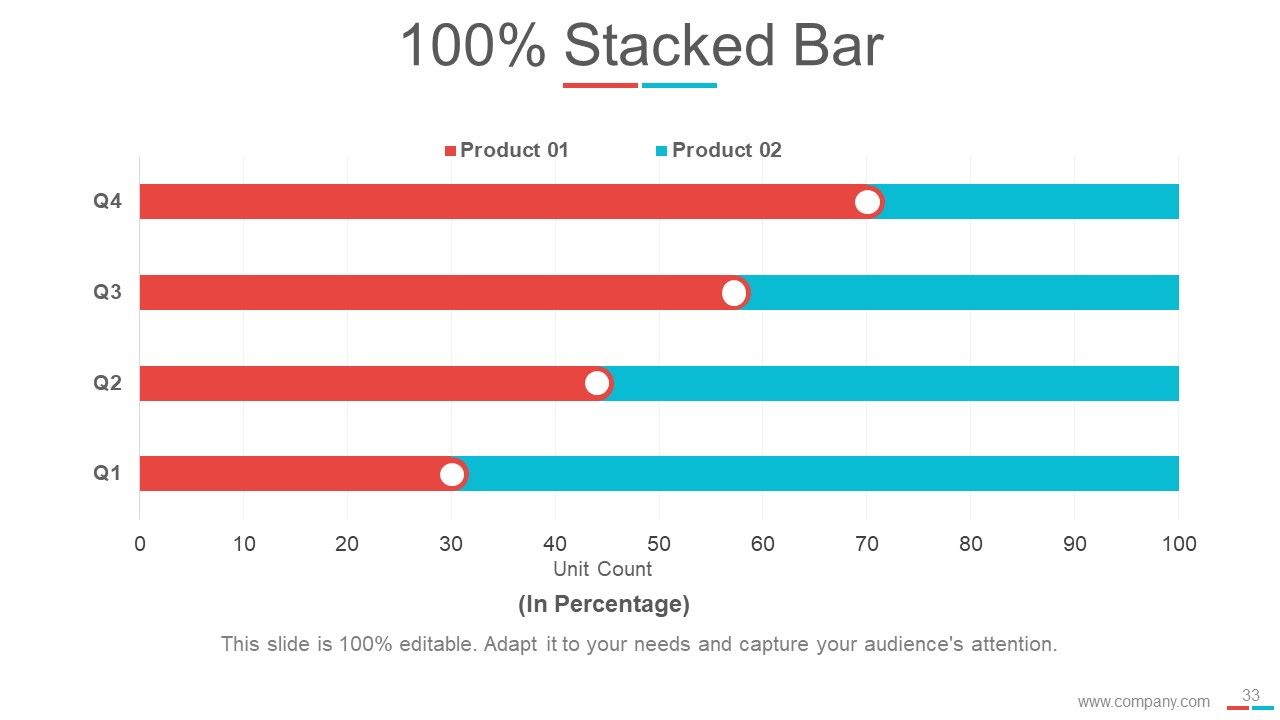
Slide 33: This slide presents a Stacked Bar Chart for showcasing product/company growth, comparison, specifications etc.
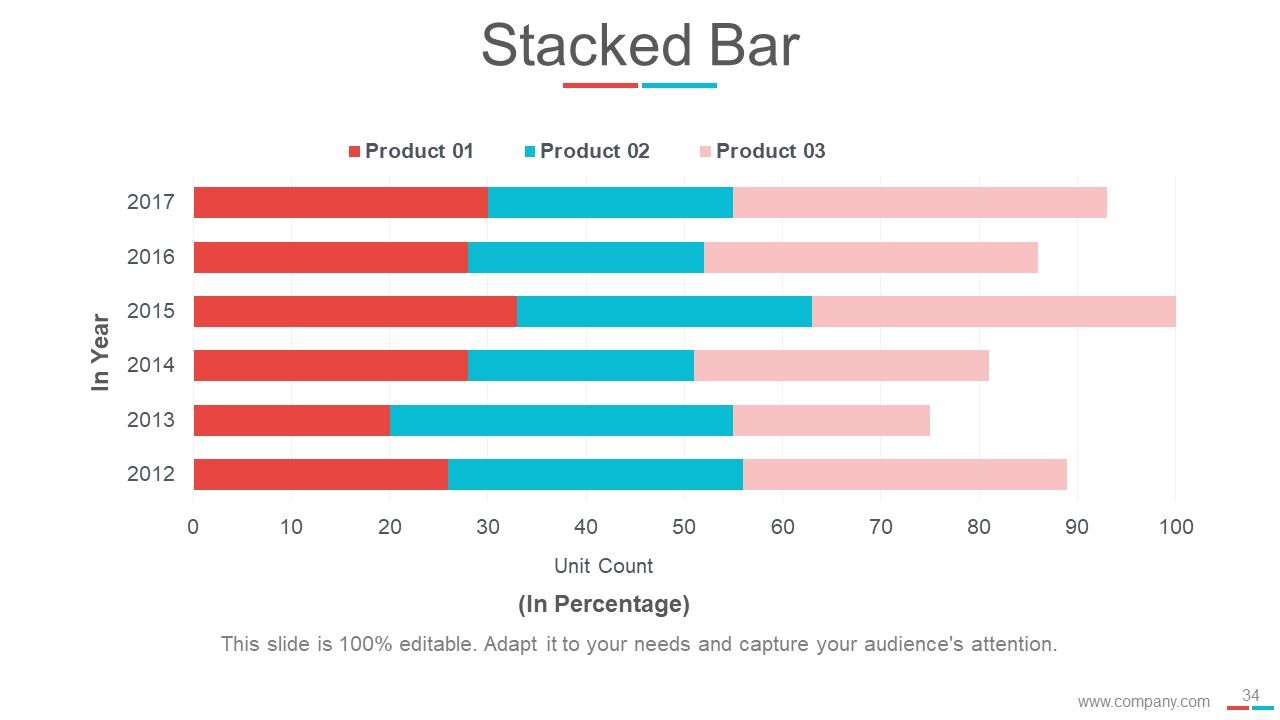
Slide 34: This slide also presents a Stacked Bar Chart for showcasing product/company growth, comparison, specifications etc.
Slide 35: This slide is titled Pie Chart to move forward to pie chart like slides.
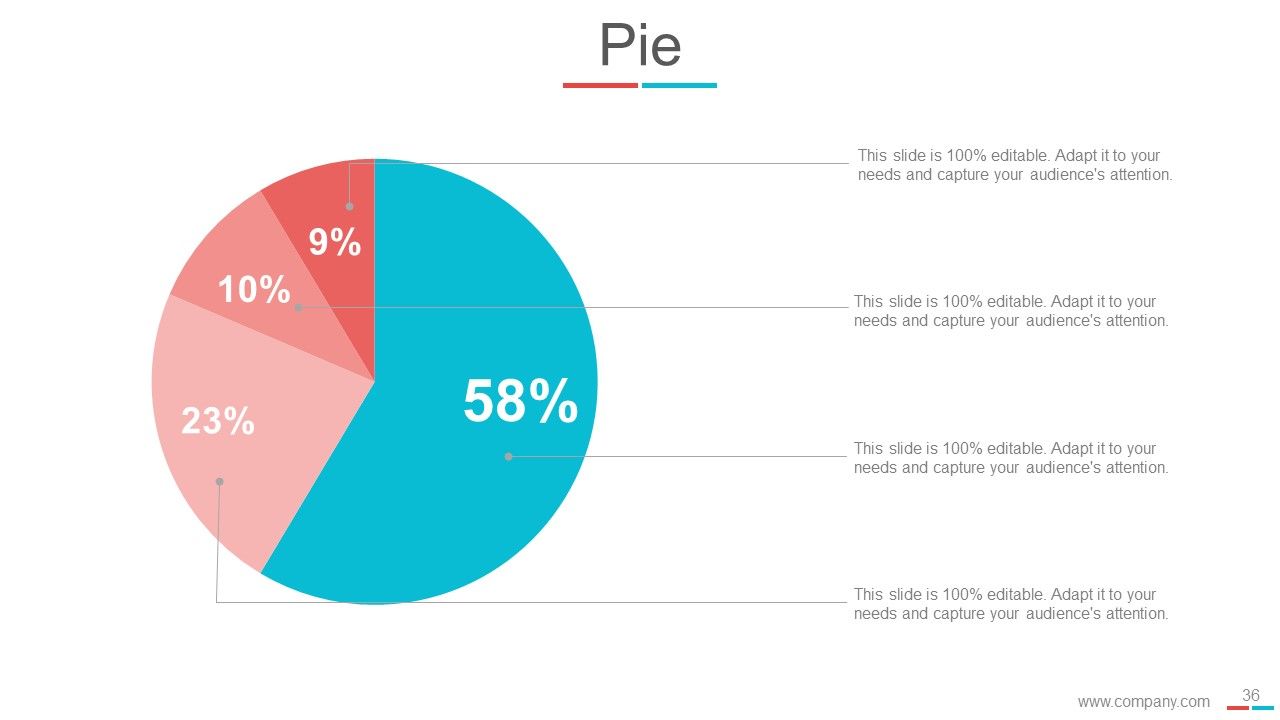
Slide 36: This slide presents a Pie Chart for showcasing product/company growth, comparison, specifications etc.
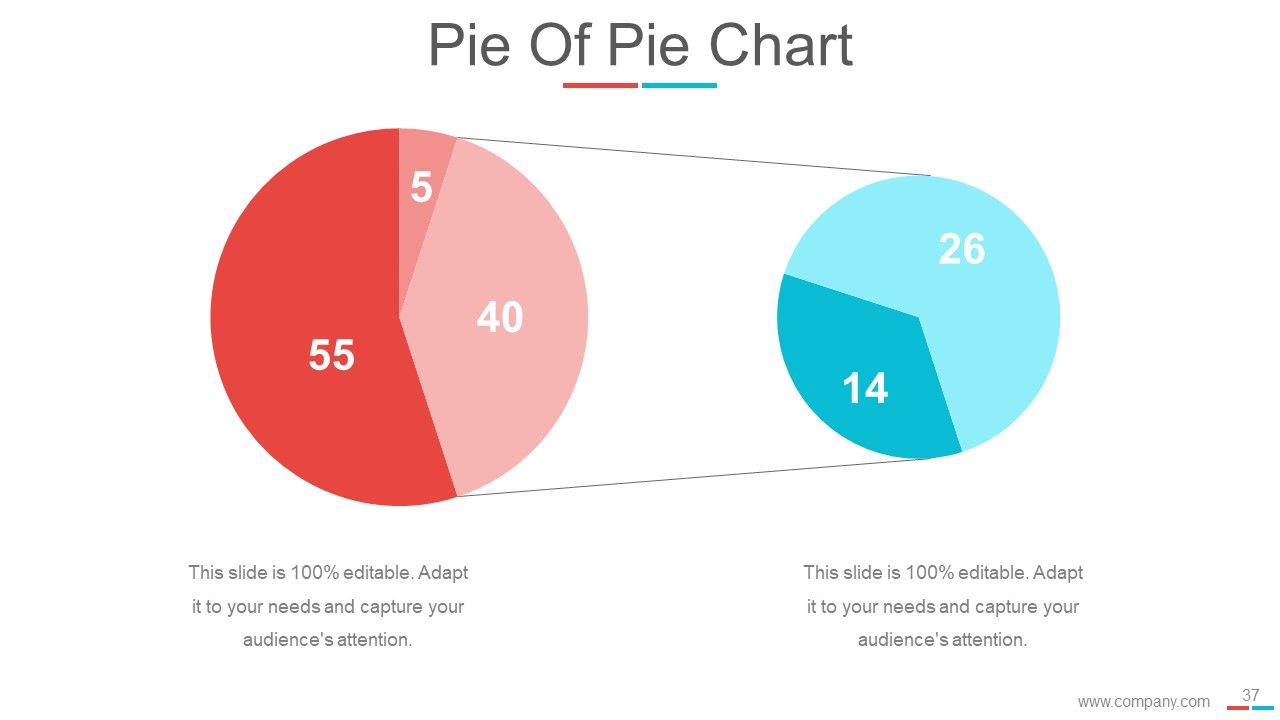
Slide 37: This slide presents a Pie of Pie Chart for showcasing product/company growth, comparison, specifications etc.
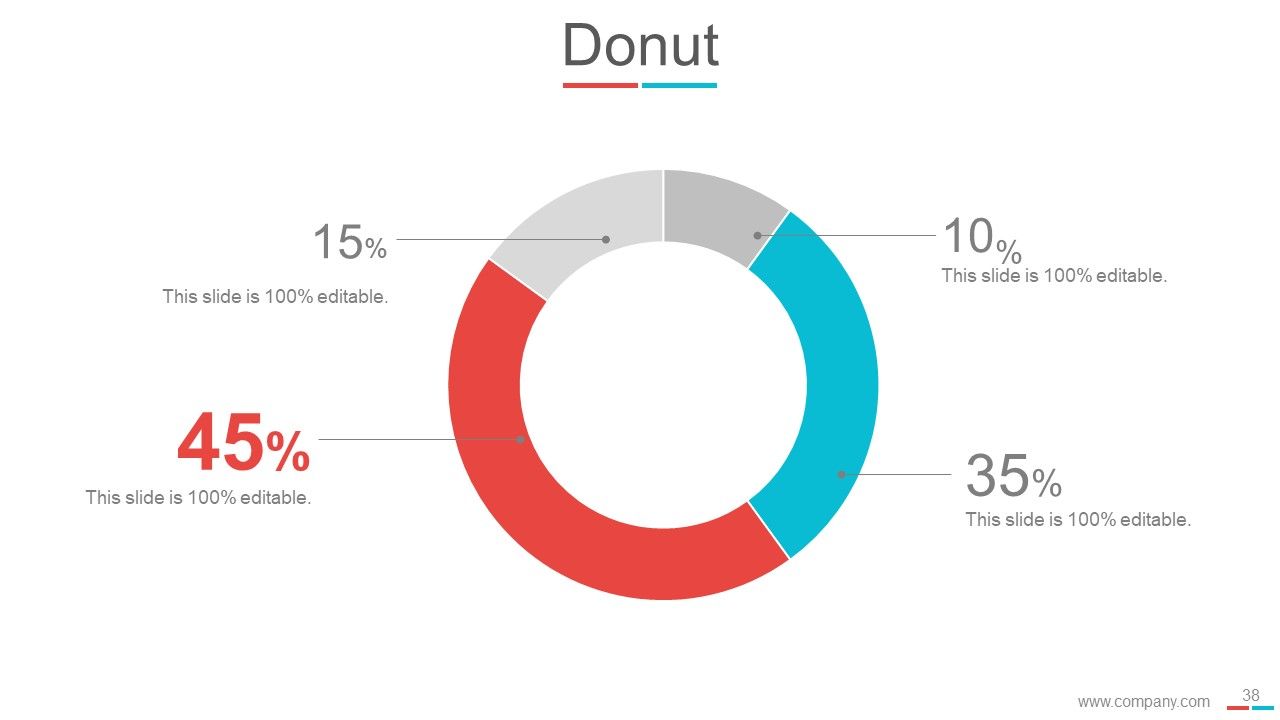
Slide 38: This slide presents a Donut Pie Chart for showcasing product/company growth, comparison, specifications etc.
Slide 39: This slide is titled Stacked Column to move forward to stacked chart like slides.
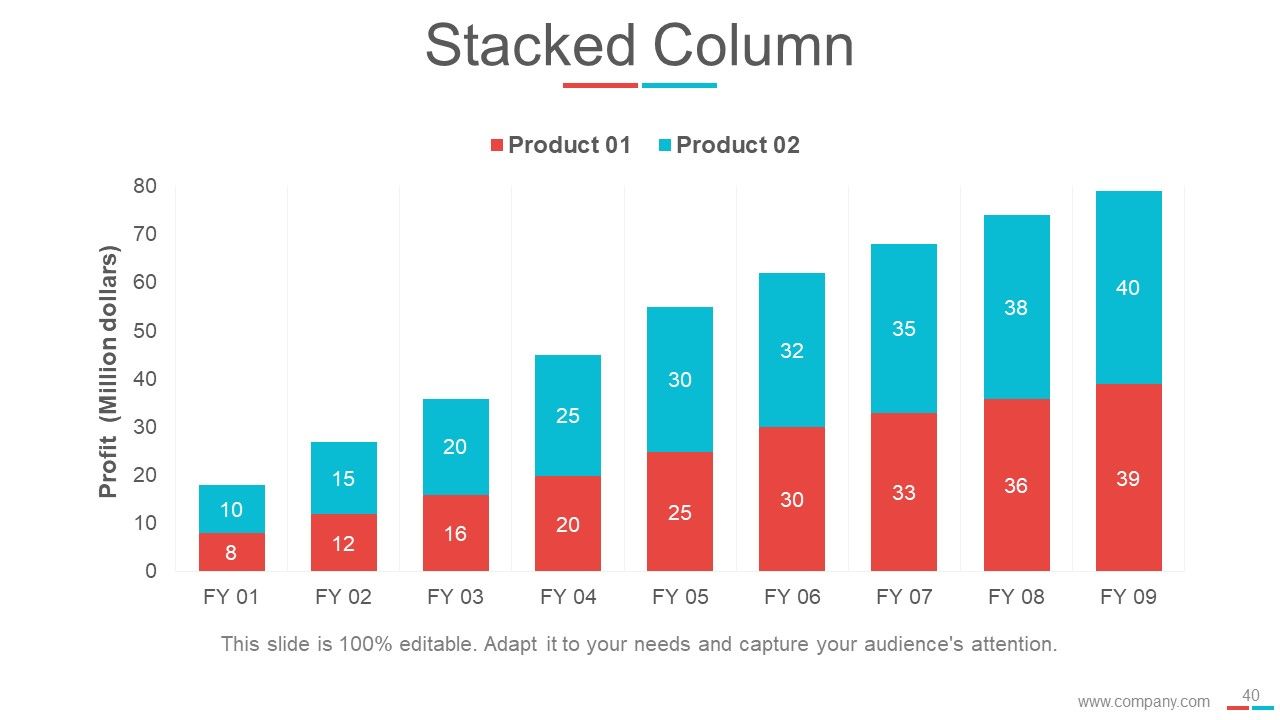
Slide 40: This slide presents a Stacked Column Chart for showcasing product/company growth, comparison, specifications etc.
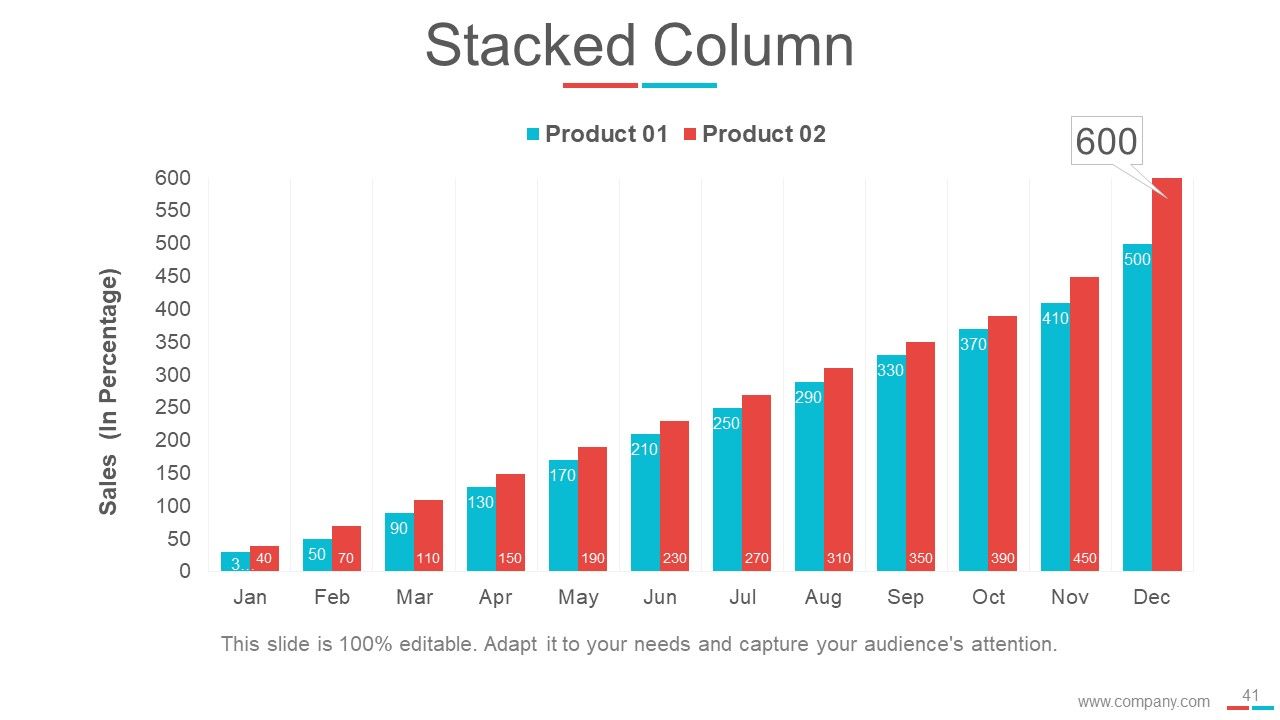
Slide 41: This slide presents a Stacked Column Chart for showcasing product/company growth, comparison, specifications etc.
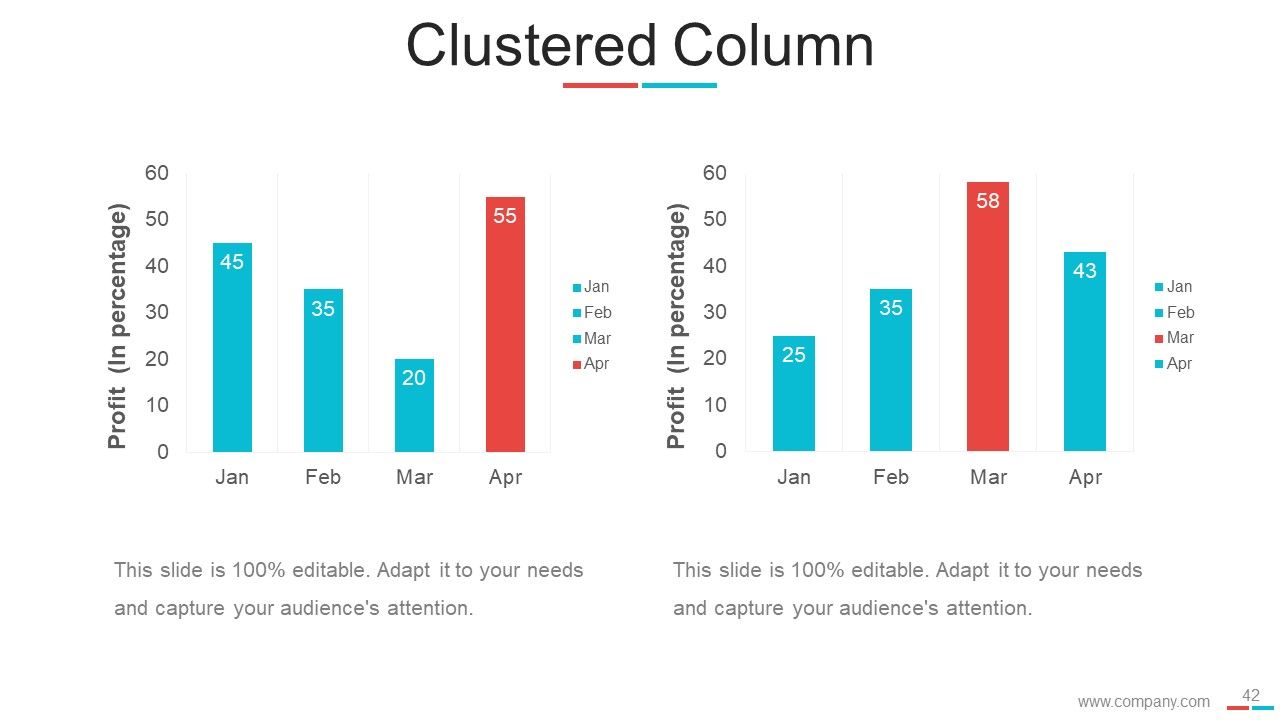
Slide 42: This slide presents a Clustered Column graph for showcasing product/company growth, comparison, specifications etc.
Slide 43: This slide is titled Scatter Area to move forward to scatter charts.
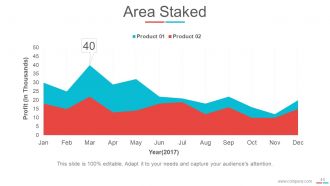
Slide 44: This slide presents an Area Stacked Chart for showcasing product/company growth, comparison, specifications etc.
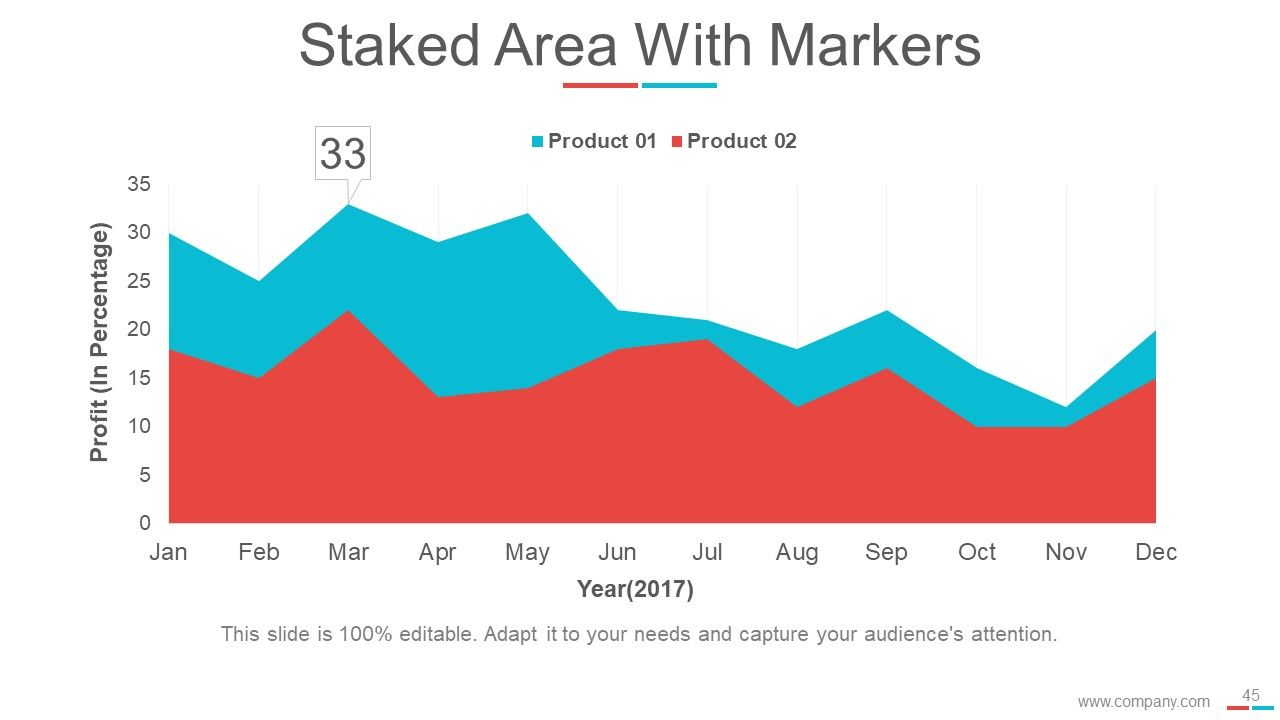
Slide 45: This slide presents Stacked Area With Markers Chart for showcasing product/company growth, comparison, specifications etc.
Slide 46: This slide is titled Scatter Chart to move forward to scatter charts.
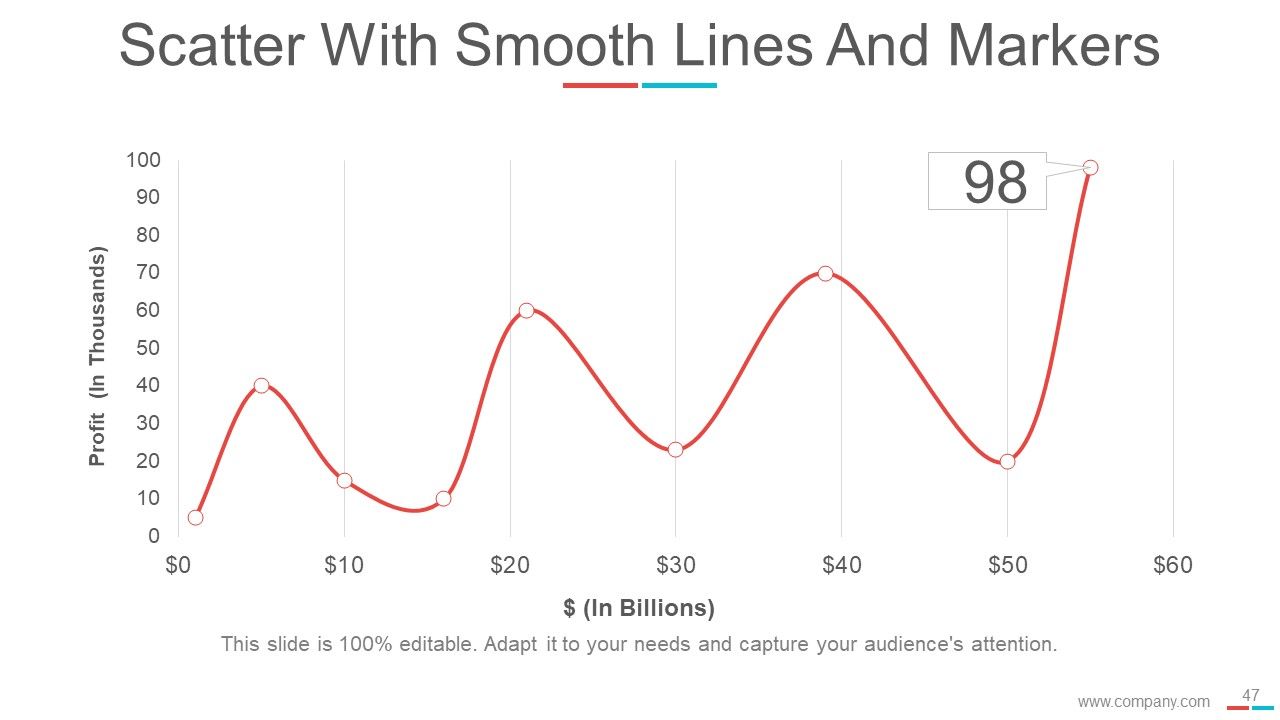
Slide 47: This slide presents Scatter With Smooth Lines And Markers graph for showcasing product/company growth, comparison, specifications etc.
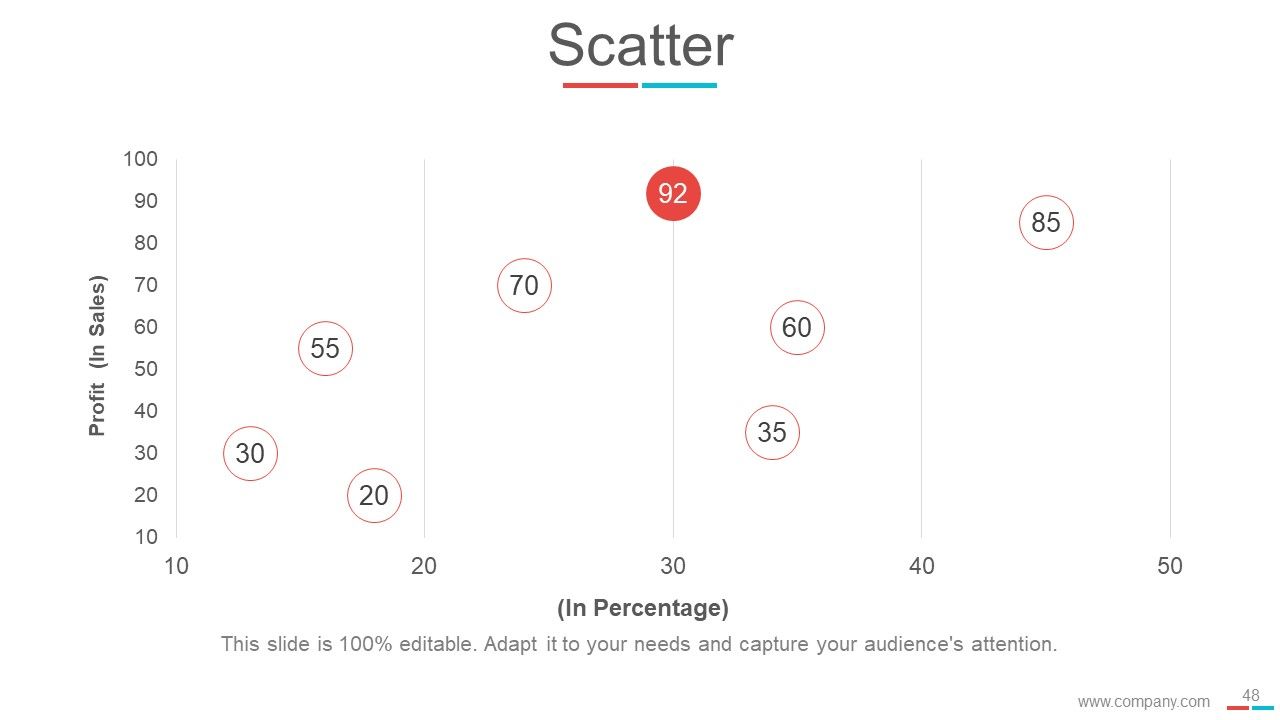
Slide 48: This slide presents a Scatter Chart for showcasing product/company growth, comparison, specifications etc.
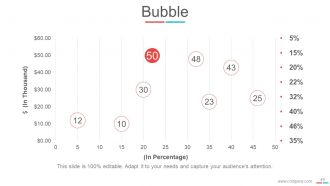
Slide 49: This slide presents a Bubble Chart for showcasing product/company growth, comparison, specifications etc.
Slide 50: This slide is titled Combo Chart to move forward to combo charts.
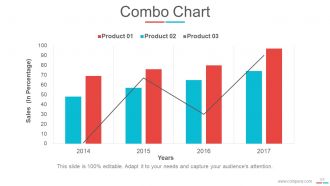
Slide 51: This slide presents Combo Chart for showcasing product/company growth, comparison, specifications etc.
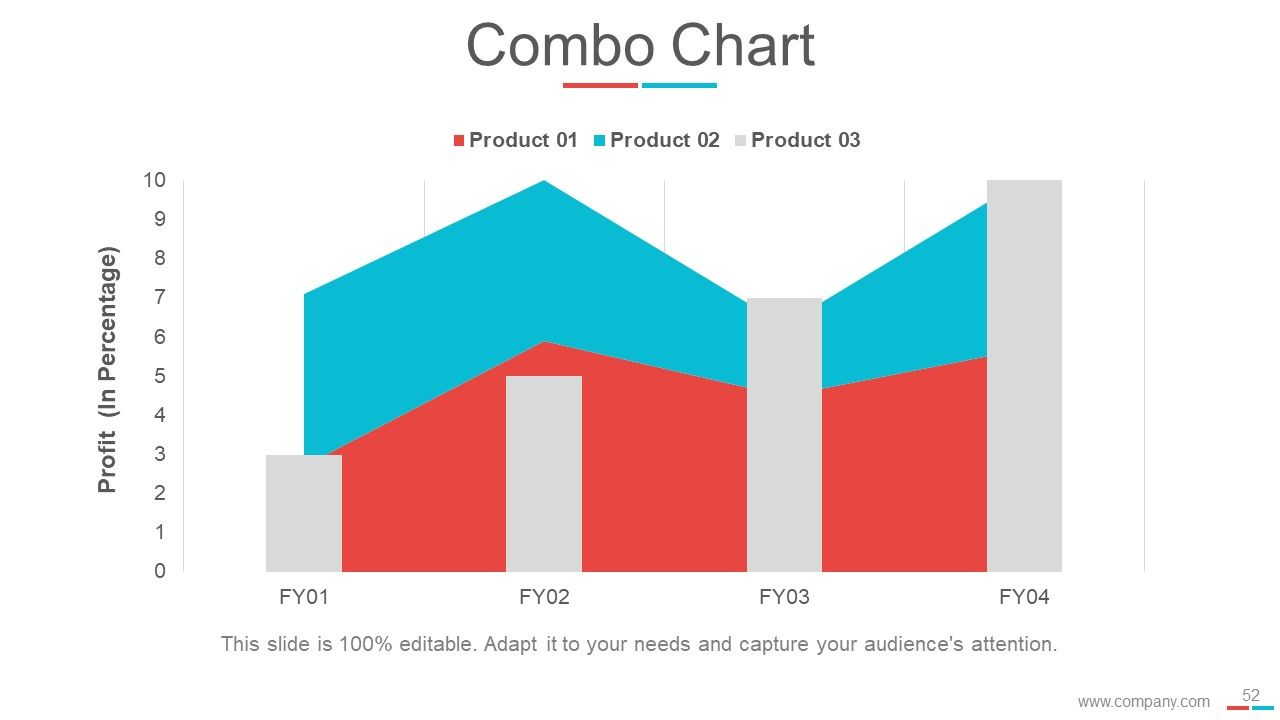
Slide 52: This slide presents Combo Chart for showcasing product/company growth, comparison, specifications etc.
Slide 53: This slide is titled Stacked Line With Markers to move forward to stacked charts.
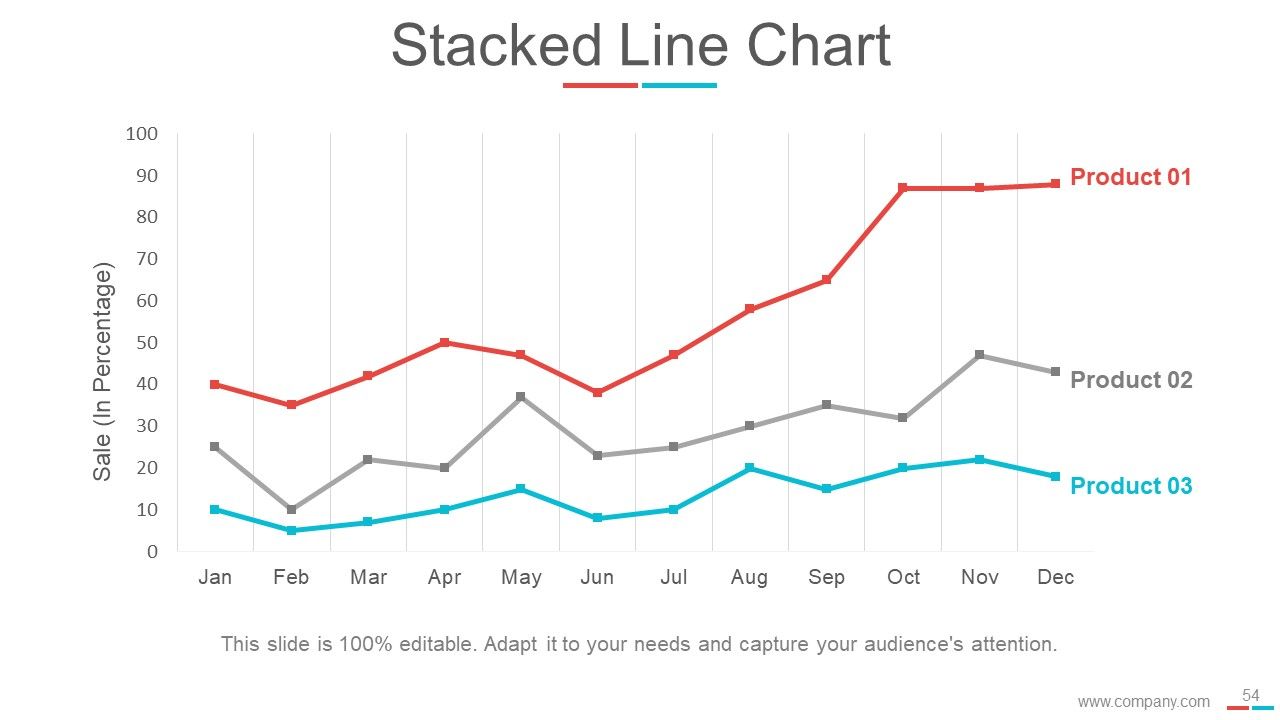
Slide 54: This slide showcases a Stacked Line Chart for showcasing product/company growth, comparison, specifications etc.
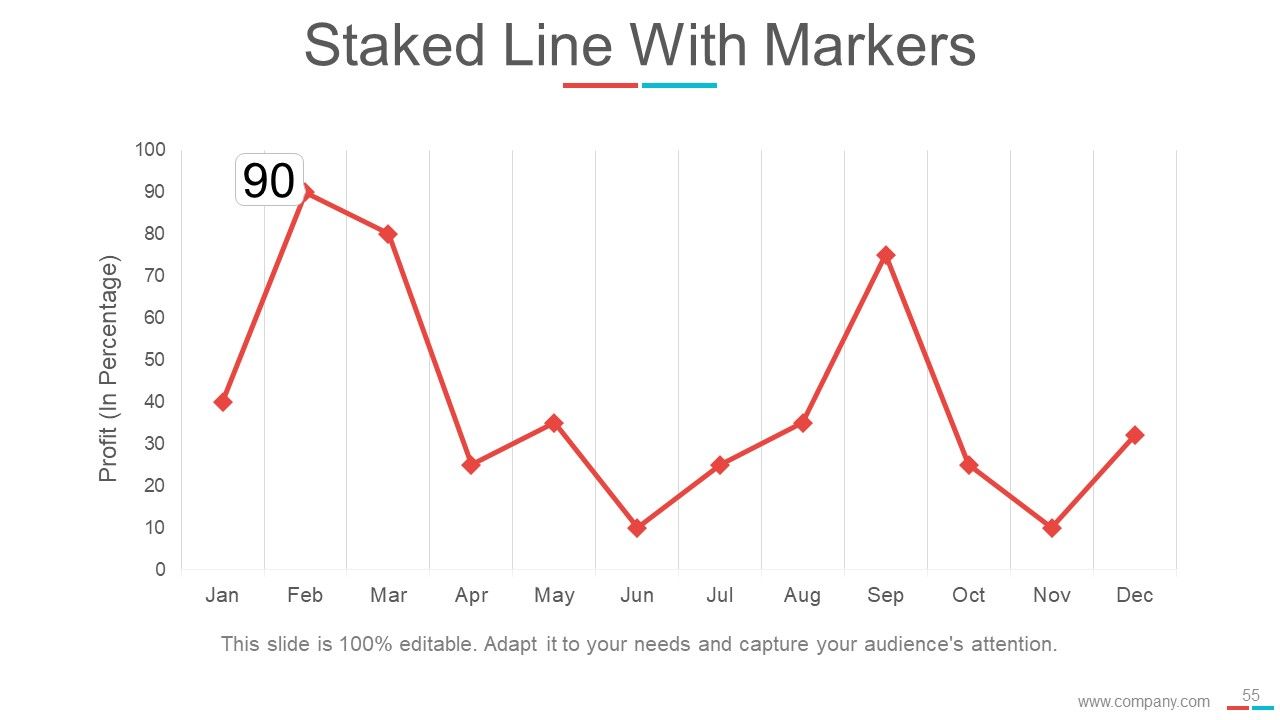
Slide 55: This slide showcases a Stacked Line With Markers for showcasing product/company growth, comparison, specifications etc.
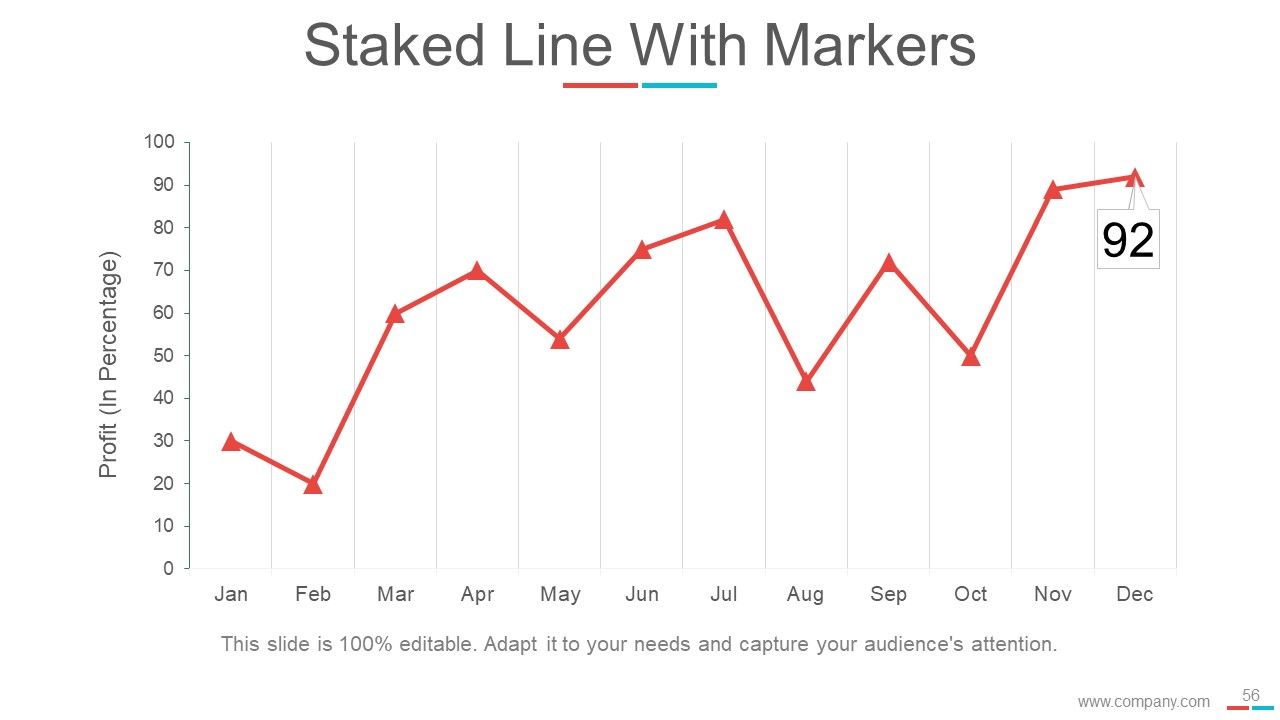
Slide 56: This slide also showcases a Stacked Line With Markers for showcasing product/company growth, comparison, specifications etc.
Slide 57: This slide is titled Additional Slides to move forward. You can change the slide content as per need.
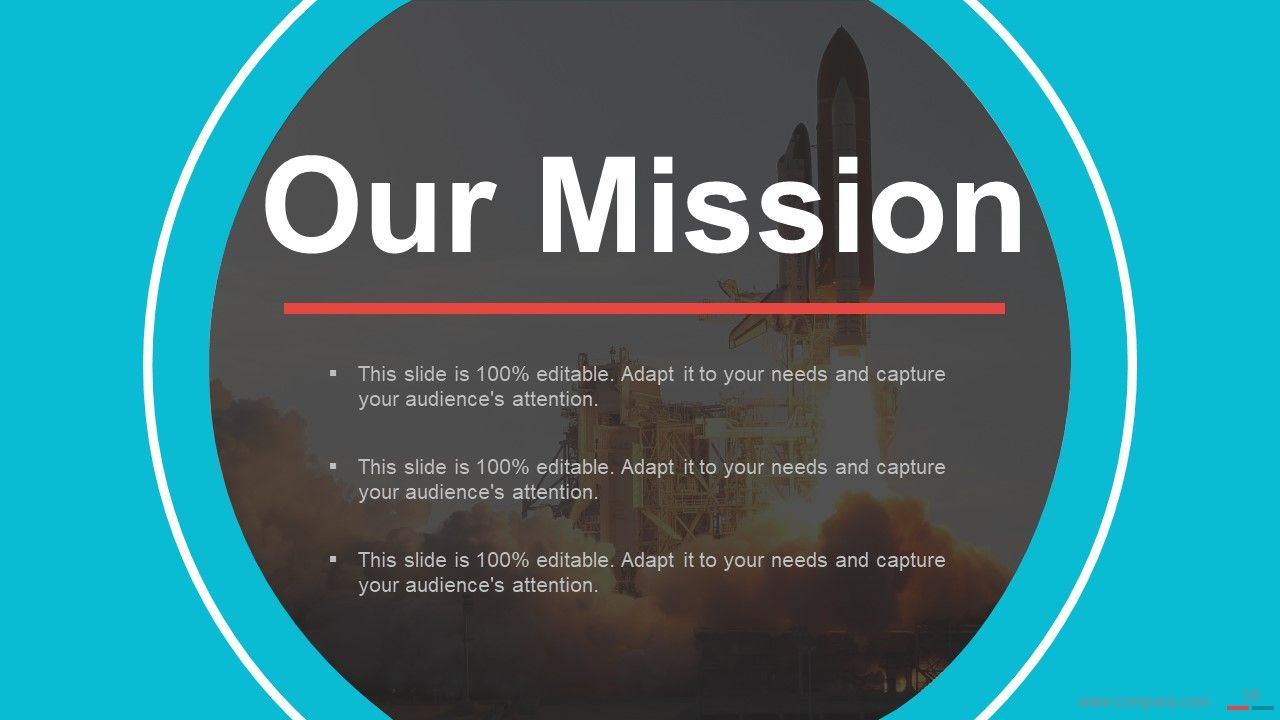
Slide 58: This is Our Mission slide. State mission aspects here.
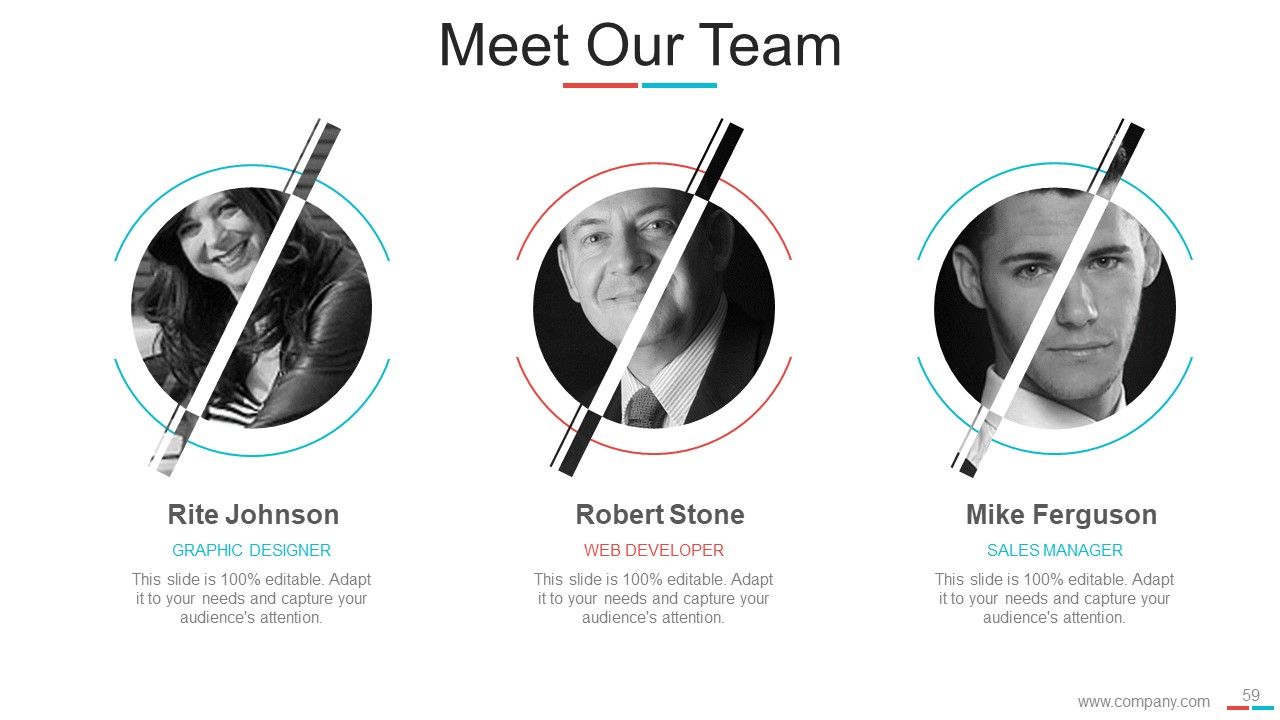
Slide 59: This is Meet Our team slide with name, designation and text boxes to state information.
Slide 60: This is an About Us slide. State company/team specifications here.
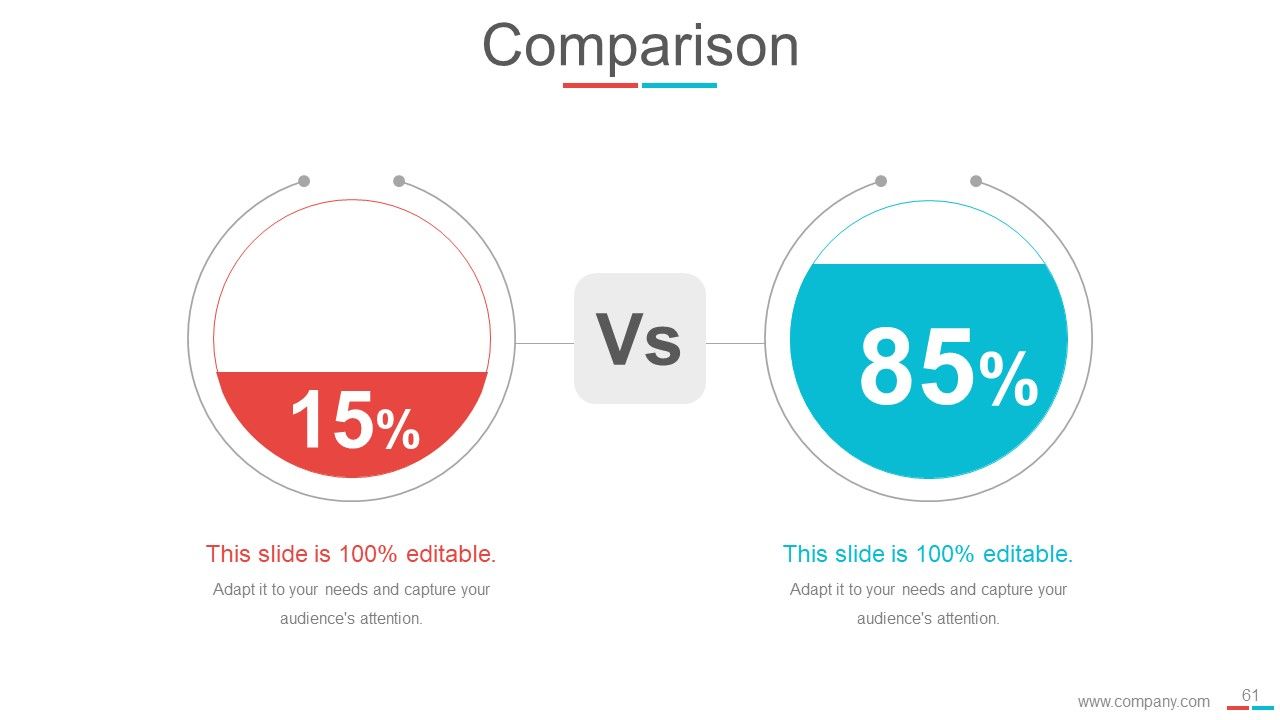
Slide 61: This is a Comparison slide to show comparison, information, specifications etc.
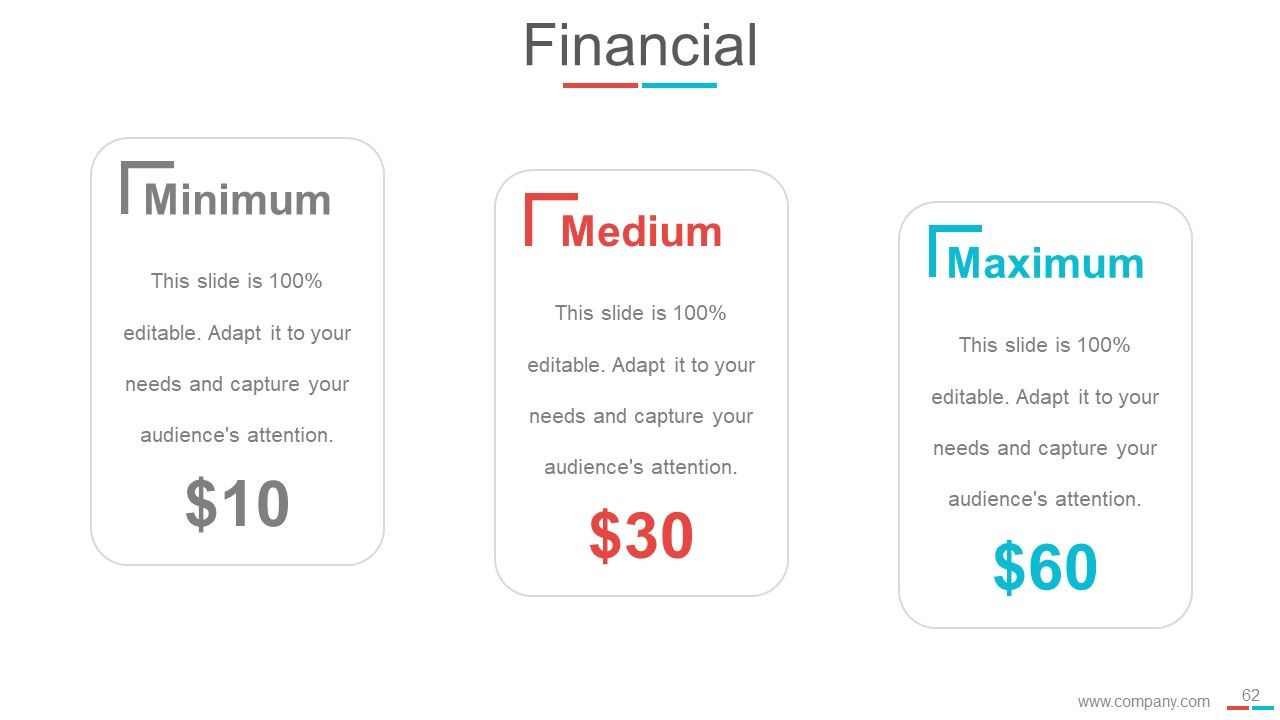
Slide 62: This slide presents Financial scores and stats to display.
Slide 63: This is a Quotes slide to highlight, or state anything specific. You may change the slide content as per need.
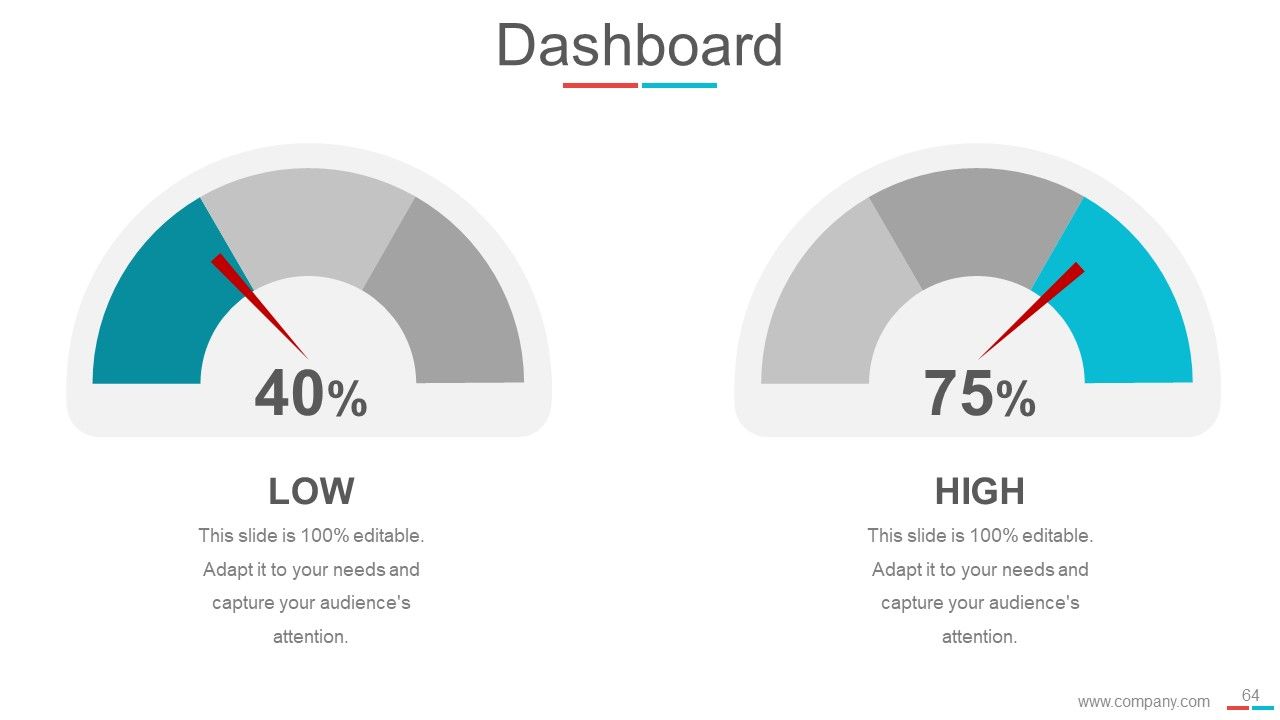
Slide 64: This is a Dashboard slide to state Low, medium and High aspects, kpis, metrics etc.
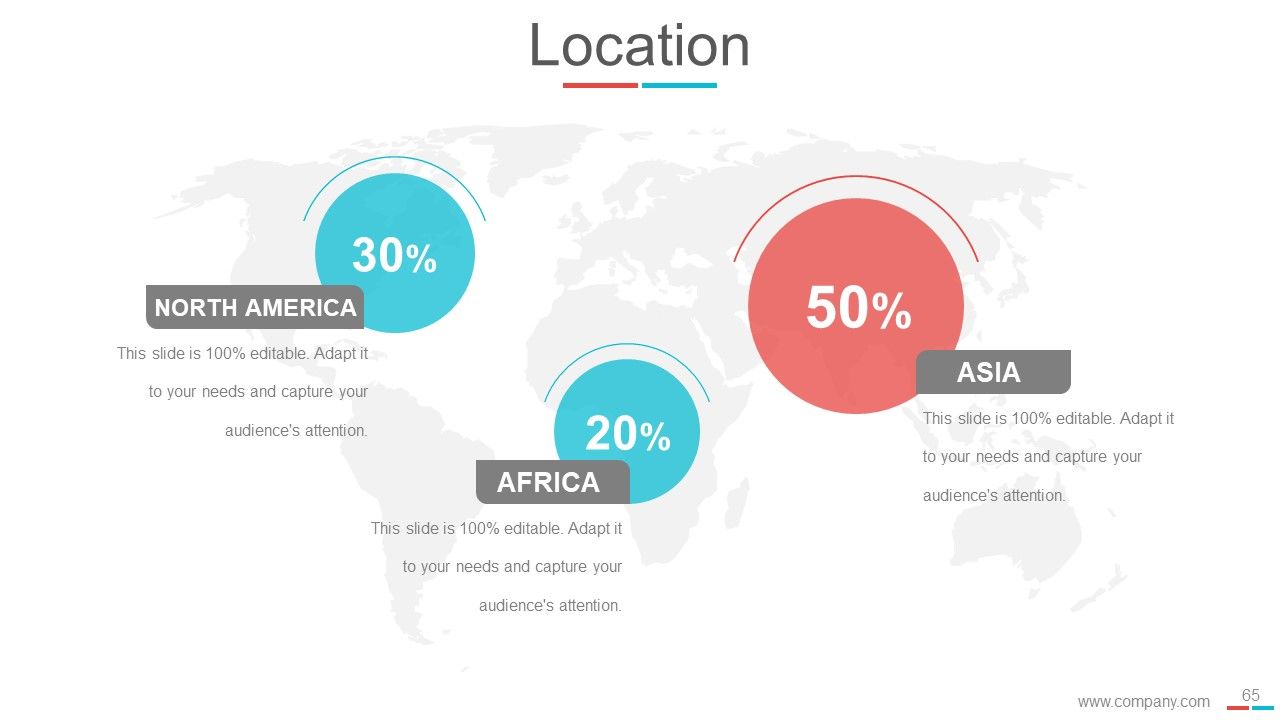
Slide 65: This slide showcases Location to show global presence etc.
Slide 66: This slide showcases a Timeline to show milestones, evolution, growth etc.
Slide 67: This slide displays Post It to show reminders, important notes etc.
Slide 68: This slide displays Newspaper image to showcase message, highlights etc.
Slide 69: This slide showcases a Puzzle image to show information, specifications etc.
Slide 70: This slide shows Target Board With Dart. State your targets here.
Slide 71: This slide shows a Circular image with text boxes. State information etc. here.
Slide 72: This slide shows a Venn diagram image with text boxes. State information etc. here.
Slide 73: This is a Mind Map slide to show information, segregation, specifications etc.
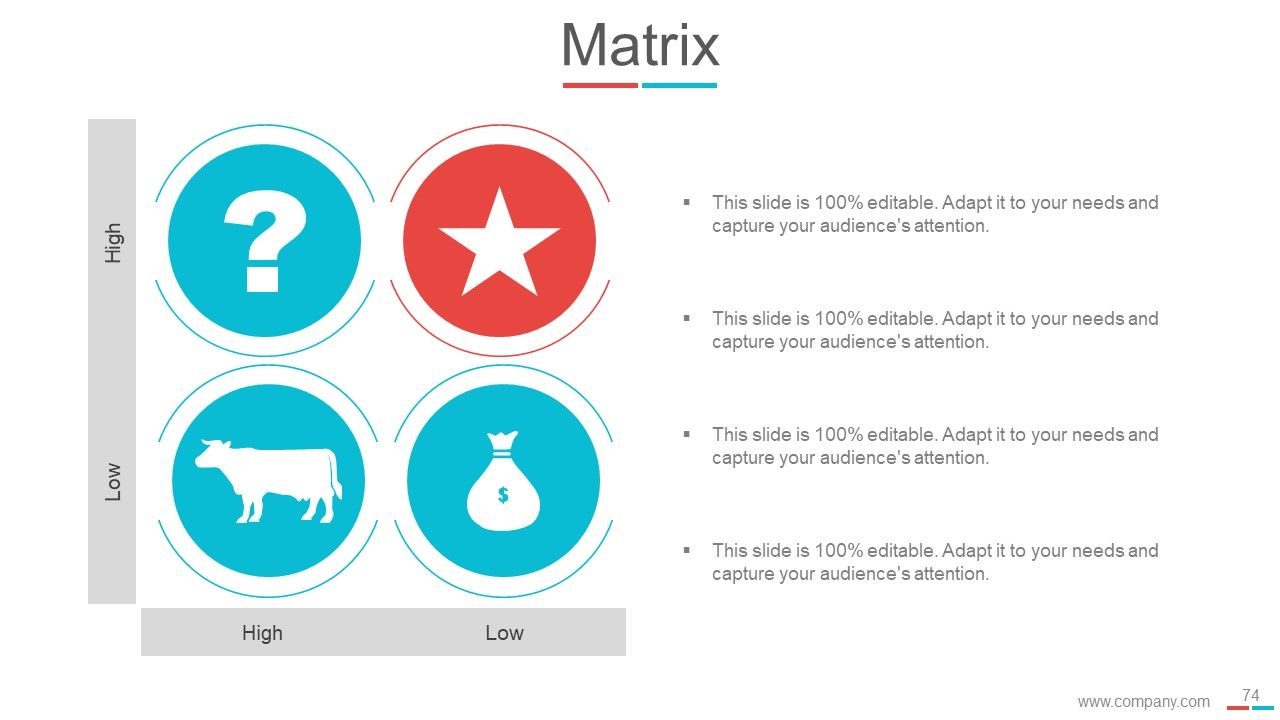
Slide 74: This is a Matrix slide (BCG) to show information, specifications etc.
Slide 75: This is a Lego image slide to show information, specifications etc.
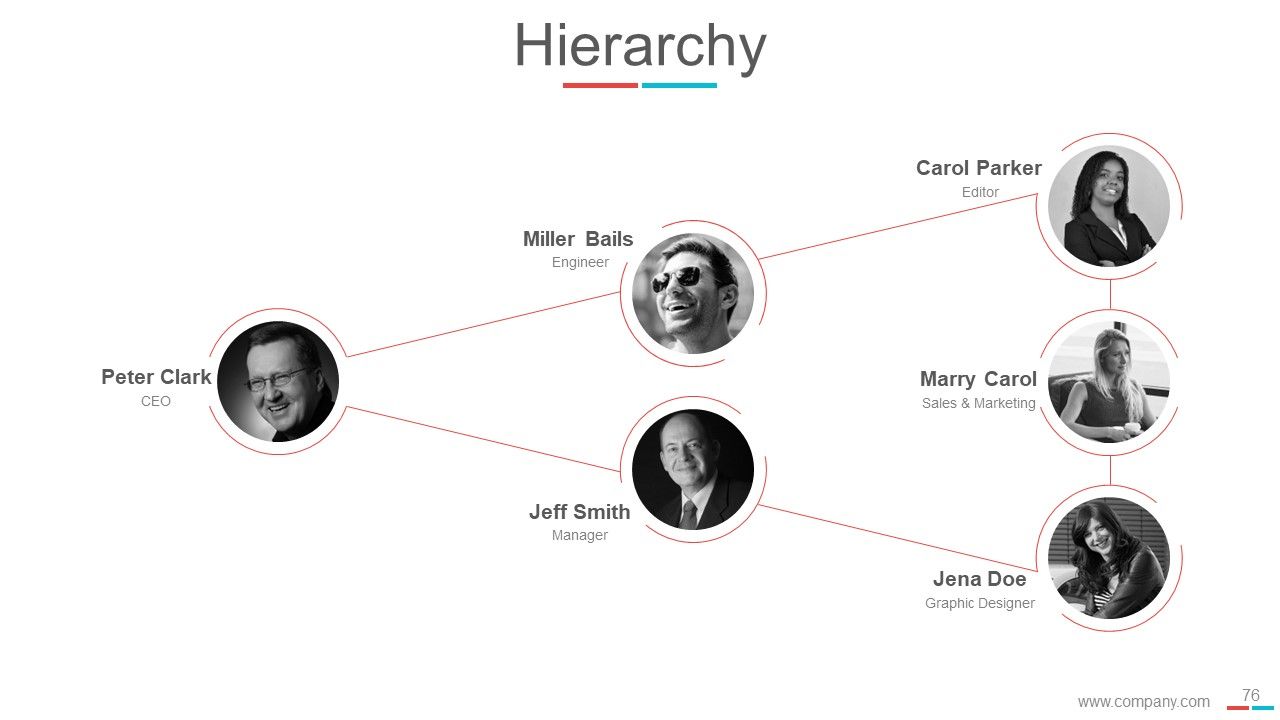
Slide 76: This is a Hierarchy slide to show information, specifications etc.
Slide 77: This slide shows a Bulb image with text boxes. State innovative information, highlighting idea etc. here.
Slide 78: This slide shows a Magnifying glass image with text boxes. State information, scope etc. here.
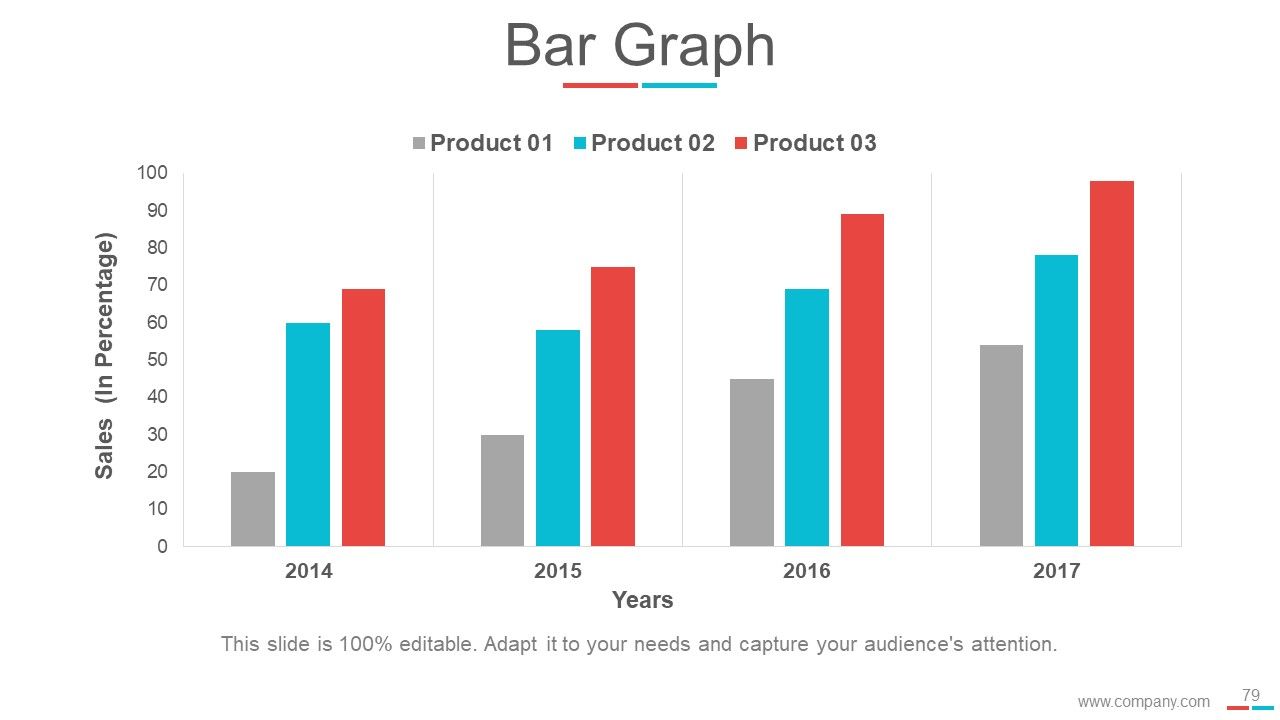
Slide 79: This slide shows a Bar graph to state information, comparison etc. here.
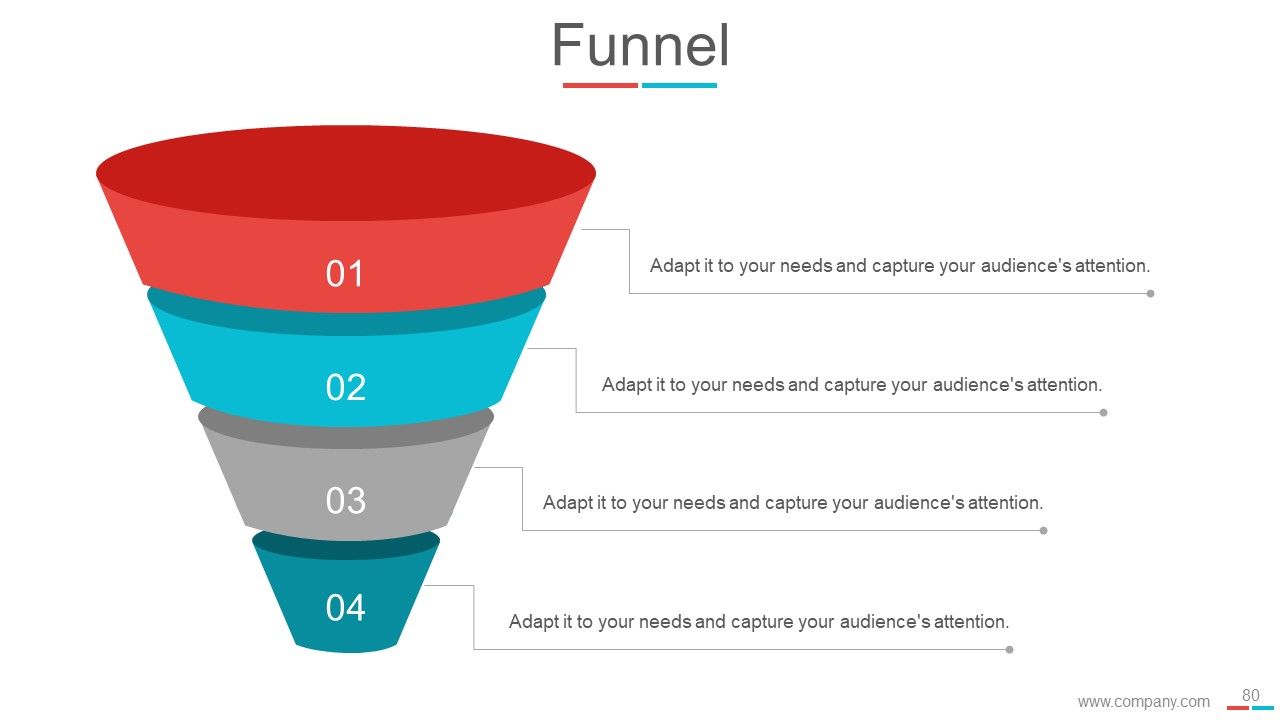
Slide 80: This slide displays a FUNNEL image. State information etc. here.
Slide 81: This is a Thank You slide with Address# street number, city, state, Contact Numbers, Email Address.
Pdca cycle and continuous improvement powerpoint presentation slides with all 81 slides:
Our Pdca Cycle And Continuous Improvement Powerpoint Presentation Slides attract expertise. The best brains find them appealing.
-
Understandable and informative presentation.
-
Unique and attractive product design.


