Quality control tools and techniques powerpoint presentation slides
Find issues related to the quality using Quality Control Tools And Techniques PowerPoint Presentation Slides. Solve most quality related issues with the help of professionally designed quality control tools and techniques PPT templates. These templates showcase necessary tools required to control the quality within an organization or project. These templates have the relevant content to detect and control the loopholes. This deck comprises of quality tools such as cause and effect diagram, check sheet, control charts, histogram, pareto chart, scatter diagram, and more. Implement these tools to enhance the quality of the product and services or the quality of an organization. These tools and techniques are apt for quality planning and quality assurance. Prioritize objectives and discover problem areas by adding quality control charts and graphs. These PPT templates are completely customizable. Edit the color, text, icon and font size as per your requirement. Download quality control tools or also known as Kaoru Ishikawa’s quality tools presentation slideshow to achieve the desired goals and outcomes. Develop a feel for difficulties ahead with our Quality Control Tools And Techniques Powerpoint Presentation Slides. They help anticipate hassles.
- Google Slides is a new FREE Presentation software from Google.
- All our content is 100% compatible with Google Slides.
- Just download our designs, and upload them to Google Slides and they will work automatically.
- Amaze your audience with SlideTeam and Google Slides.
-
Want Changes to This PPT Slide? Check out our Presentation Design Services
- WideScreen Aspect ratio is becoming a very popular format. When you download this product, the downloaded ZIP will contain this product in both standard and widescreen format.
-

- Some older products that we have may only be in standard format, but they can easily be converted to widescreen.
- To do this, please open the SlideTeam product in Powerpoint, and go to
- Design ( On the top bar) -> Page Setup -> and select "On-screen Show (16:9)” in the drop down for "Slides Sized for".
- The slide or theme will change to widescreen, and all graphics will adjust automatically. You can similarly convert our content to any other desired screen aspect ratio.
Compatible With Google Slides

Get This In WideScreen
You must be logged in to download this presentation.
PowerPoint presentation slides
Presenting quality control tools and techniques PowerPoint presentation slide. This deck has a set of 21 slides. This presentation has been crafted with an extensive research done by the research experts. Our PowerPoint designers have designed this PPT by incorporating appropriate diagrams, layouts, templates and icons related to the topic. These slides are completely customizable. Edit the colour, text and icon as per your need. Click the download button below to grab this content-ready PPT deck.
People who downloaded this PowerPoint presentation also viewed the following :
Content of this Powerpoint Presentation
Slide 1: This slide introduces Quality Control Tools and Techniques. State Your Company Name and begin.
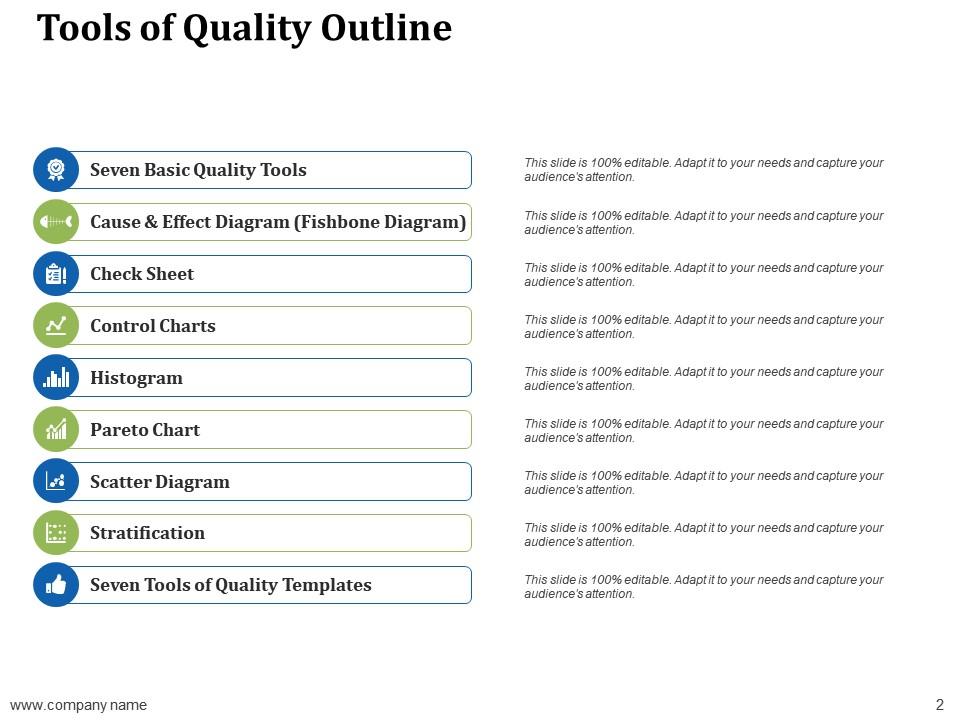
Slide 2: This slide shows Tools of Quality Outline with- Seven Basic Quality Tools, Cause & Effect Diagram (Fishbone Diagram), Check Sheet, Control Charts, Histogram, Pareto Chart, Scatter Diagram, Stratification and Seven Tools of Quality Templates.
Slide 3: This slide presents Seven Basic Quality Tools which contains- Check Sheet, Fishbone Diagram, Pareto Chart, Run Chart, Scatter Diagram, Histogram and Flow Chart.
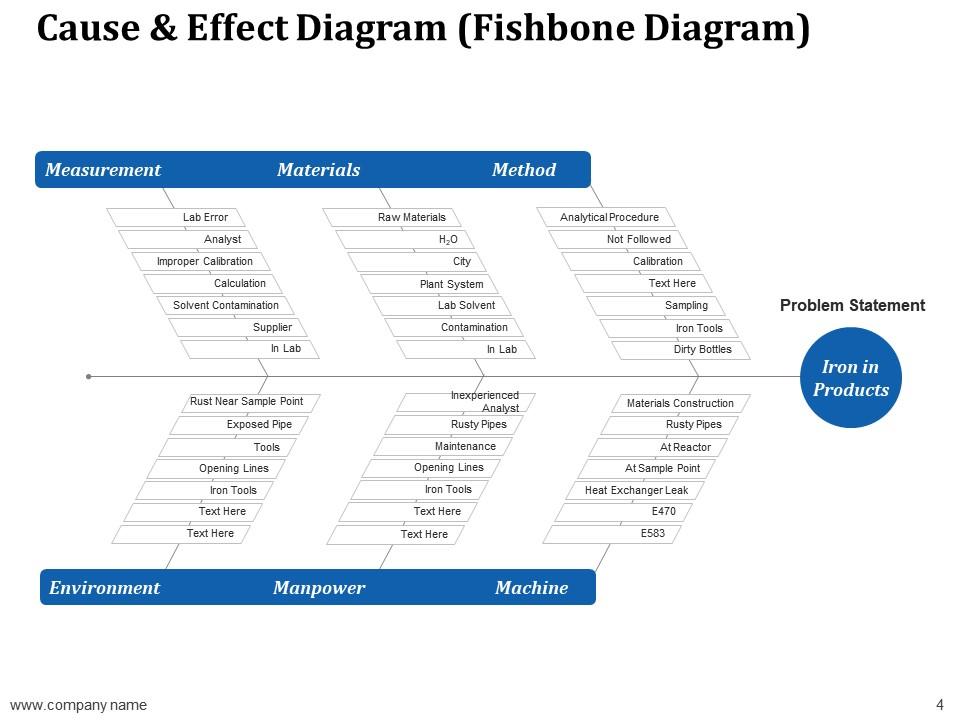
Slide 4: This slide displays Cause & Effect Diagram (Fishbone Diagram) with related information and text.
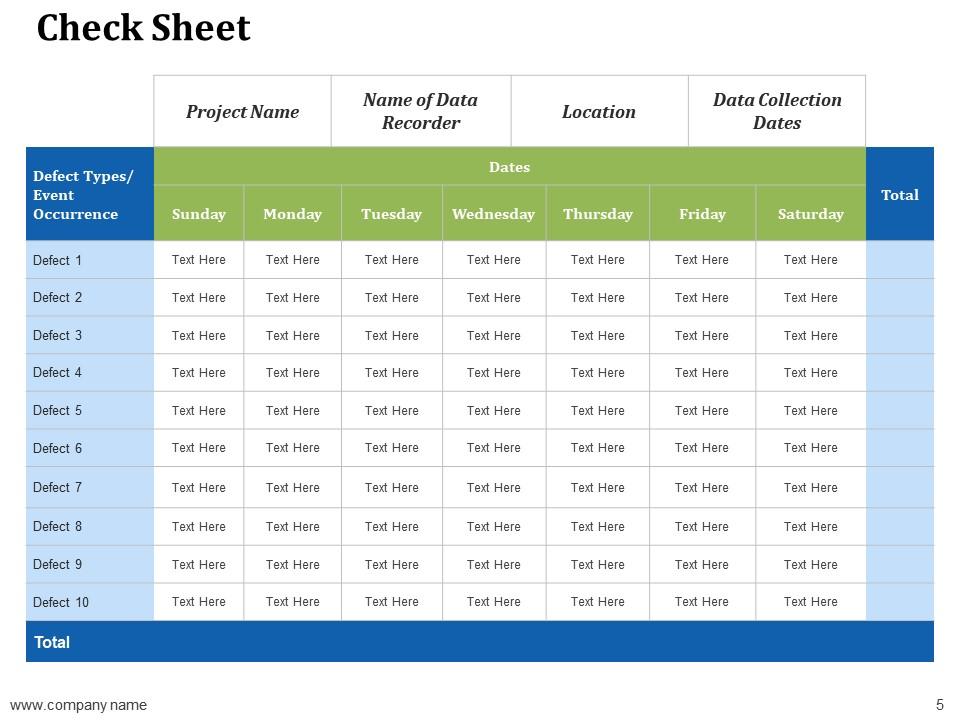
Slide 5: This slide represents Check Sheet on day basis to record any occurence of event or any defect.
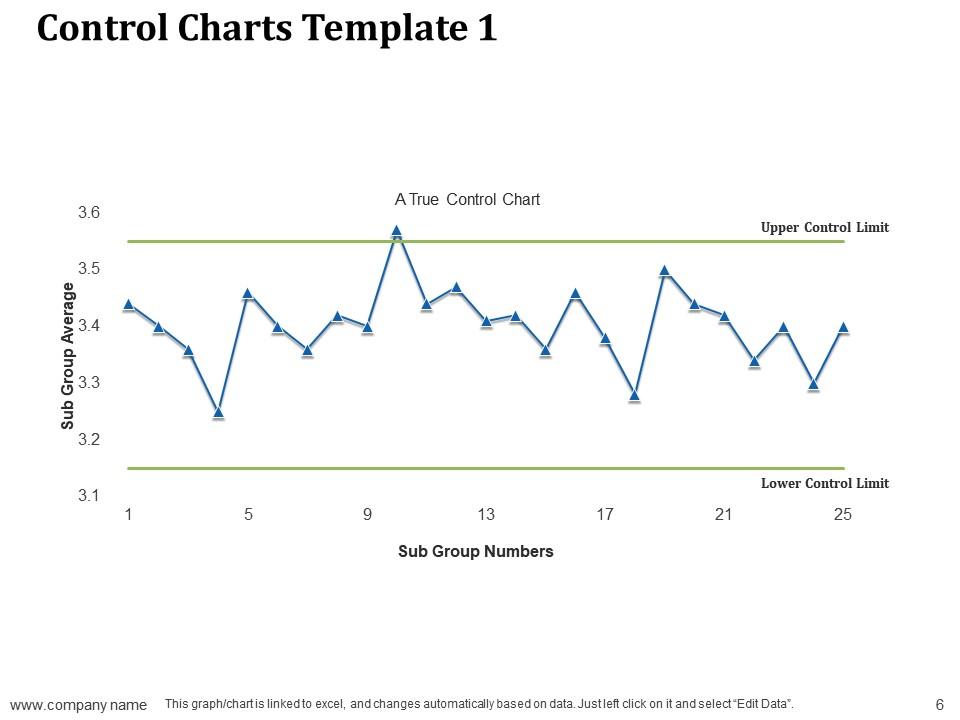
Slide 6: This slide showcases Control Charts Template 1 with line chart showing upper and lower control limit.
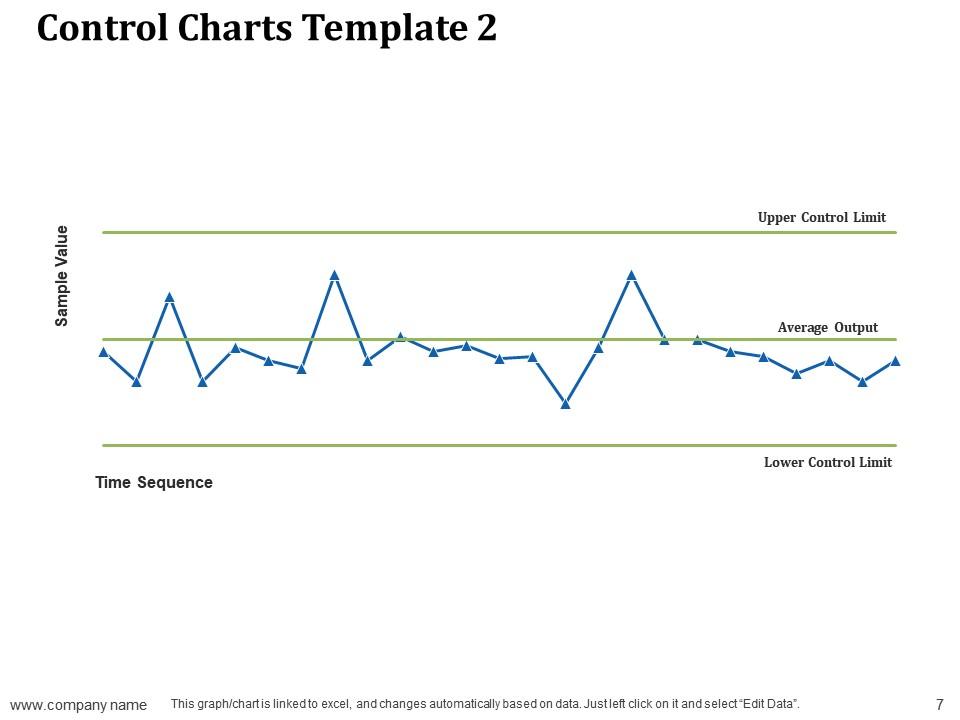
Slide 7: This slide shows Control Charts Template 2 with line chart describing Upper control limit, Lower control limit and Average output.
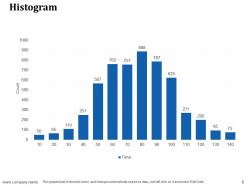
Slide 8: This slide displays Histogram as a quality control tool. Show relevant data accordingly.
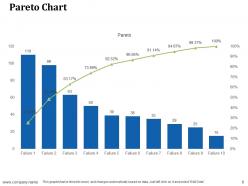
Slide 9: This slide represents Pareto Chart as another quality control tool.
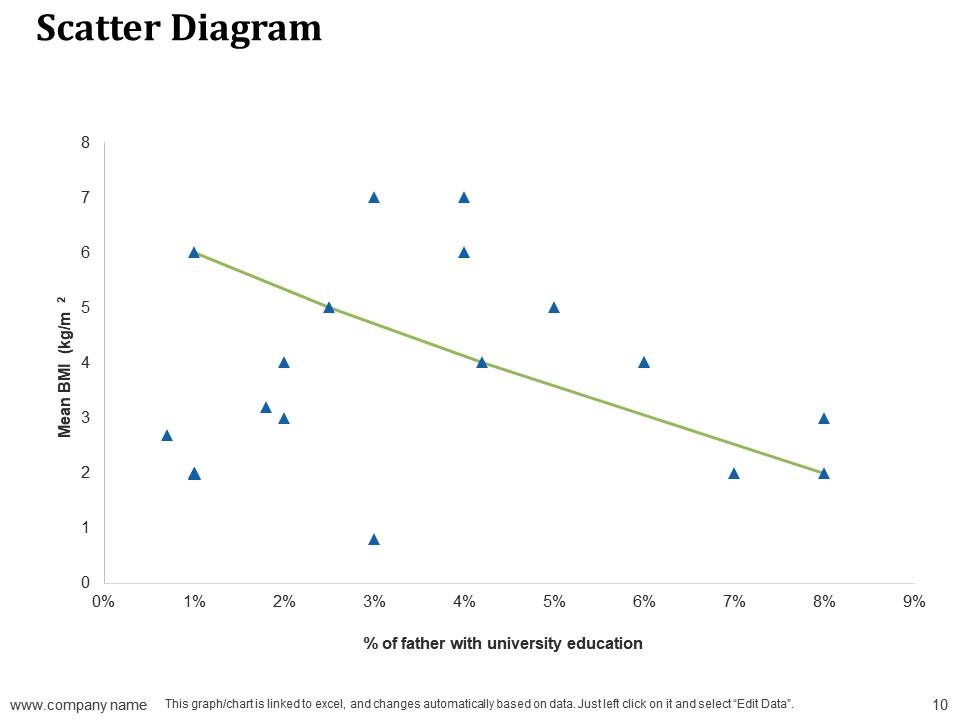
Slide 10: This slide presents Scatter Diagram in percentage to show quality control techniques.
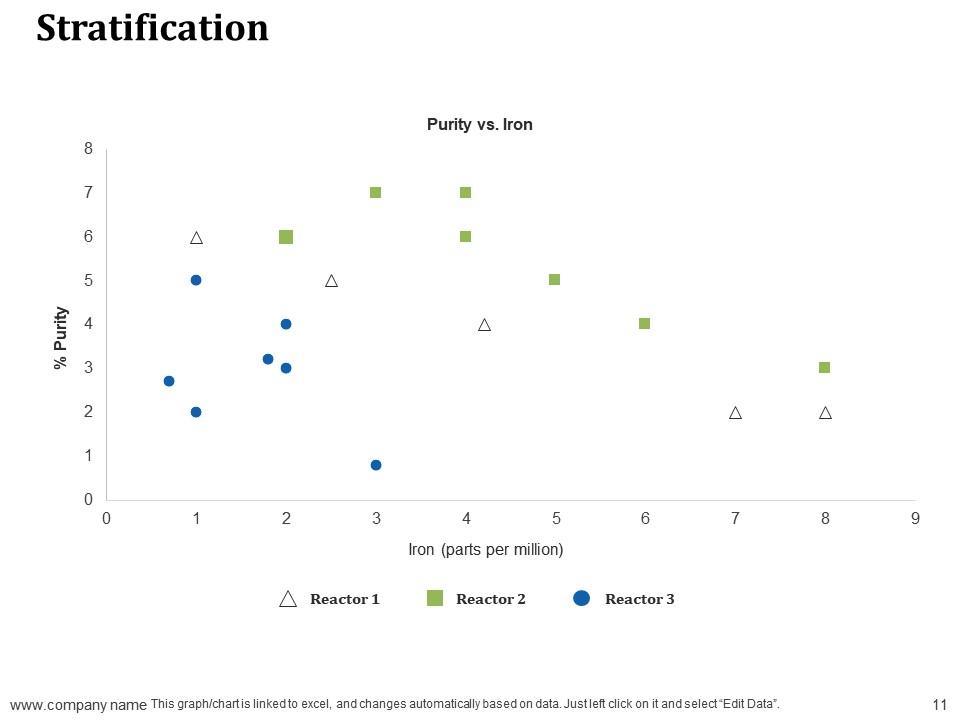
Slide 11: This slide shows Stratification describing Purity vs Iron along with three different reactors. You can change the data as per requirements.
Slide 12: This slide shows Quality Control Tools and Techniques Icons.
Slide 13: This slide is titled Additional slides for moving forward. You may change the content as per need.
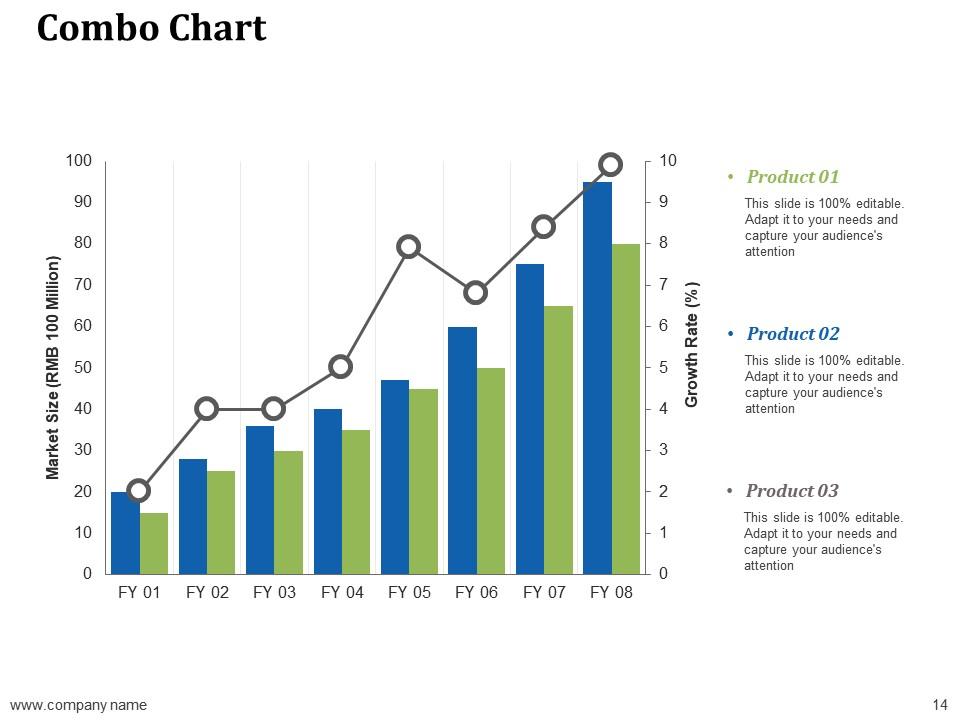
Slide 14: This slide shows Combo Chart with three products comparison.
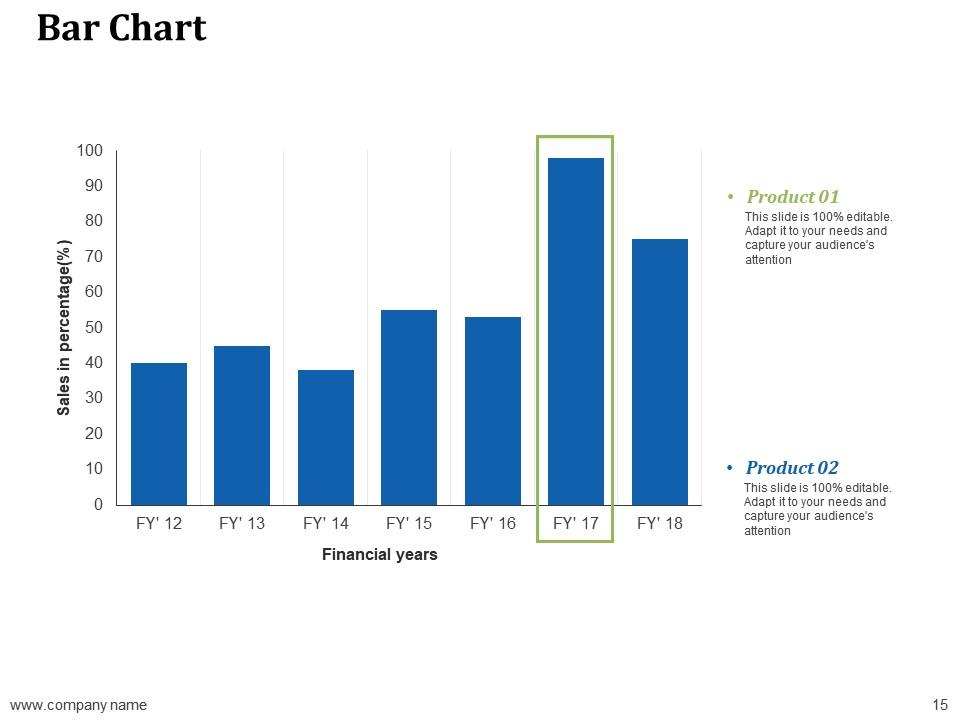
Slide 15: This slide displays Bar Chart with financial years and sales in percentage.
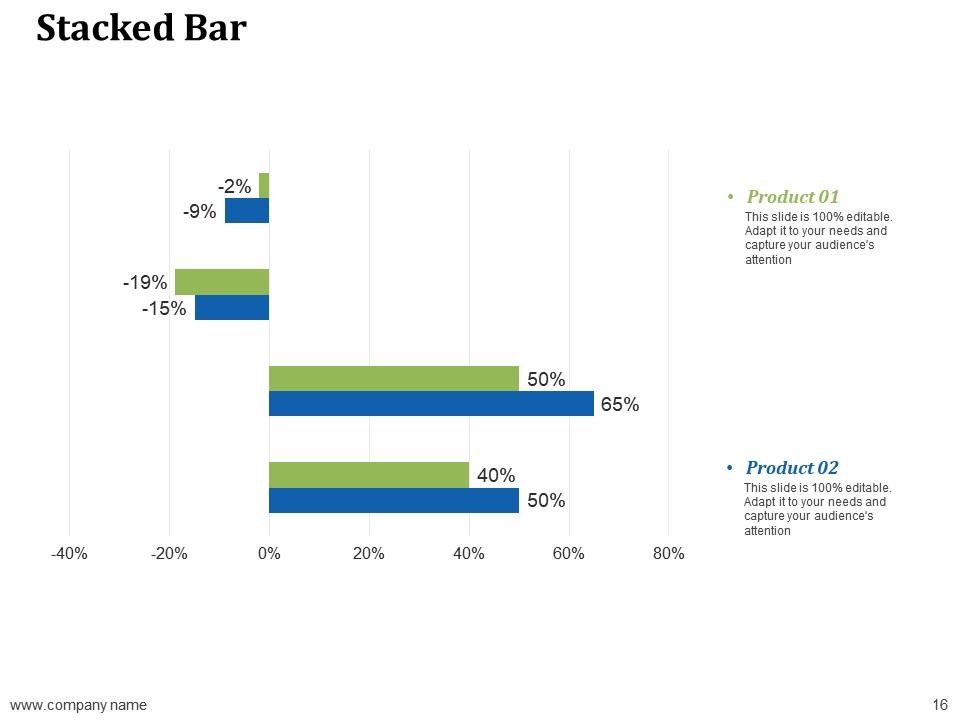
Slide 16: This slide presents Stacked Bar graph chart with two products comparison.
Slide 17: This is an About us slide to state company specifications etc.
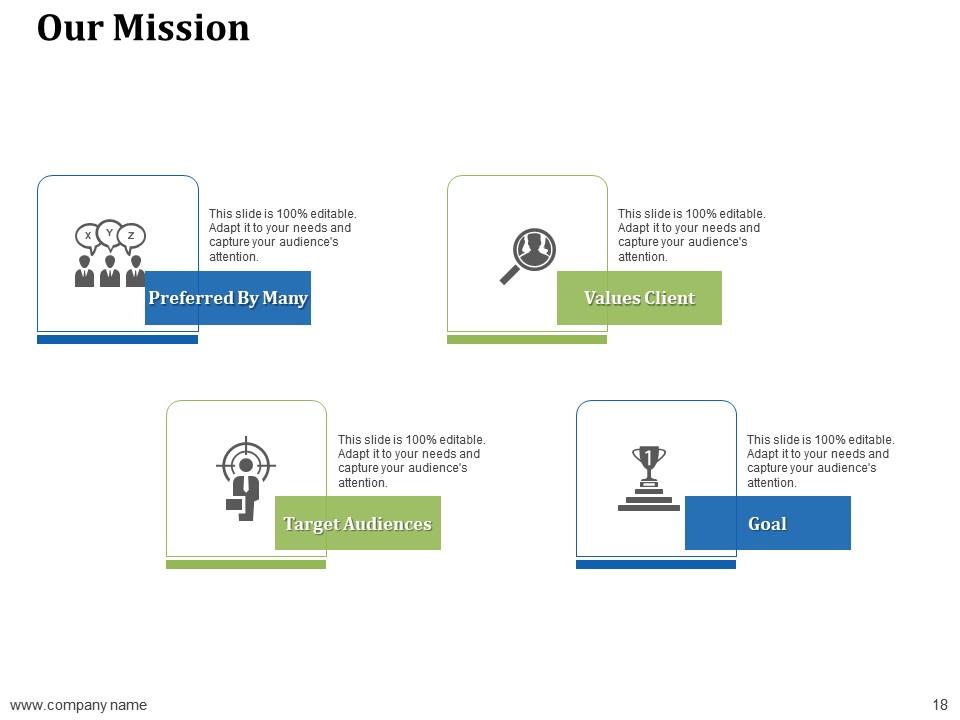
Slide 18: This is Our mission slide with imagery and text boxes to go with.
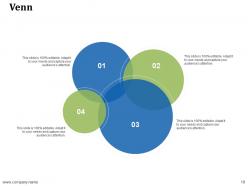
Slide 19: This is a Venn slide with text boxes to show information.
Slide 20: This is Our team slide with names and designation.
Slide 21: This is a Thank You slide with Address# street number, city, state, Contact Number, Email Address.
Quality control tools and techniques powerpoint presentation slides with all 21 slides:
There is nothing funny about our Quality Control Tools And Techniques Powerpoint Presentation Slides. They are always up front and factual.
No Reviews


