Project Closure Process Steps Powerpoint Presentation Slides
If you are looking for professional templates and slides to prepare a professional PPT on project closure process steps? Well if yes, then download our ready to use project closure process steps PowerPoint presentation slides. Showcase the performance of your company project to the customer using this project closure process steps PPT presentation. Using these project management presentation templates, you will be able to confirm if the team members have met all sponsor and consumer needs. This closing a project PowerPoint presentation includes essential topics such as project brief, project description, project timeline, project progress summary, project status report, and project health card. It also covers a slide on project dashboard, project closure report, work breakdown structure, and project conclusion report-performance analysis, deadline, budget/costs. With the help of the project description presentation PPT, you will be able to represent throughout the progress of the project. Use of stunning graphics and visuals will help you describe the different project stages performance. Download this project closure checklist PPT presentation. Ensure a clean baton change with our Project Closure Process Steps Powerpoint Presentation Slides. They allow flawless accomplishment.
- Google Slides is a new FREE Presentation software from Google.
- All our content is 100% compatible with Google Slides.
- Just download our designs, and upload them to Google Slides and they will work automatically.
- Amaze your audience with SlideTeam and Google Slides.
-
Want Changes to This PPT Slide? Check out our Presentation Design Services
- WideScreen Aspect ratio is becoming a very popular format. When you download this product, the downloaded ZIP will contain this product in both standard and widescreen format.
-

- Some older products that we have may only be in standard format, but they can easily be converted to widescreen.
- To do this, please open the SlideTeam product in Powerpoint, and go to
- Design ( On the top bar) -> Page Setup -> and select "On-screen Show (16:9)” in the drop down for "Slides Sized for".
- The slide or theme will change to widescreen, and all graphics will adjust automatically. You can similarly convert our content to any other desired screen aspect ratio.
Compatible With Google Slides

Get This In WideScreen
You must be logged in to download this presentation.
PowerPoint presentation slides
Presenting project closure process steps PowerPoint presentation slides. This presentation covers 31 professionally prepared PowerPoint templates, all of them being 100 percent editable in PowerPoint. Content fonts size and type, colors and slide background of the PPT slides are changeable. The presentation slides can be downloaded in both wide screen (16:9) and standard view (4:3) aspect dimension. The PPT slides are fully compatible with Google Slides and other online software’s. PPT templates can be saved in any of the options such as JPG or PDF. You can personalize the PowerPoint slides by incorporating a company name or logo. Premium product support is provided.
People who downloaded this PowerPoint presentation also viewed the following :
Content of this Powerpoint Presentation
Slide 1: This slide introduces Project Closure Process Steps. State Your Company Name and get started.
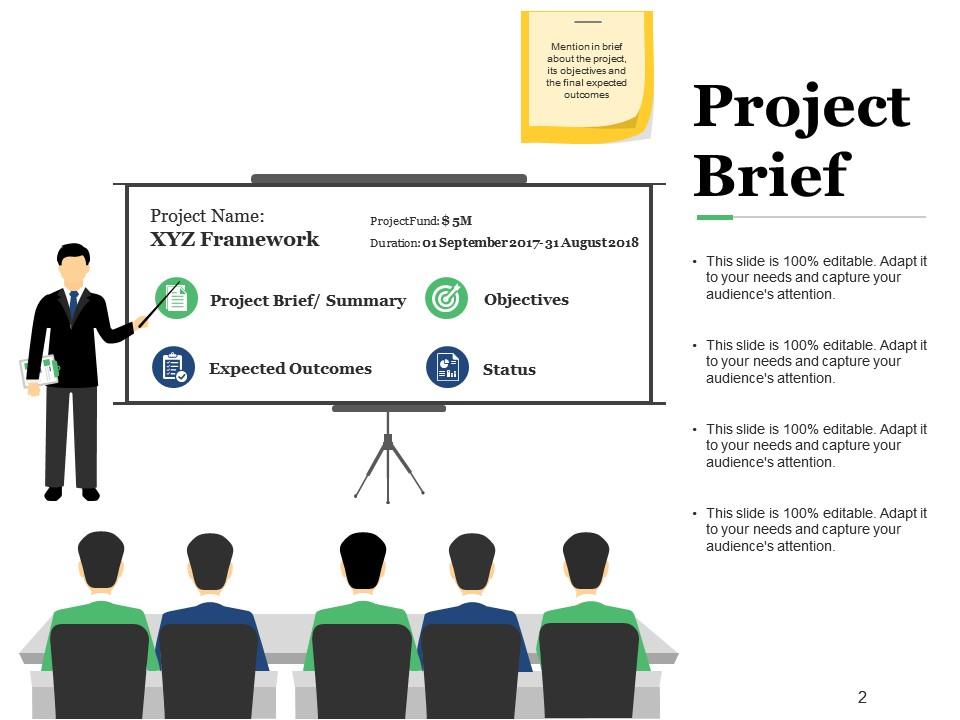
Slide 2: This slide presents Project Brief. Mention in brief about the project, its objectives and the final expected outcomes
Slide 3: This slide showcases Project Description .Describe in detail, what the project is all about
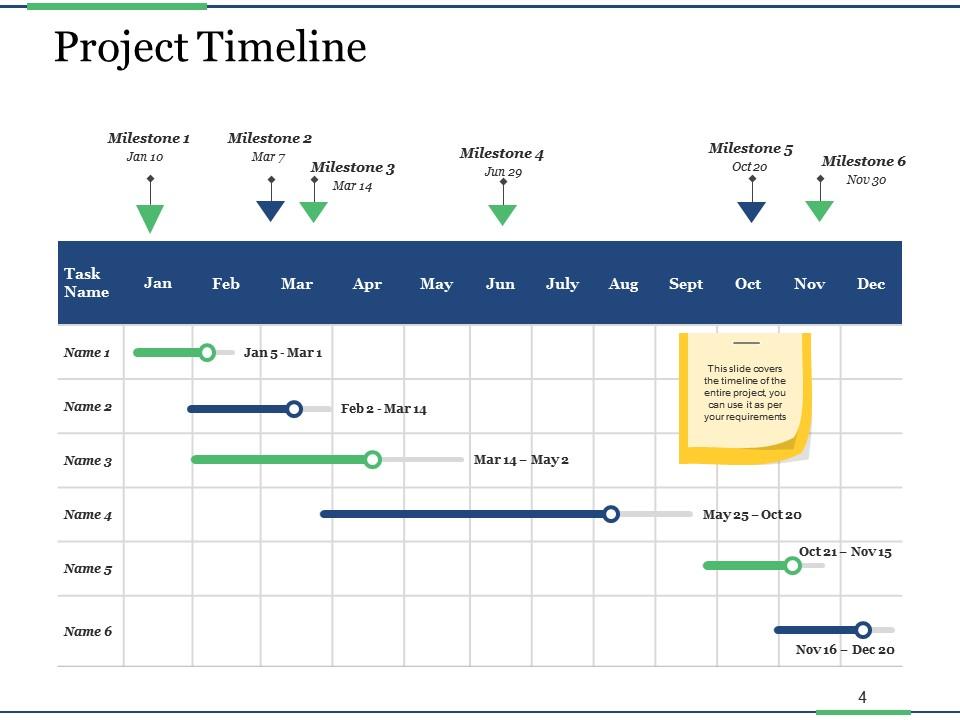
Slide 4: This slide presents Project Timeline. This slide covers the timeline of the entire project, you can use it as per your requirements.
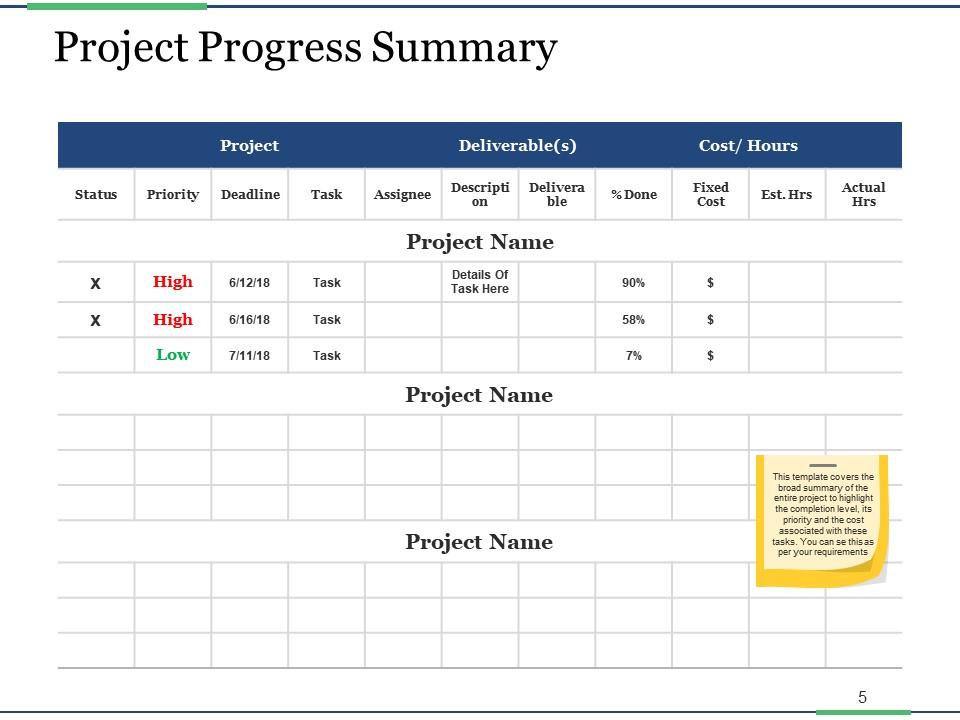
Slide 5: This slide shows Project Progress Summary.This template covers the broad summary of the entire project to highlight the completion level, its priority and the cost associated with these tasks. You can se this as per your requirements.
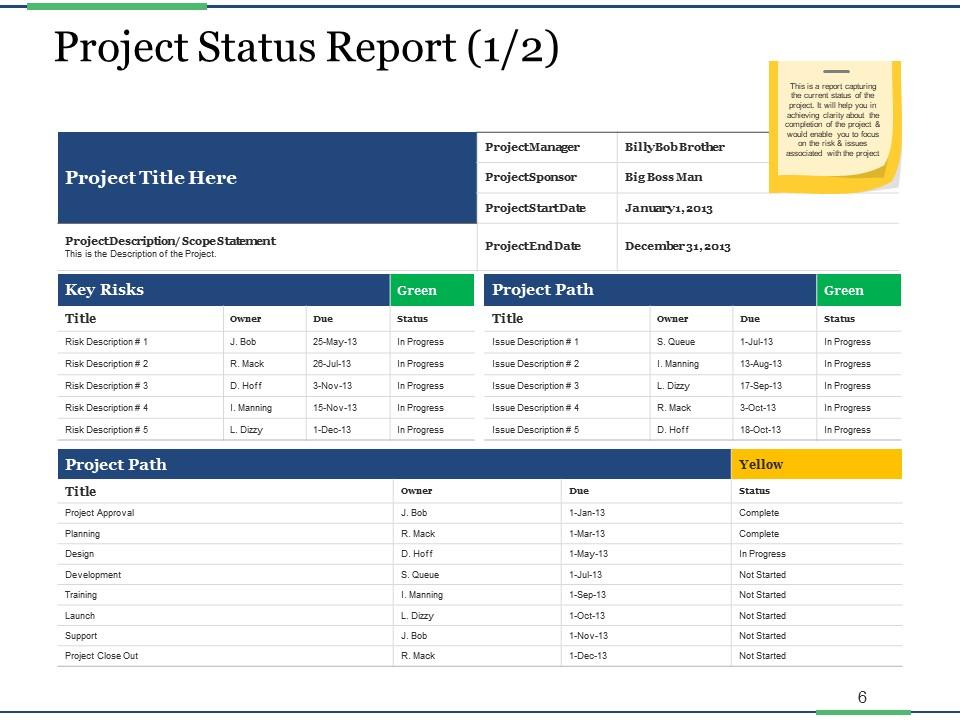
Slide 6: This slide presents Project Status Report (1/2). This is a report capturing the current status of the project. It will help you in achieving clarity about the completion of the project & would enable you to focus on the risk & issues associated with the project
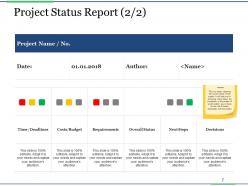
Slide 7: This slide showcases Project Status Report (2/2). This is a report capturing the current status of the project. It will help you in achieving clarity about the completion of the project & would enable you to focus on the risk & issues associated with the project
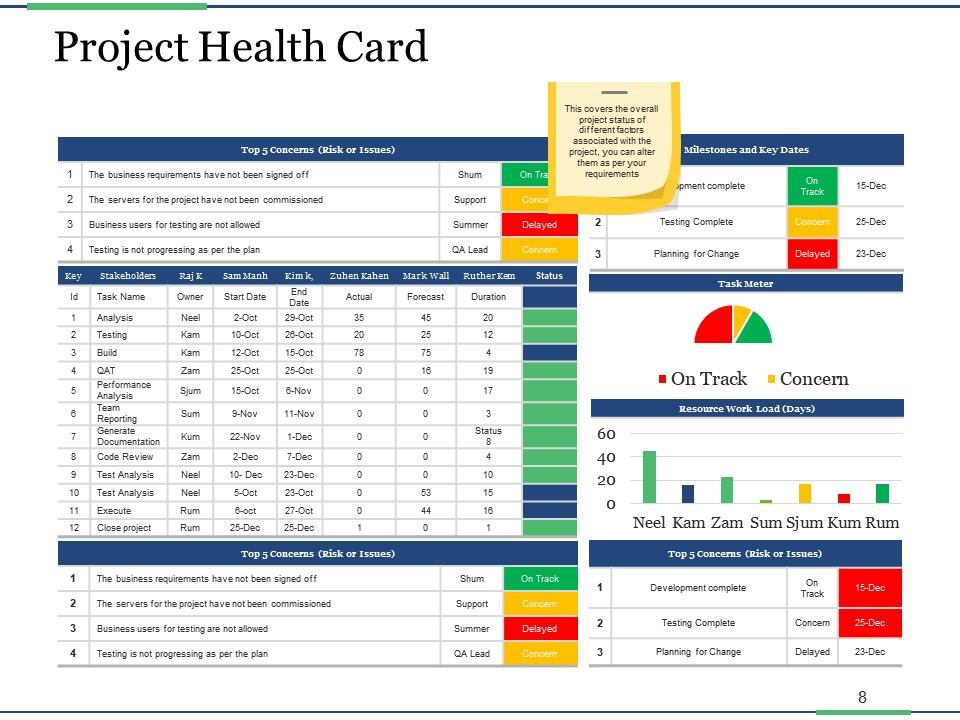
Slide 8: This slide shows Project Health Card. This covers the overall project status of different factors associated with the project, you can alter them as per your requirements
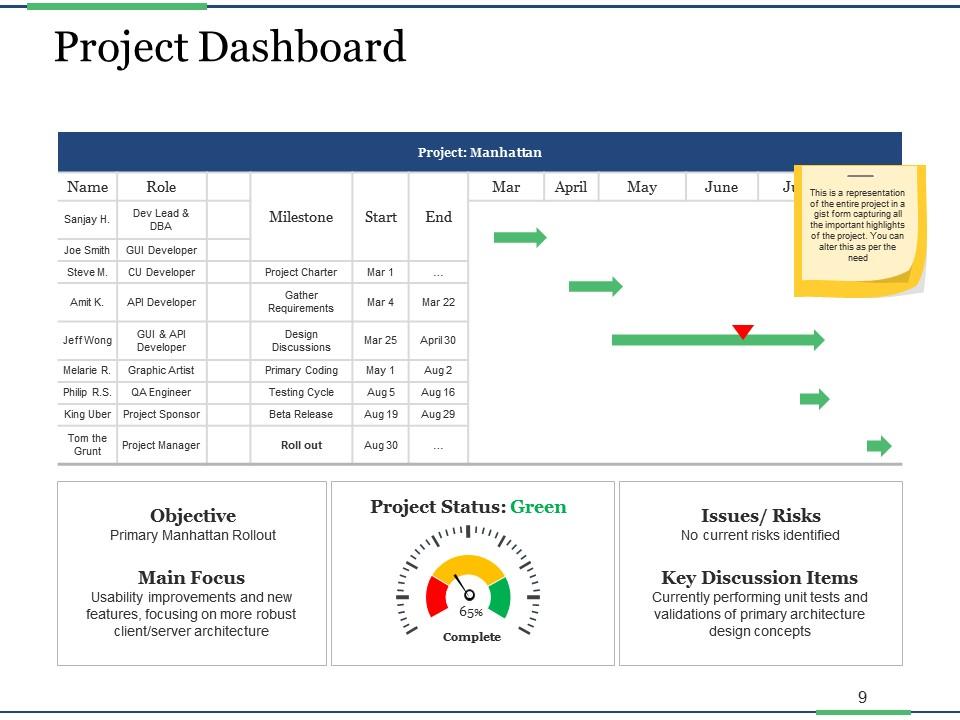
Slide 9: This slide presents Project Dashboard. This is a representation of the entire project in a gist form capturing all the important highlights of the project. You can alter this as per the need
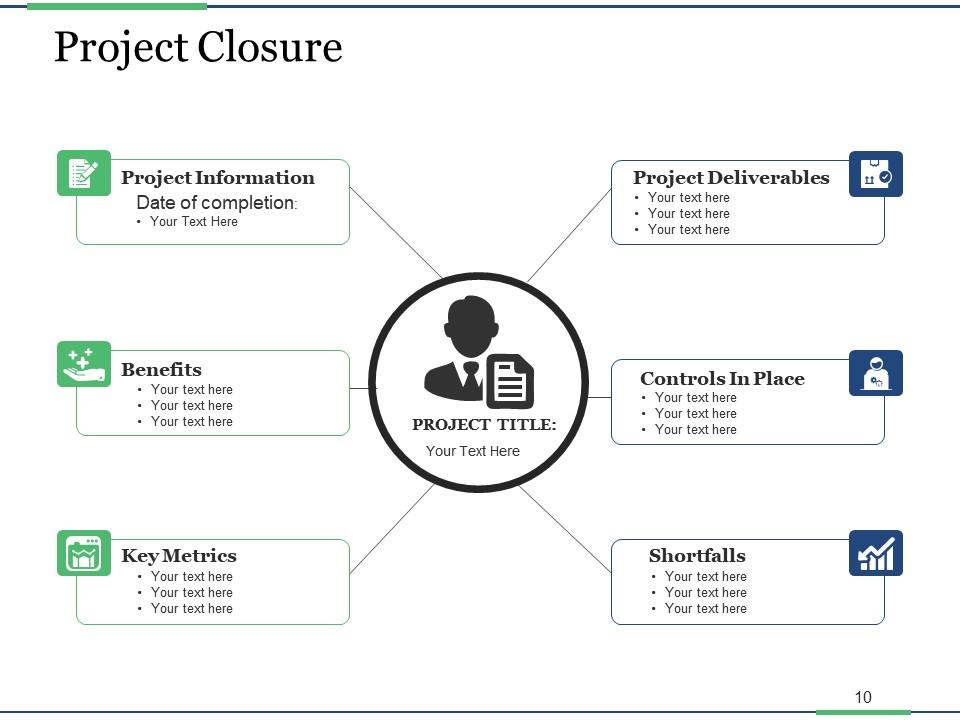
Slide 10: This slide showcases Project Closure with these of the factors presenting- Controls in Place, Shortfalls, Project Deliverables, Key Metrics, Benefits, Project Information, Date of completion.
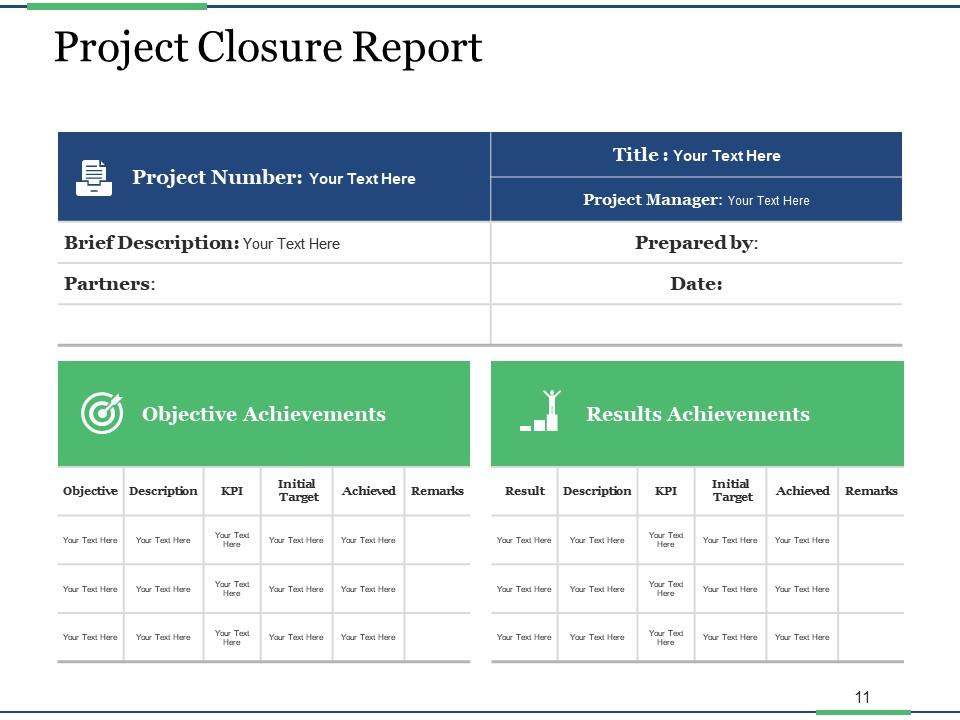
Slide 11: This slide presents Project Closure Report. With this you can use it for the brief description, objective achievement and results.
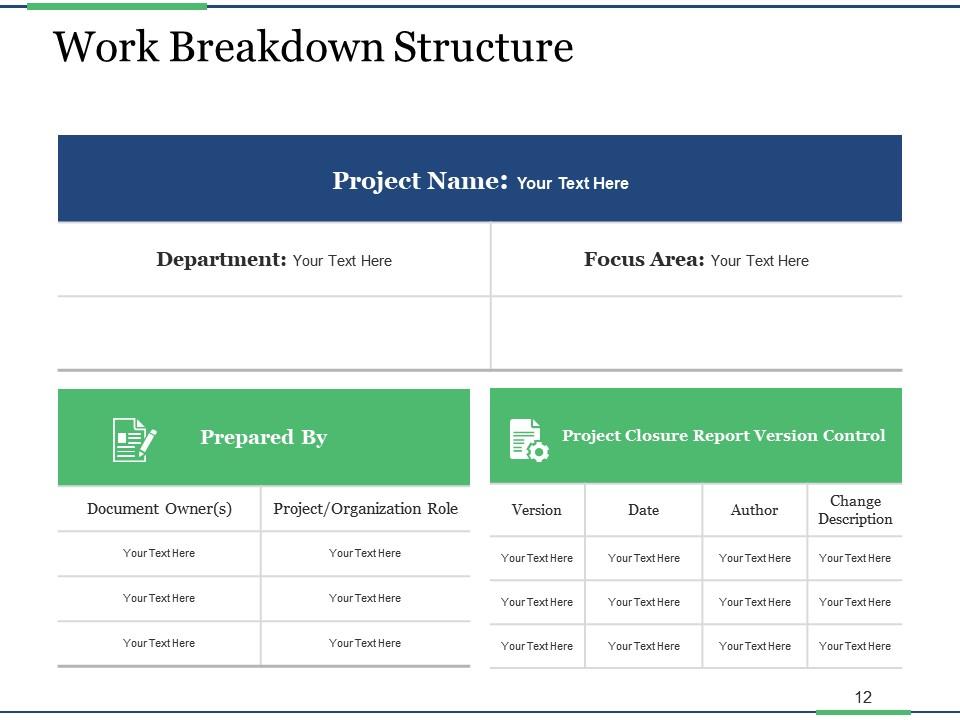
Slide 12: This slide showcases Work Breakdown Structure.
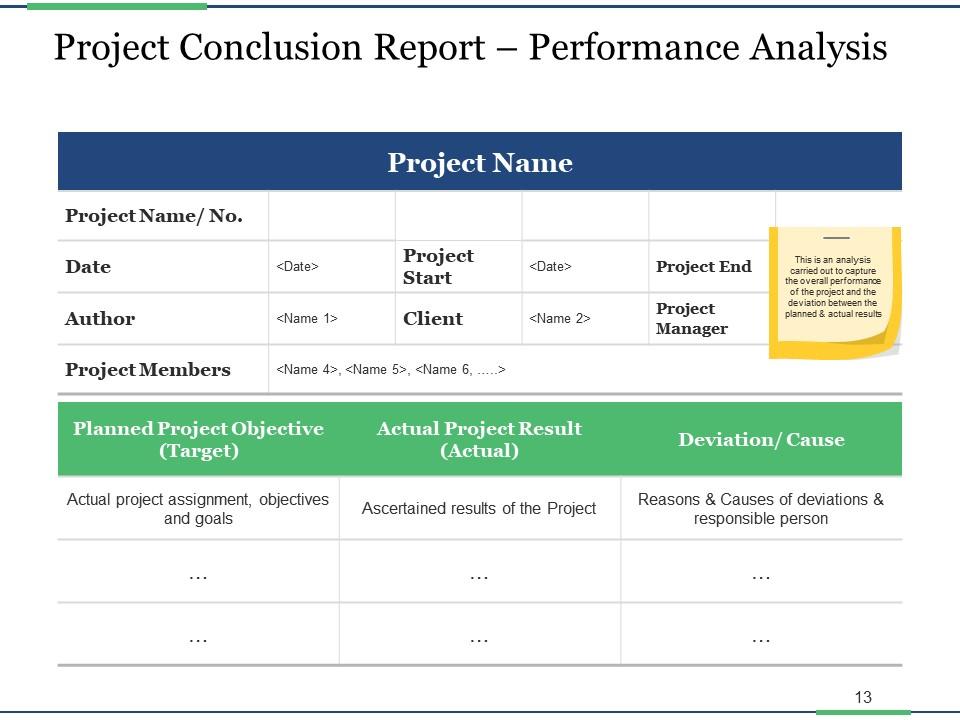
Slide 13: This slide shows Project Conclusion Report – Performance Analysis. This is an analysis carried out to capture the overall performance of the project and the deviation between the planned & actual results
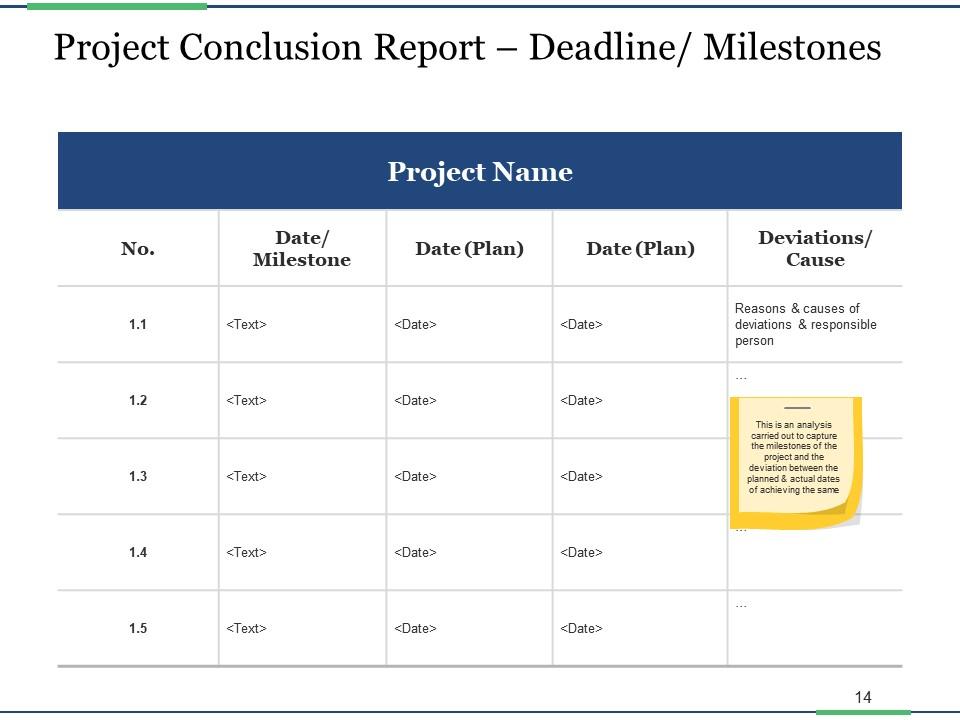
Slide 14: This slide shows Project Conclusion Report – Deadline/ Milestones. This is an analysis carried out to capture the milestones of the project and the deviation between the planned & actual dates of achieving the same
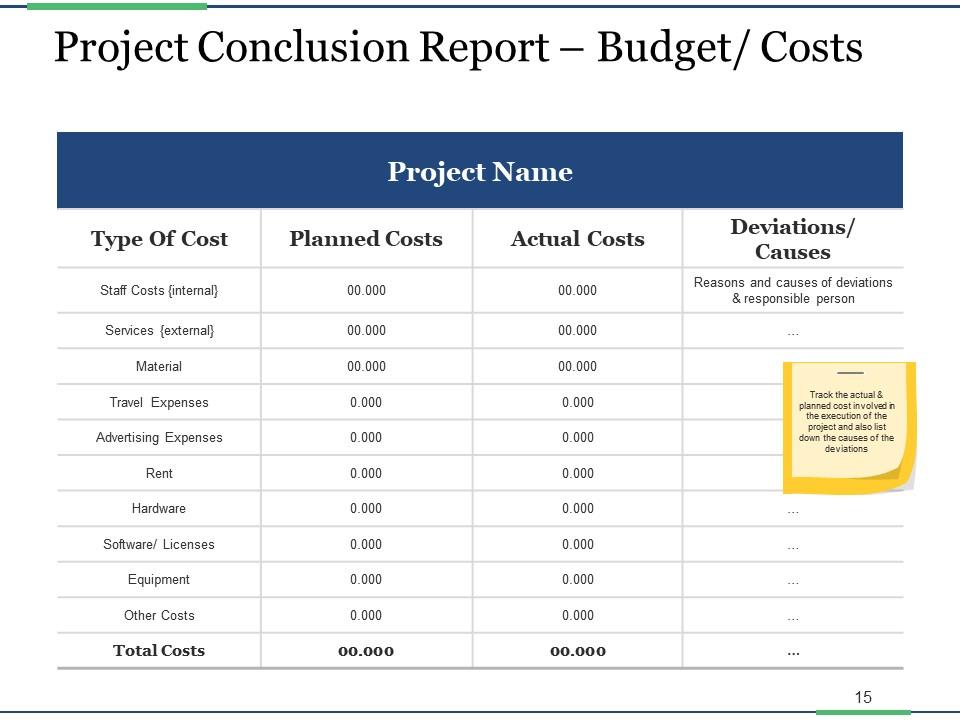
Slide 15: This slide presents Project Conclusion Report – Budget/ Costs.Track the actual & planned cost involved in the execution of the project and also list down the causes of the deviations
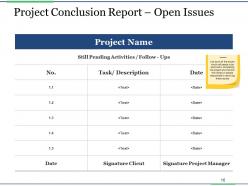
Slide 16: This slide shows Project Conclusion Report – Open Issues. List down all the issues which still needs to be resolved in completing the project and mention the names of people responsible in resolving those issues
Slide 17: This slide showcases Coffee Break.
Slide 18: This slide displays the title Charts & Graphs.
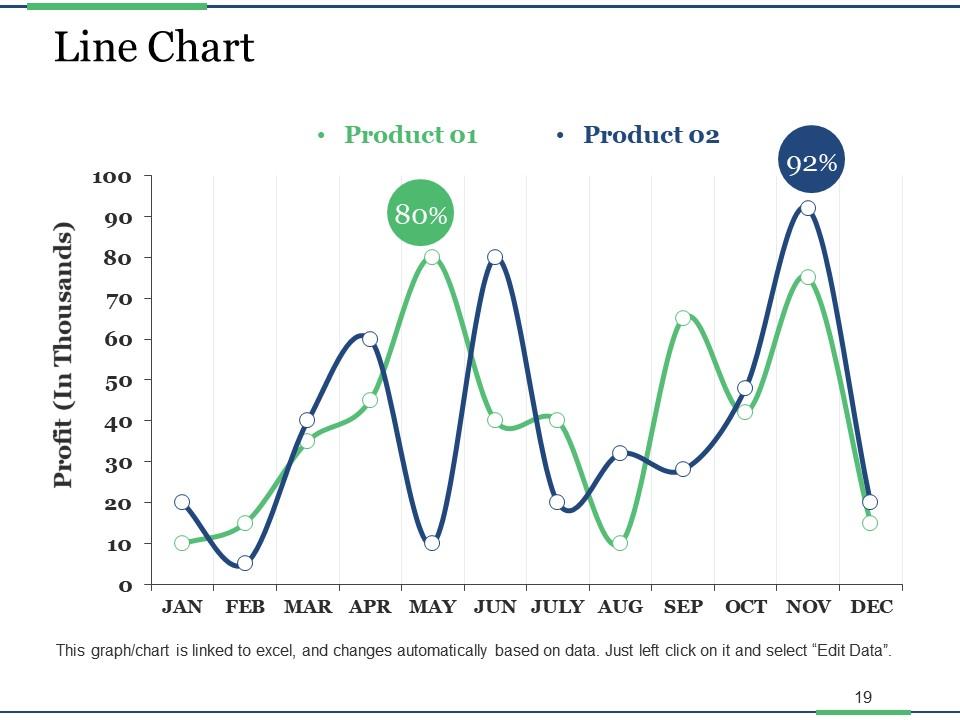
Slide 19: This slide shows a Line Chart for two product comparison.
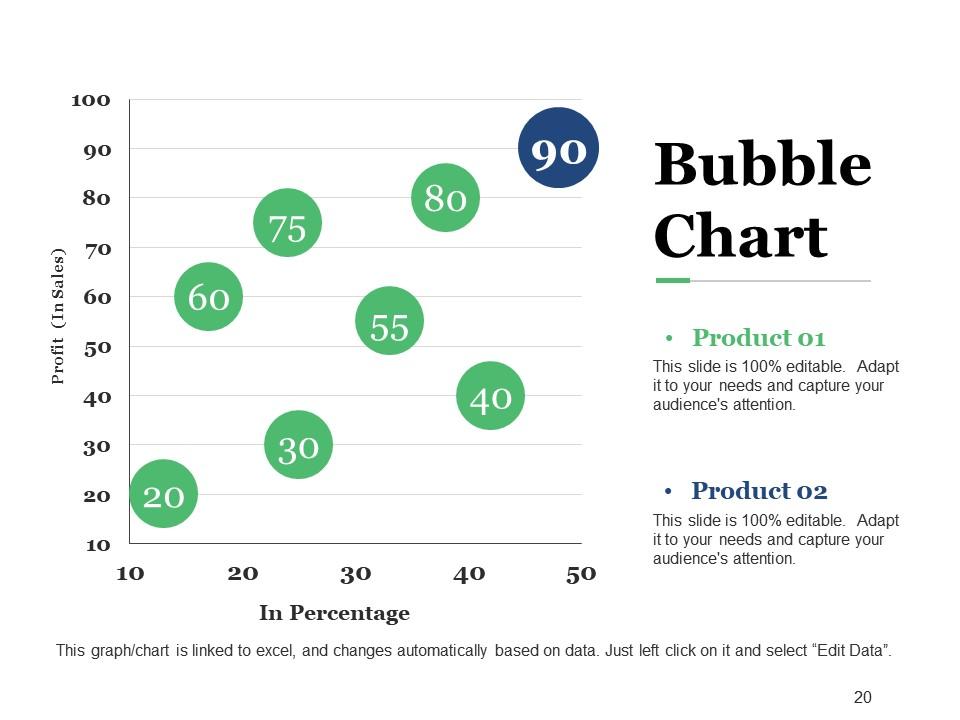
Slide 20: This slide presents Bubble Chart.
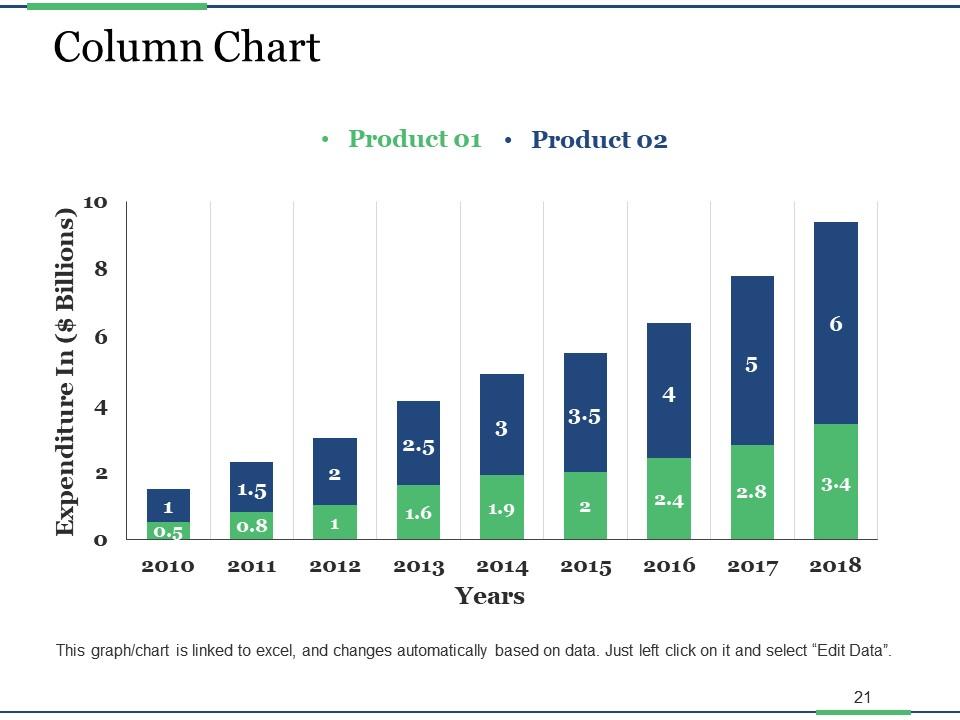
Slide 21: This slide showcases Column Chart with which you can compare the product.
Slide 22: This slide is titled Additional slides.
Slide 23: This slide contains Our Mission with text boxes
Slide 24: This slide helps depict Our Team with text boxes.
Slide 25: This is Our mission slide with imagery and text boxes to go with.
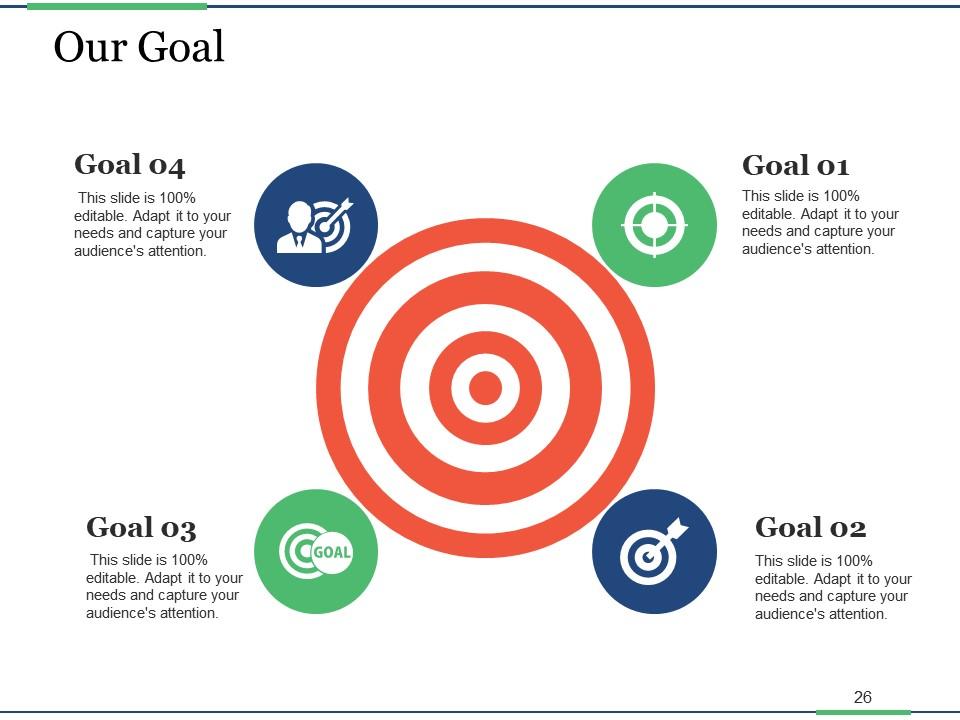
Slide 26: This is an Our Goal slide. State your important goals here.
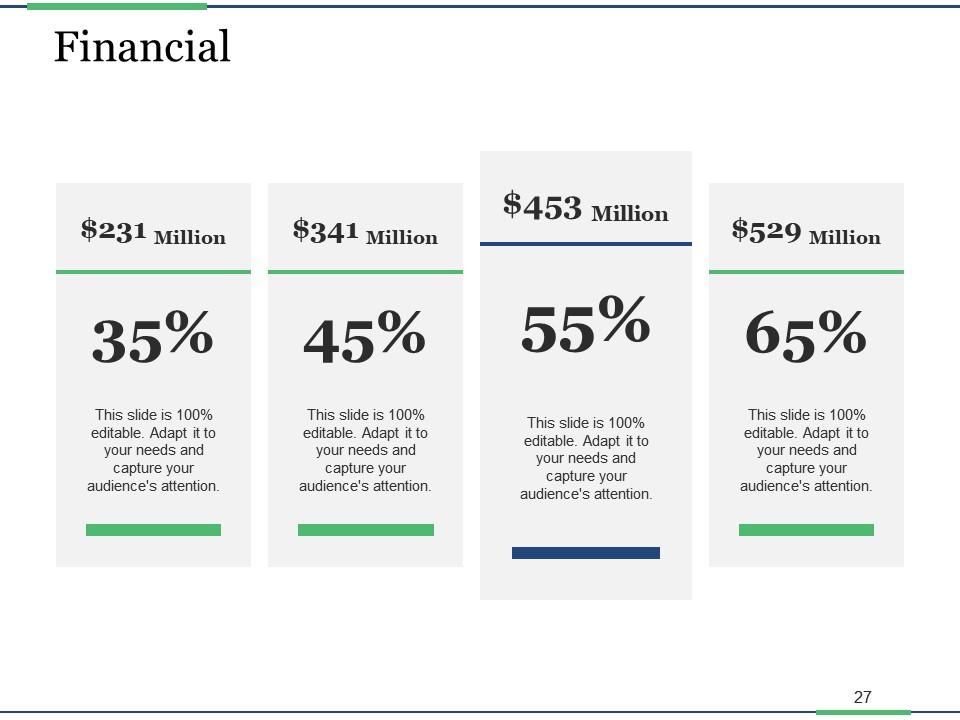
Slide 27: This slide presents Financial scores to display.
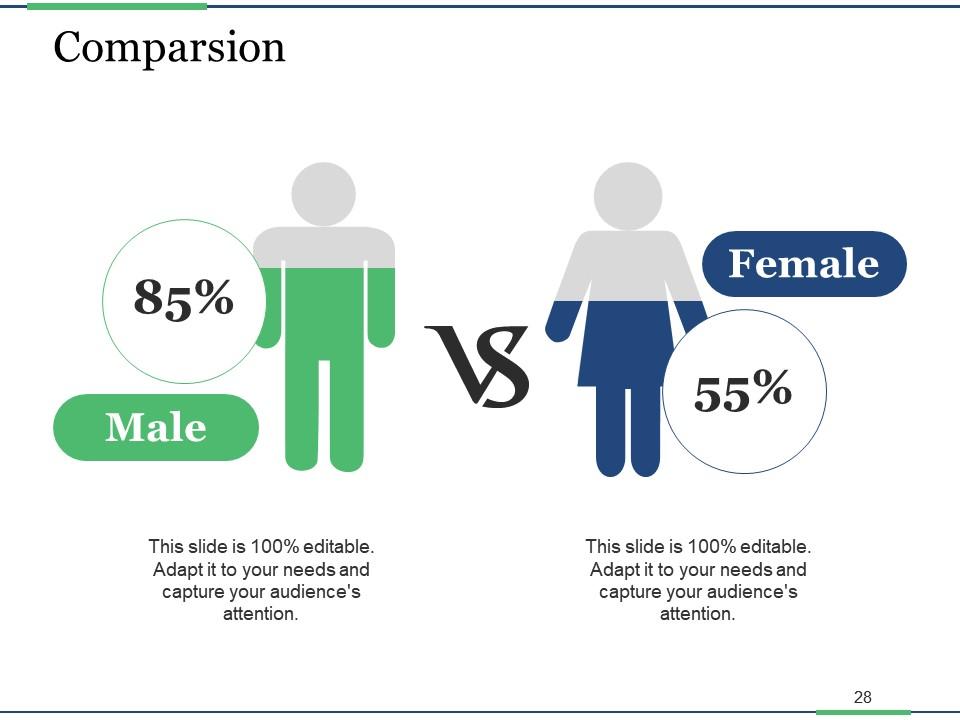
Slide 28: This slide shows Comparison of number of users and Time.
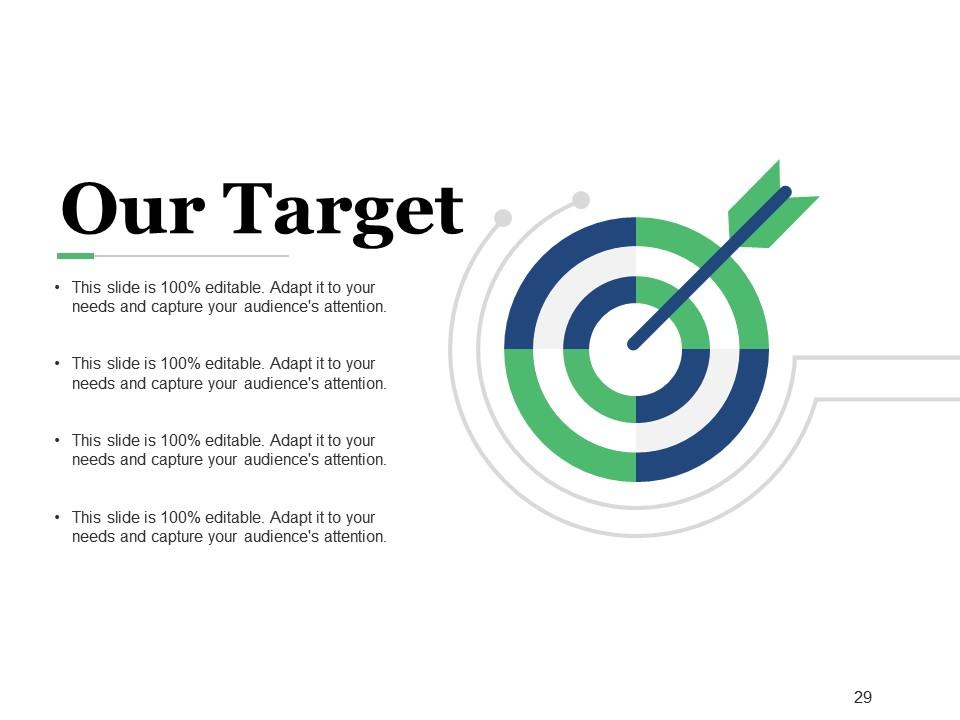
Slide 29: This slide shows Target image with text boxes.
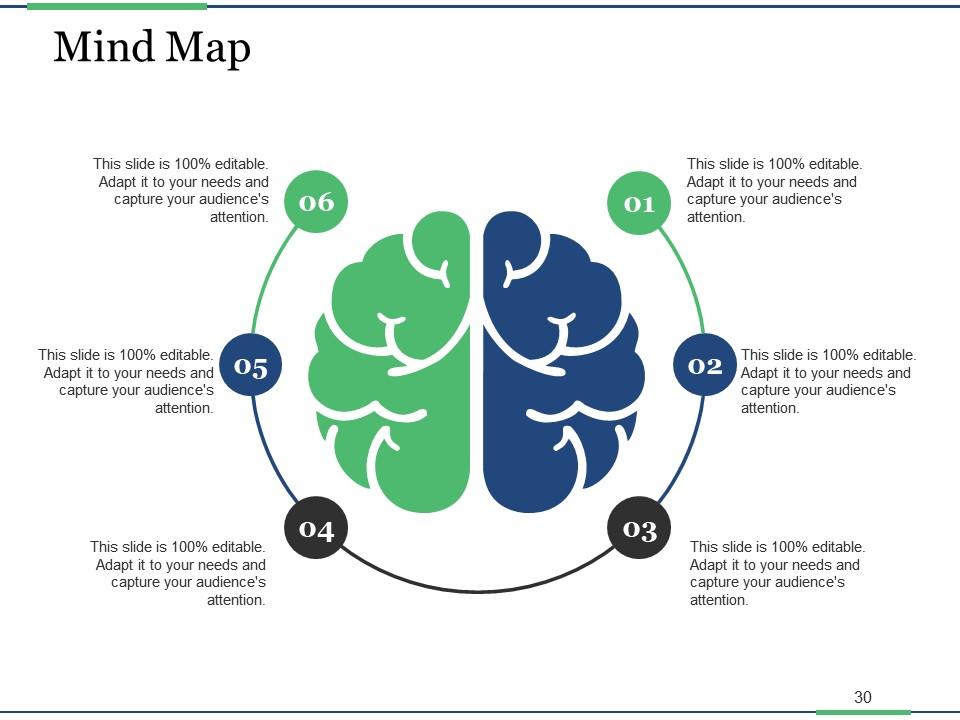
Slide 30: This slide shows a Mind map for representing entities
Slide 31: This is a Thank You image slide with Address, Email and Contact number.
Project Closure Process Steps Powerpoint Presentation Slides with all 31 slides:
Our Project Closure Process Steps Powerpoint Presentation Slides endeavor to excel at communication. They ensure you do good business.
-
Appreciate the research and its presentable format.
-
Great product with effective design. Helped a lot in our corporate presentations. Easy to edit and stunning visuals.


