Project quality management plan checklist powerpoint presentation slides
When you are looking for a project quality management plan checklist Powerpoint presentation then don't settle for the second best. Leave it up to the graphic designers of SlideTeam. We have crafted a complete pre designed slide presentation to portray various concepts of project quality management. Using this quality management plan PPT example you can not only share insights about timeline of project management, but can also cast spotlight on the quality control checklist. Going further, Powerpoint presentation slides used in this PowerPoint deck helps to depict critical analysis of current status as well as also talks about future plans. Apart from this, with help of this PPT sample file you can also define the set of activities planned initially to accomplish quality in the project being executed. To make it more simple we have included creative slide templates like evolution of quality management, 8 principles of quality management, benefits of customer focus, process approach, continual improvement and many more like these. So, what are you waiting for? Just click to download our readymade project quality plan PPT model.Jockey for advantage with our Project Quality Management Plan Checklist Powerpoint Presentation Slides. Implement your ideas before anyone else.
- Google Slides is a new FREE Presentation software from Google.
- All our content is 100% compatible with Google Slides.
- Just download our designs, and upload them to Google Slides and they will work automatically.
- Amaze your audience with SlideTeam and Google Slides.
-
Want Changes to This PPT Slide? Check out our Presentation Design Services
- WideScreen Aspect ratio is becoming a very popular format. When you download this product, the downloaded ZIP will contain this product in both standard and widescreen format.
-

- Some older products that we have may only be in standard format, but they can easily be converted to widescreen.
- To do this, please open the SlideTeam product in Powerpoint, and go to
- Design ( On the top bar) -> Page Setup -> and select "On-screen Show (16:9)” in the drop down for "Slides Sized for".
- The slide or theme will change to widescreen, and all graphics will adjust automatically. You can similarly convert our content to any other desired screen aspect ratio.
Compatible With Google Slides

Get This In WideScreen
You must be logged in to download this presentation.
PowerPoint presentation slides
Pre designed set 61 presentation slides. Ready to use deck for project managers, technical managers, strategic planners, business managers etc. Free of pixelate problem as all presentation templates are of high resolution. No space space constraints to insert titles, sub titles or logos. Exclusive manual editing option to change color, layout or background. Short downloading process starts with just a click. Goes well with Google slides.
People who downloaded this PowerPoint presentation also viewed the following :
Content of this Powerpoint Presentation
Slide 1: This slide introduces Project Quality Management Plan Checklist. State your company name and continue.
Slide 2: This is an Agenda slide. State your agendas here.
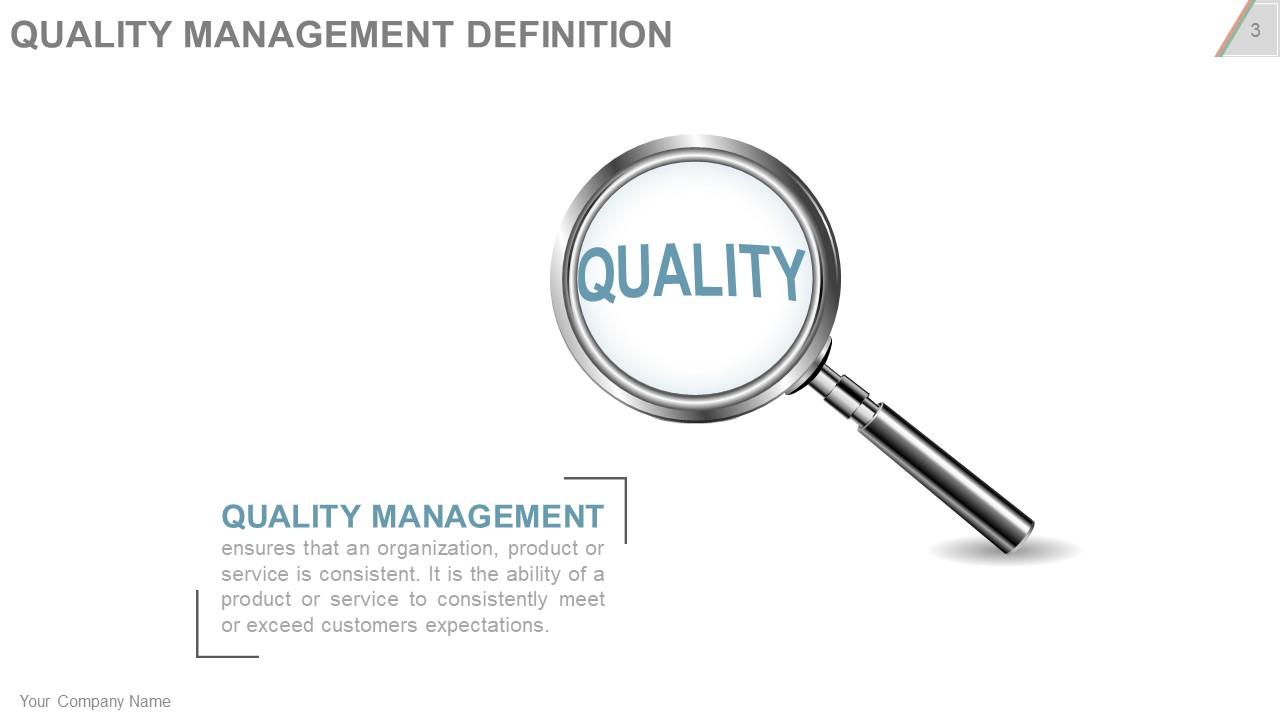
Slide 3: This slide shows Quality Management Definition with magnifying glass imagery.
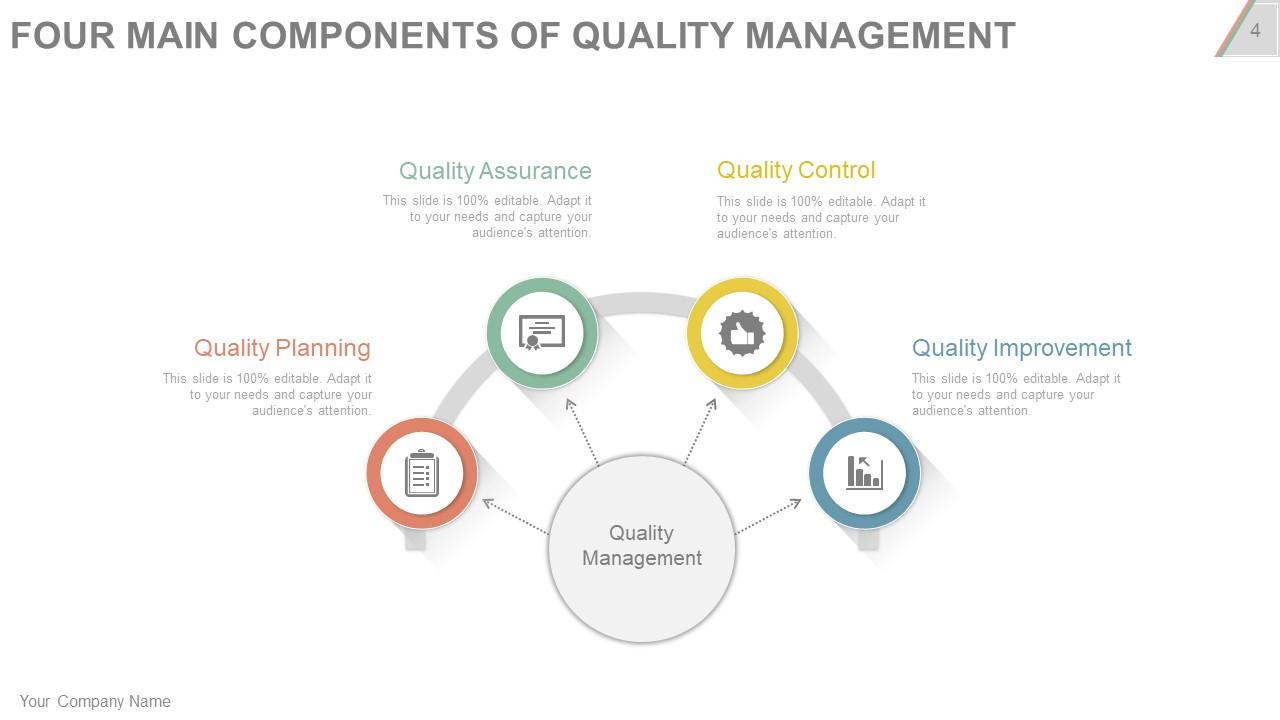
Slide 4: This slide shows the Four Main Components Of Quality Management- Quality Assurance, Quality Control, Quality Planning, Quality Improvement.
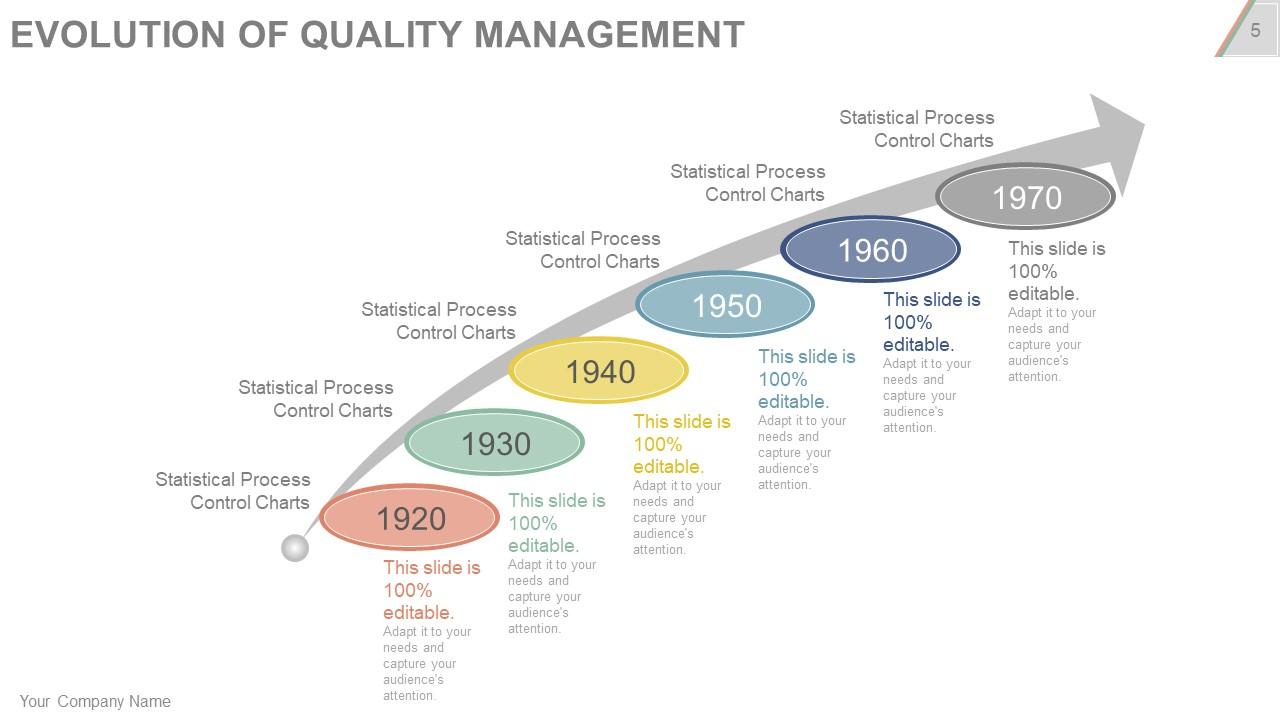
Slide 5: This slide shows the Evolution Of Quality Management with Statistical Process Control Charts.
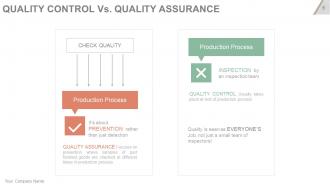
Slide 6: This is Quality Control Vs. Quality Assurance slide showing Check Quality, Production Process etc.
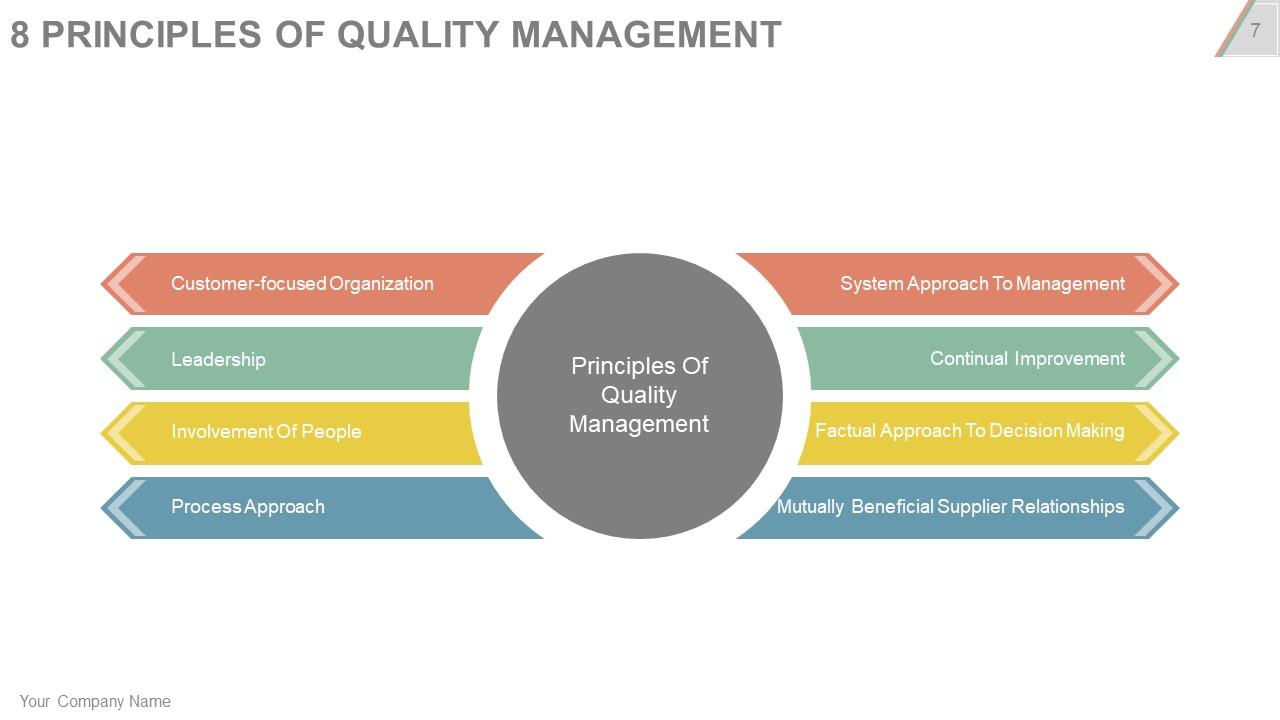
Slide 7: This slide states the 8 Principles Of Quality Management- Customer-focused Organization, Leadership, Involvement Of People, Process Approach, System Approach To Management, Continual Improvement, Factual Approach To Decision Making, Mutually Beneficial Supplier Relationships.
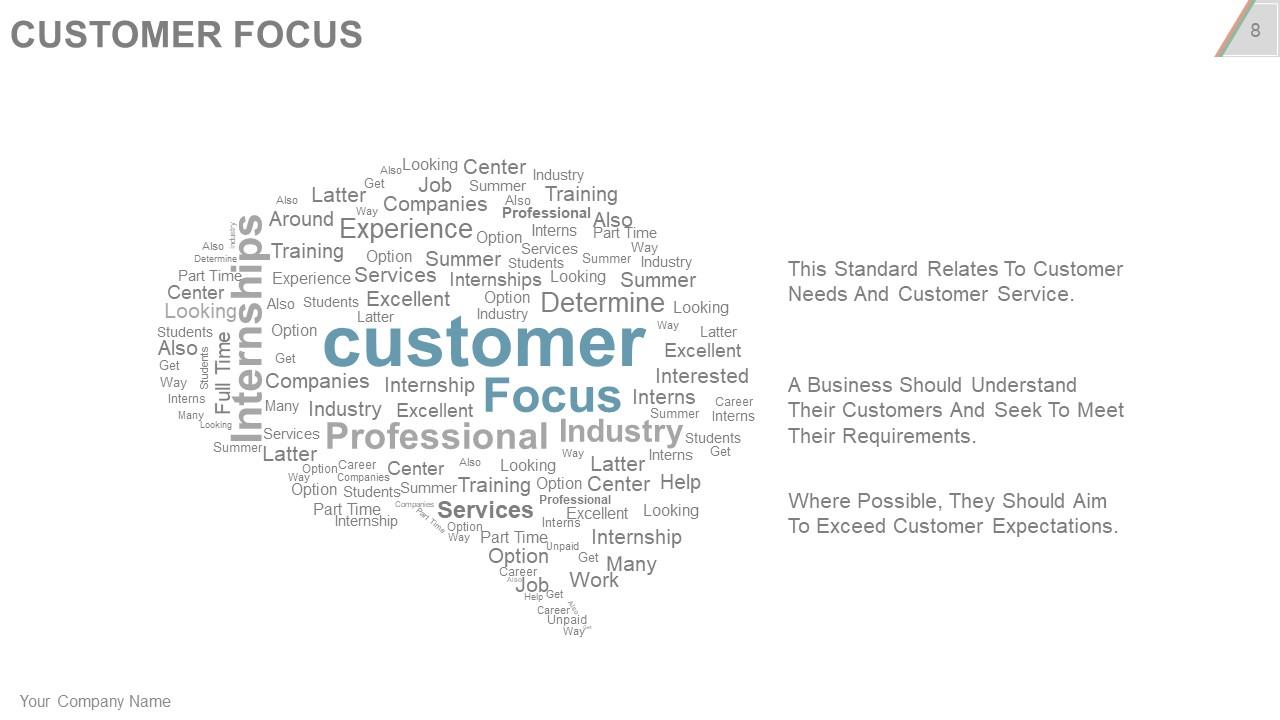
Slide 8: This slide shows Customer Focus with creative brain imagery.
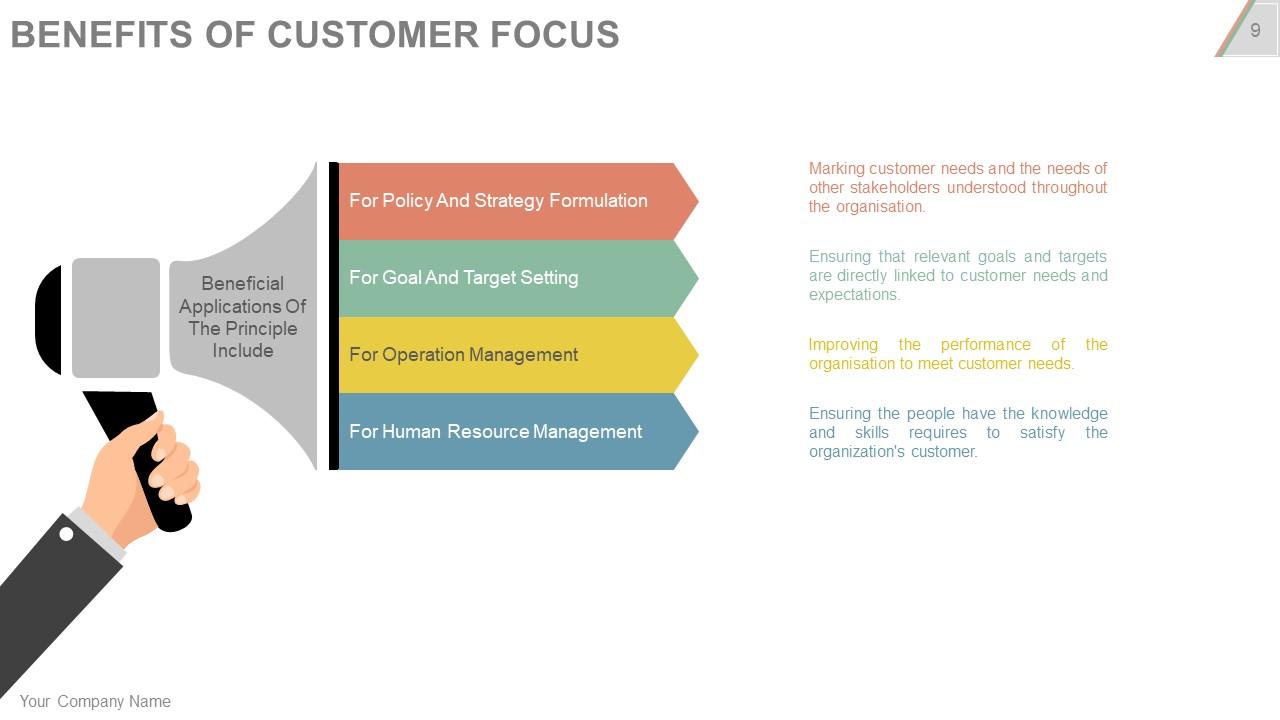
Slide 9: This slide shows four points describing the Benefits Of Customer Focus- Marking customer needs and the needs of other stakeholders understood throughout the organisation, Ensuring that relevant goals and targets are directly linked to customer needs and expectations, Improving the performance of the organisation to meet customer needs, Ensuring the people have the knowledge and skills requires to satisfy the organization's customer.
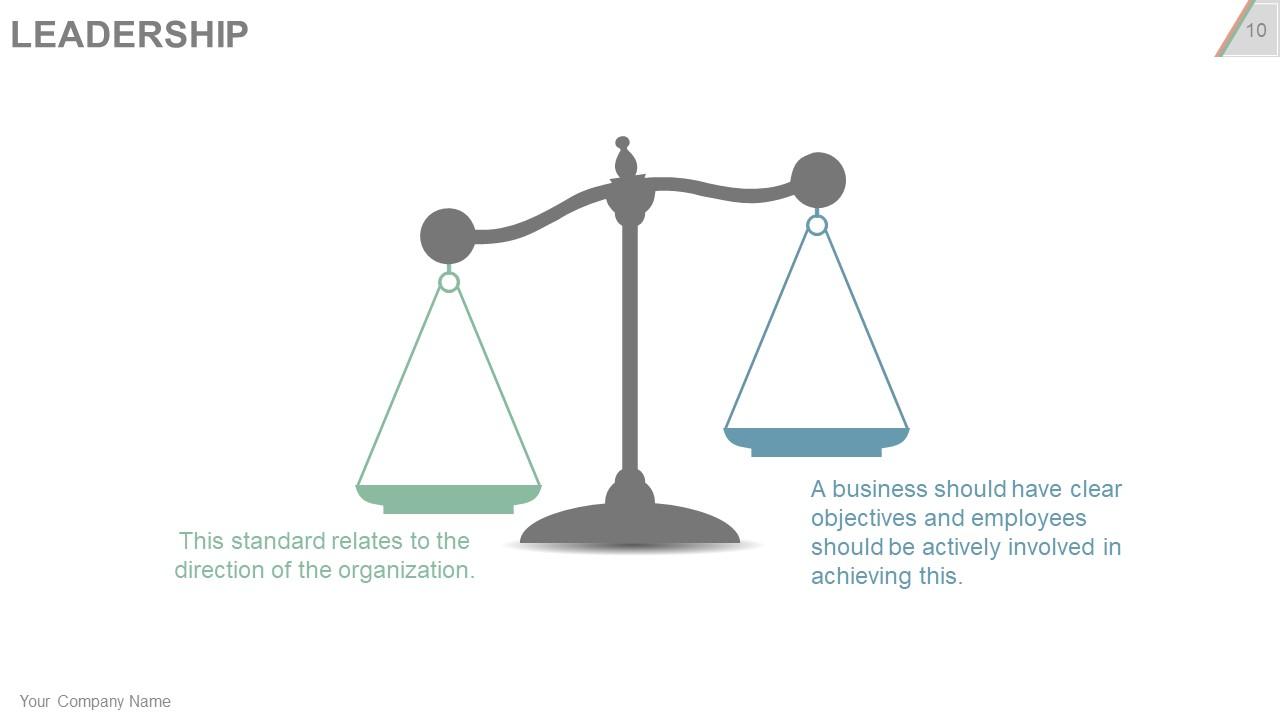
Slide 10: This slide shows Leadership with a balancing scale imagery and two points- A business should have clear objectives and employees should be actively involved in achieving this, This standard relates to the direction of the organization.
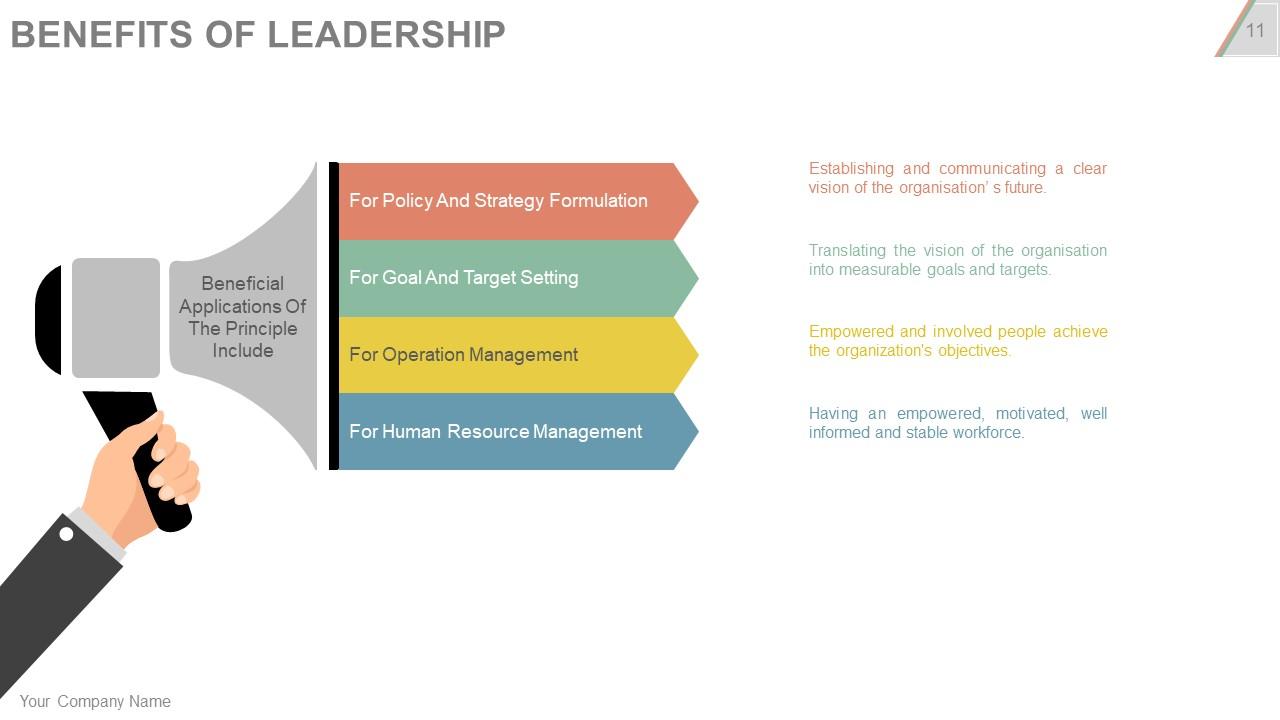
Slide 11: This is another slide describing the Benefits Of Customer Focus with the following four points- Establishing and communicating a clear vision of the organisation’ s future, Translating the vision of the organisation into measurable goals and targets, Empowered and involved people achieve the organization's objectives, Having an empowered, motivated, well informed and stable workforce.
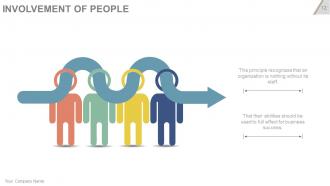
Slide 12: This slide shows Involvement Of People with creative imagery.
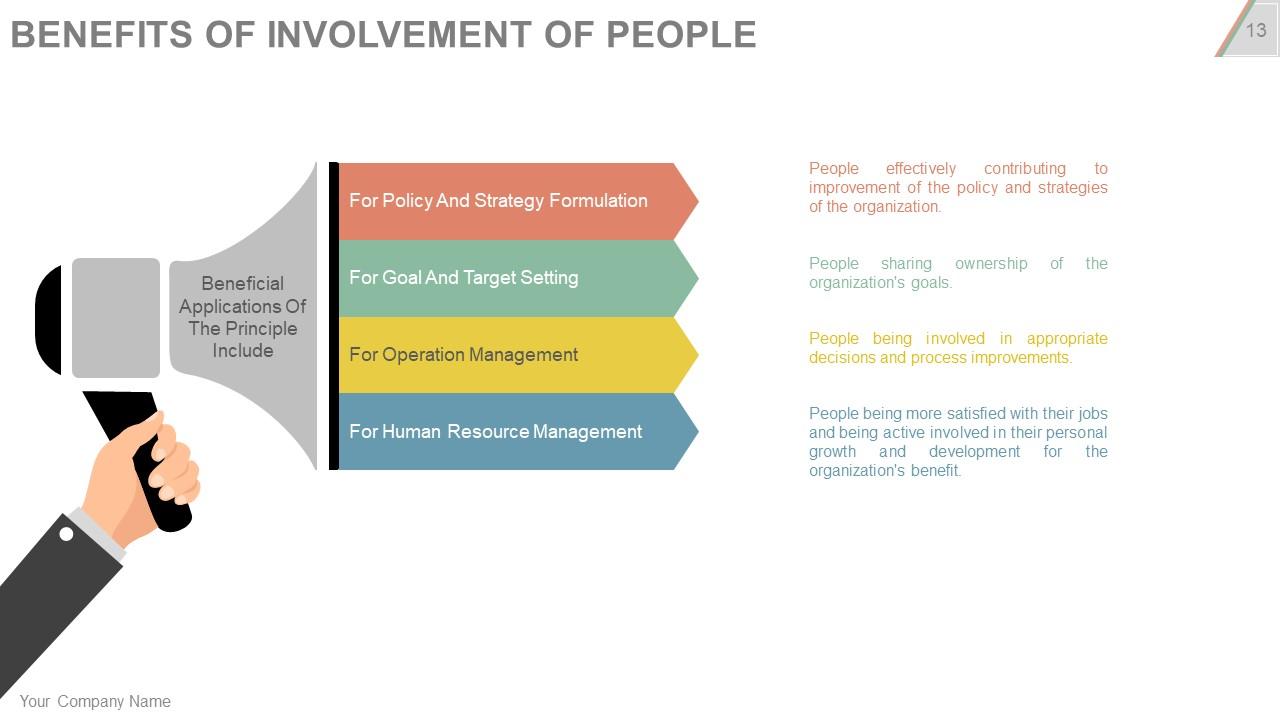
Slide 13: This slide presents four points describing the Benefits Of Involvement Of People- People effectively contributing to improvement of the policy and strategies of the organization. People sharing ownership of the organization's goals. People being involved in appropriate decisions and process improvements. People being more satisfied with their jobs and being active involved in their personal growth and development for the organization's benefit.
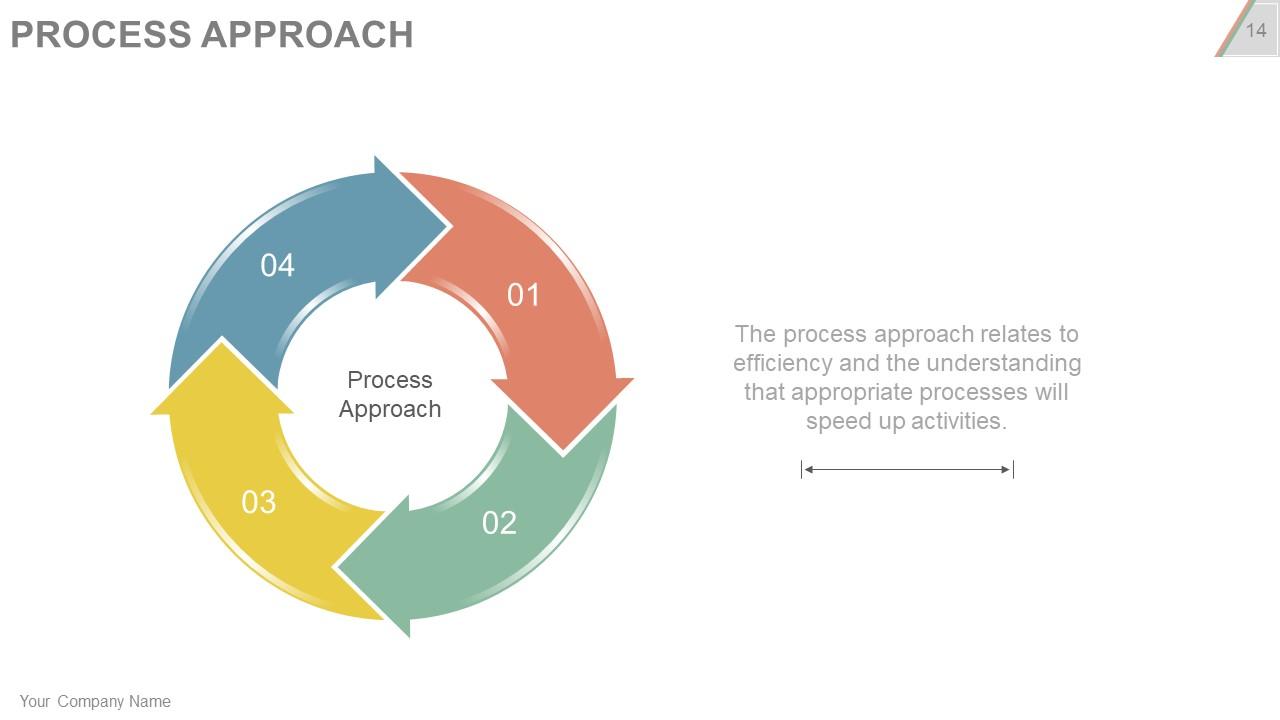
Slide 14: This slide shows Process Approach in a circular flow diagram form.
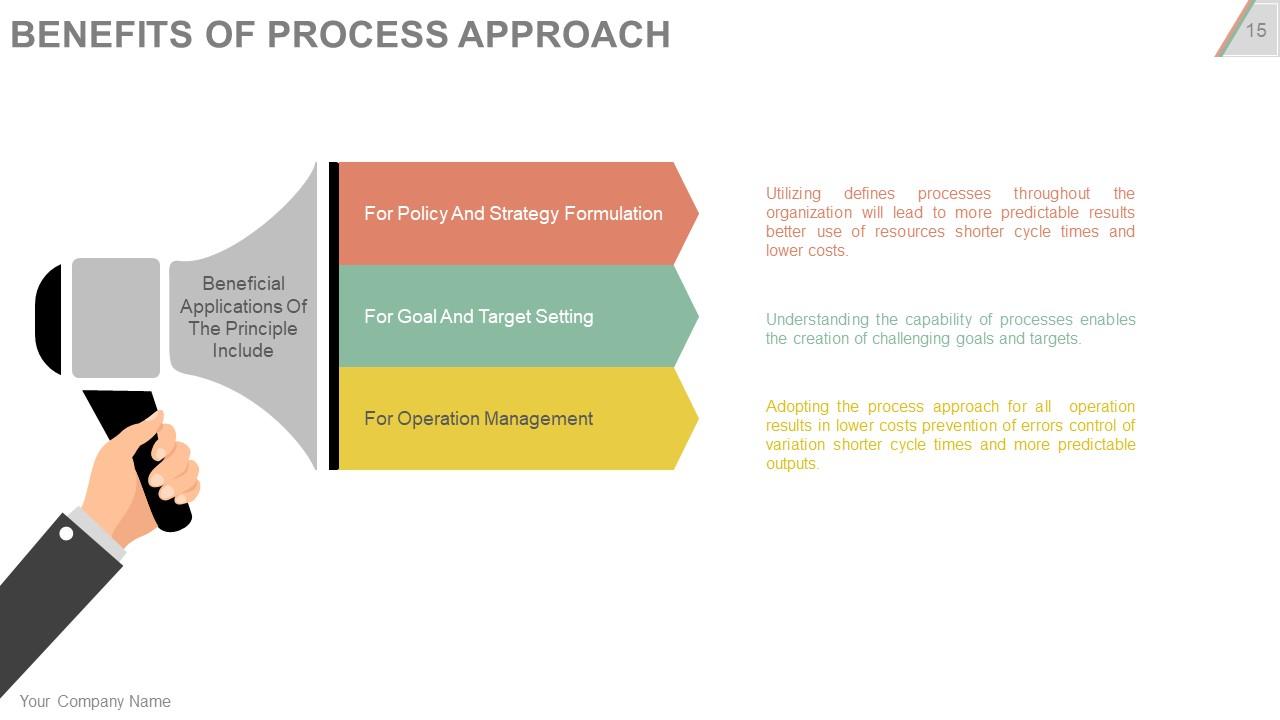
Slide 15: This slide shows the Benefits of Process Approach- Utilizing defines processes throughout the organization will lead to more predictable results better use of resources shorter cycle times and lower costs, Understanding the capability of processes enables the creation of challenging goals and targets, Adopting the process approach for all operation results in lower costs prevention of errors control of variation shorter cycle times and more predictable outputs.
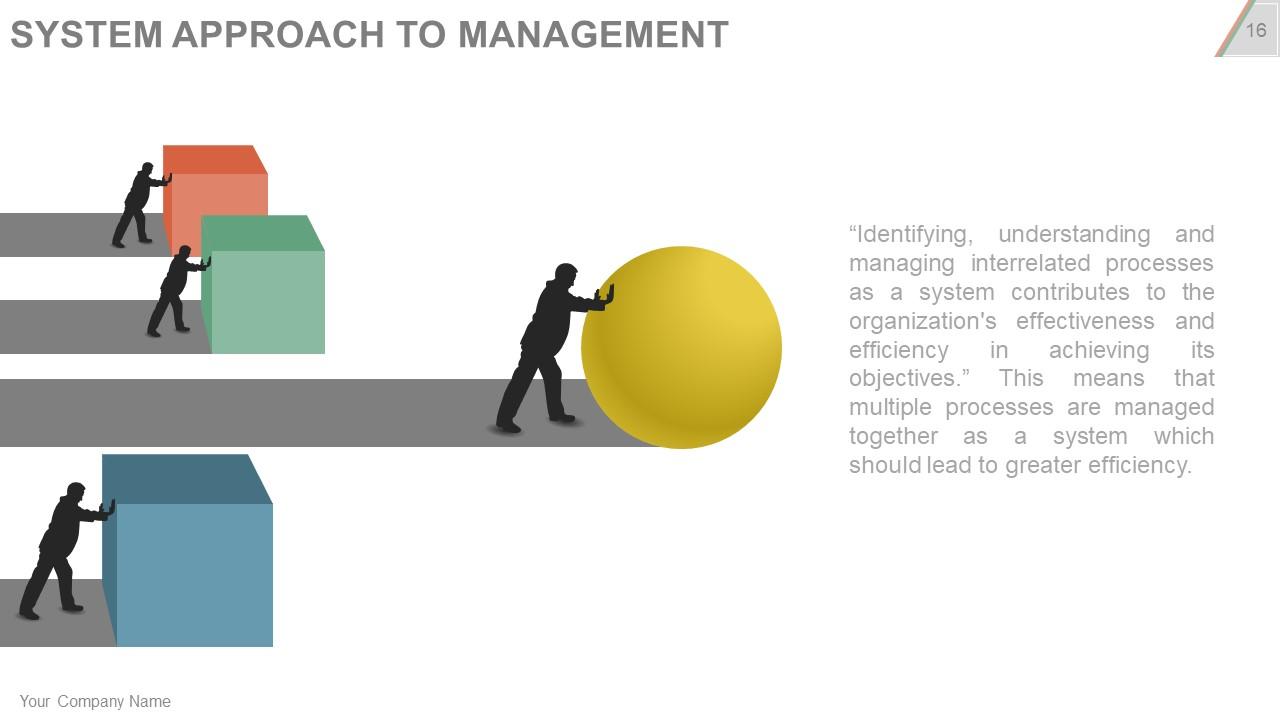
Slide 16: This slide shows System Approach To Management with creative imagery.
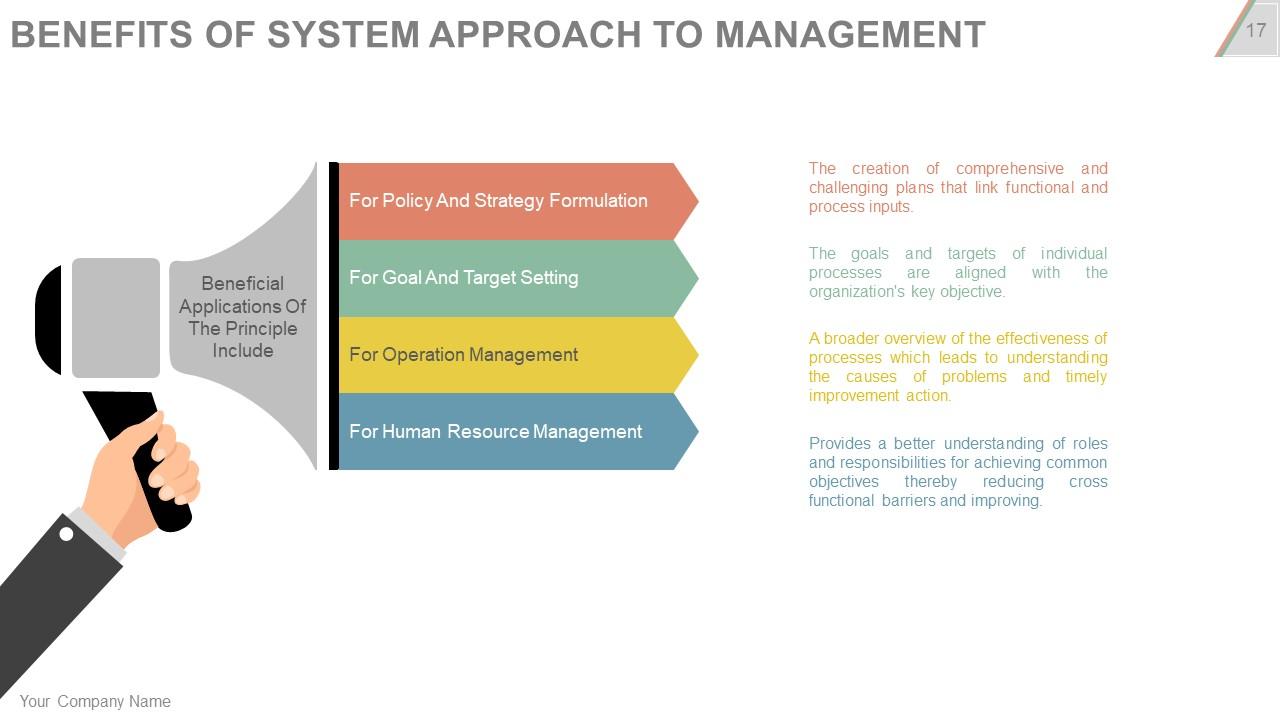
Slide 17: This slide states the Benefits Of System Approach To Management- The creation of comprehensive and challenging plans that link functional and process inputs. The goals and targets of individual processes are aligned with the organization's key objective. A broader overview of the effectiveness of processes which leads to understanding the causes of problems and timely improvement action. Provides a better understanding of roles and responsibilities for achieving common objectives thereby reducing cross functional barriers and improving.
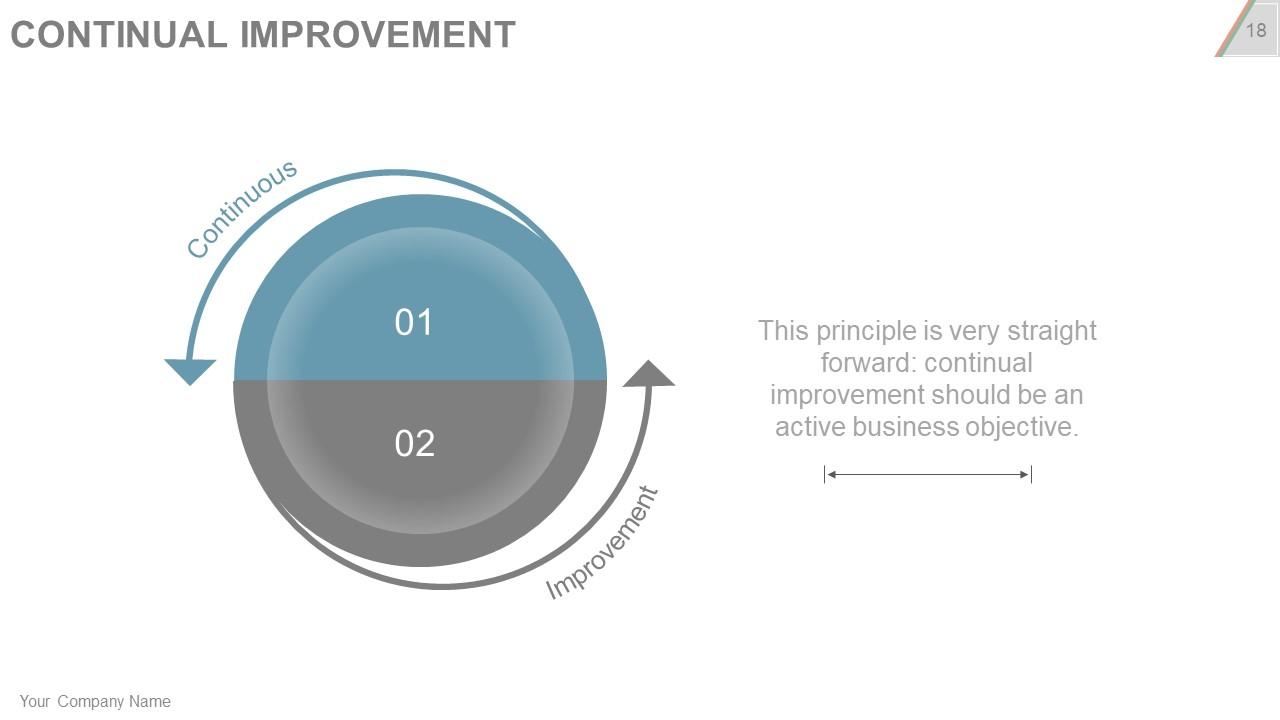
Slide 18: This slide shows Continual Improvement.
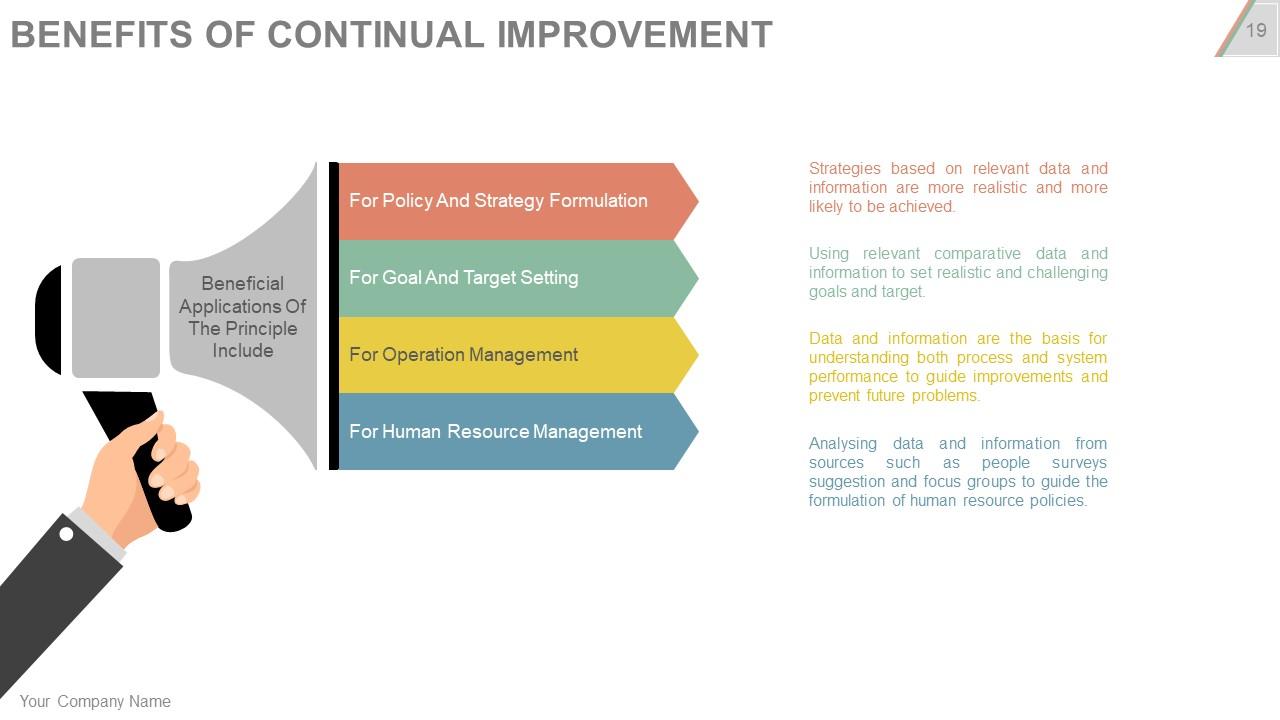
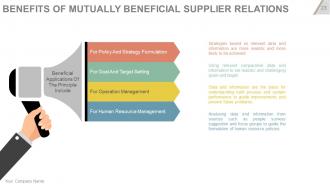
Slide 19: This slide states four Benefits Of Continual Improvement- Strategies based on relevant data and information are more realistic and more likely to be achieved, Using relevant comparative data and information to set realistic and challenging goals and target, Data and information are the basis for understanding both process and system performance to guide improvements and prevent future problems, Analysing data and information from sources such as people surveys suggestion and focus groups to guide the formulation of human resource policies.
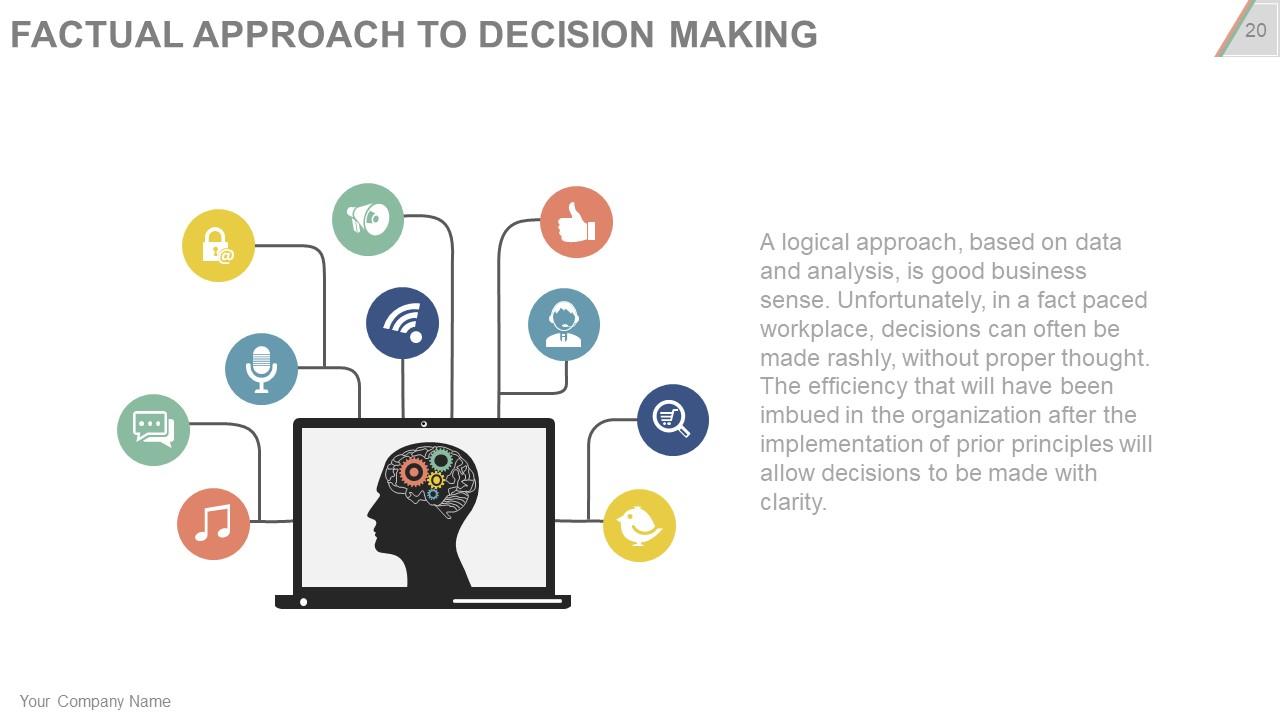
Slide 20: This slide shows the Factual Approach To Decision Making with creative human brain imagery to go with.
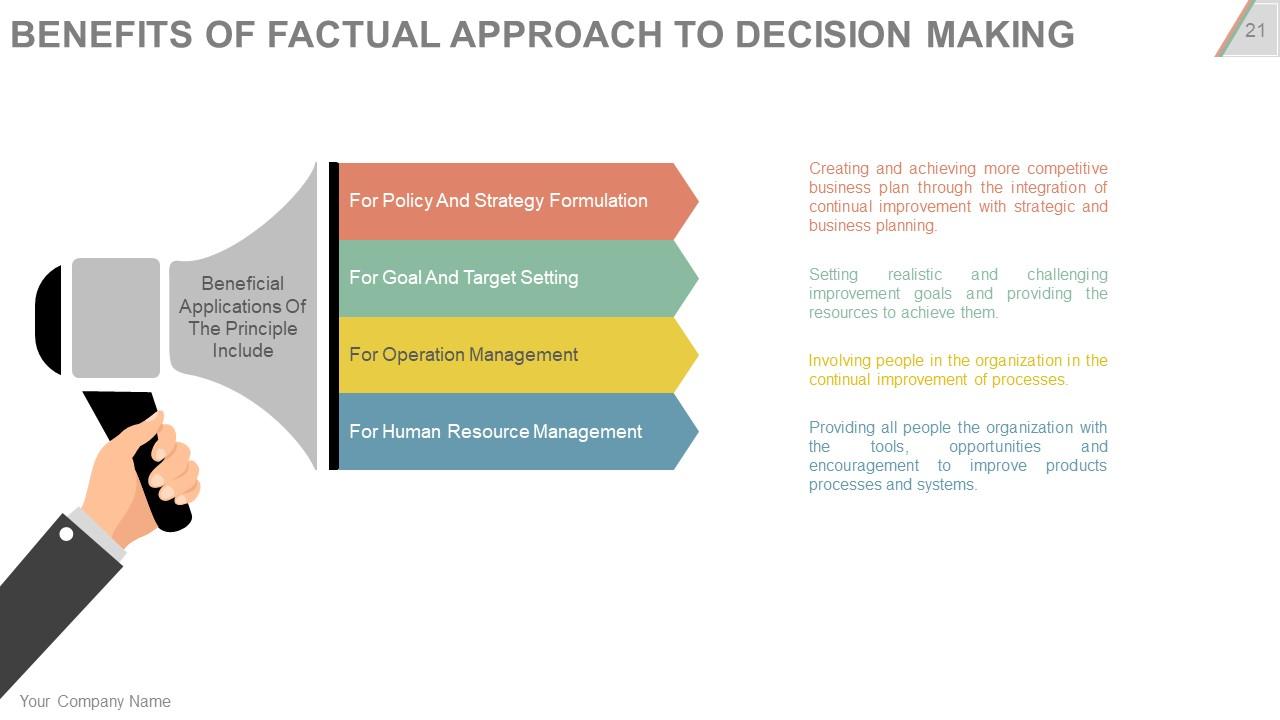
Slide 21: This slide states the Benefits Of Factual Approach To Decision Making with loud speaker imagery.
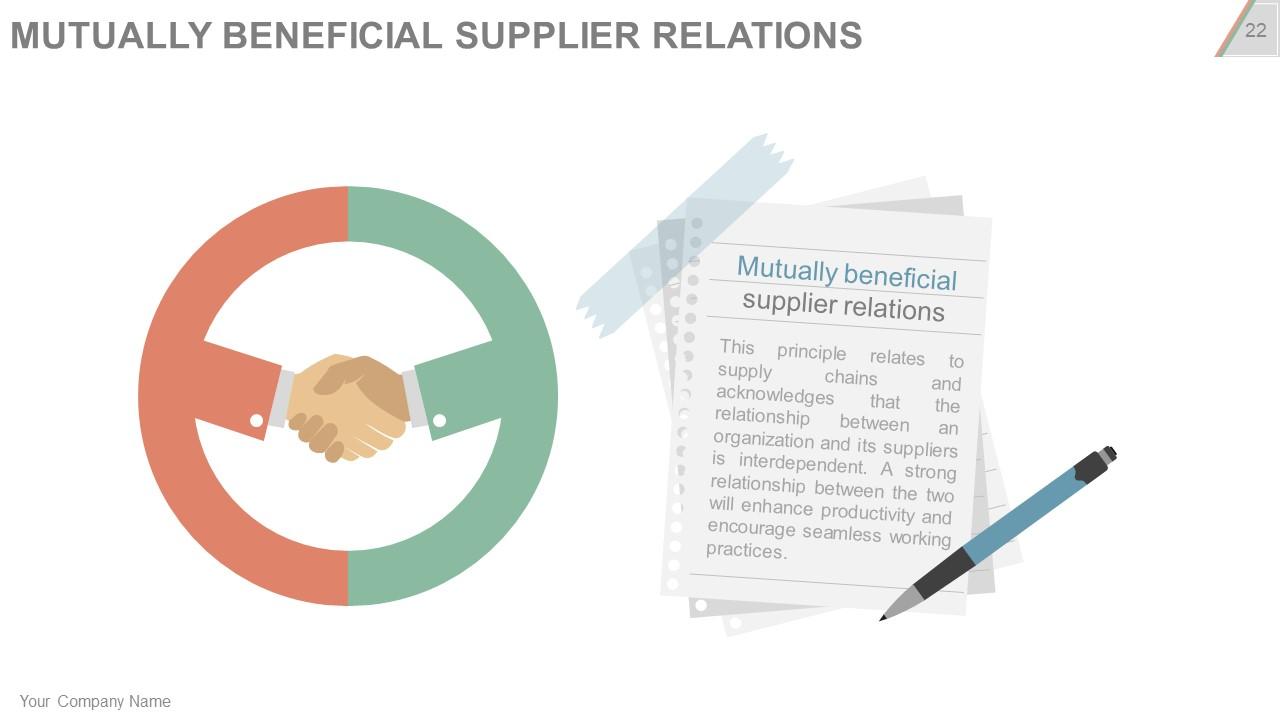
Slide 22: This slide shows Mutually Beneficial Suplier Relations with relevant imagery.
Slide 23: This slide shows the Benefits Of Mutually Beneficial Suplier Relations- Strategies based on relevant data and information are more realistic and more likely to be achieved. Using relevant comparative data and information to set realistic and challenging goals and target. Data and information are the basis for understanding both process and system performance to guide improvements and prevent future problems. Analysing data and information from sources such as people surveys suggestion and focus groups to guide the formulation of human resource policies.
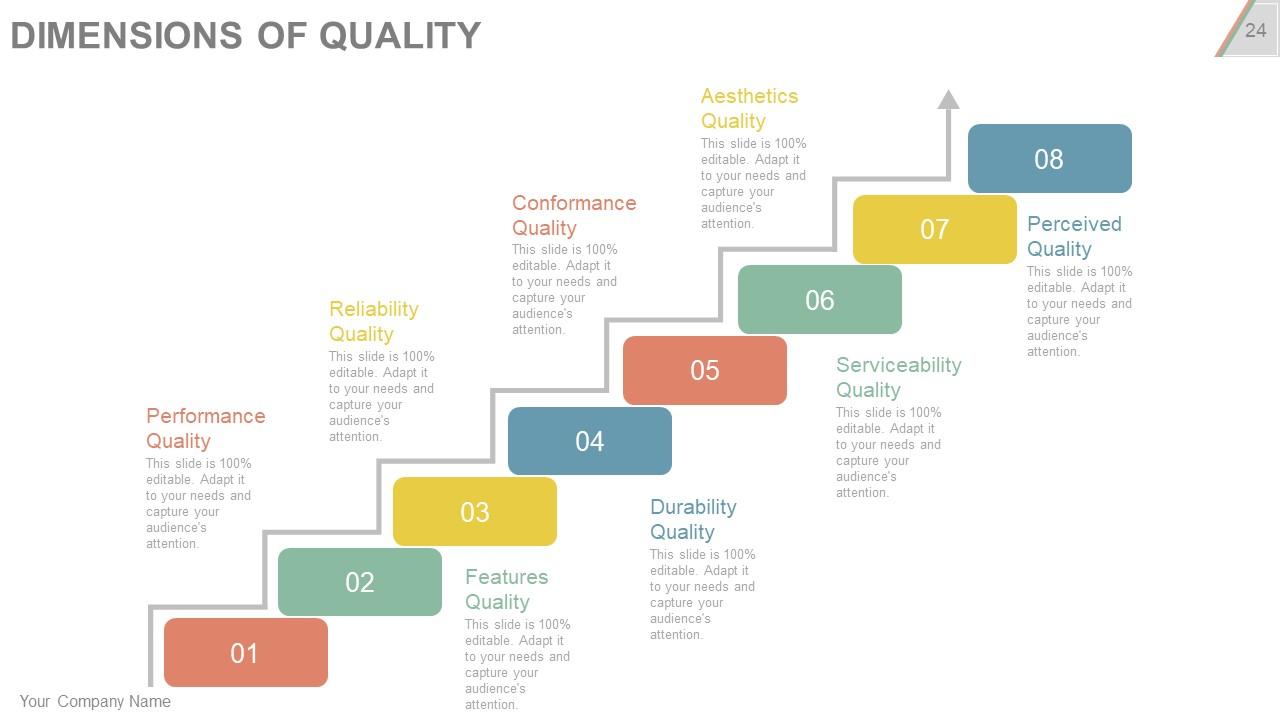
Slide 24: This slide presents a list of Dimensions Of Quality- Performance Quality, Reliability Quality, Conformance Quality, Aesthetics Quality, Features Quality, Durability Quality, Serviceability Quality, Perceived Quality.
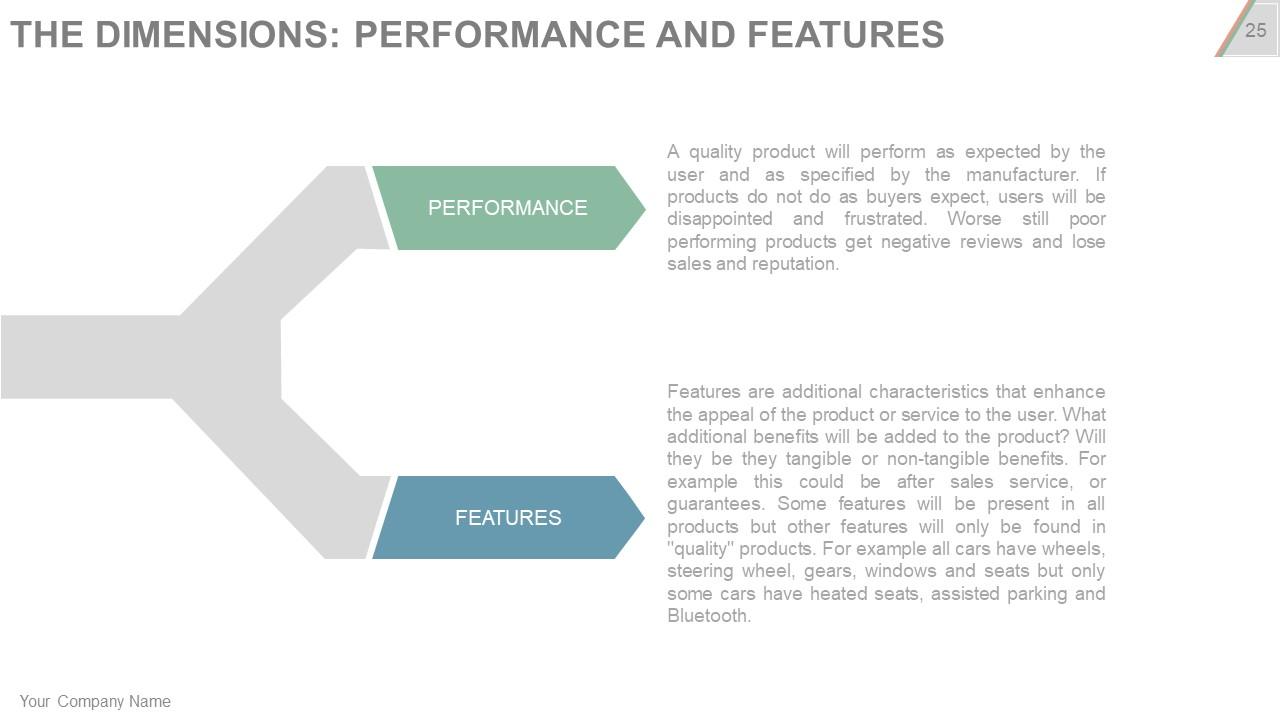
Slide 25: This slide shows The Dimensions: Performance And Features.
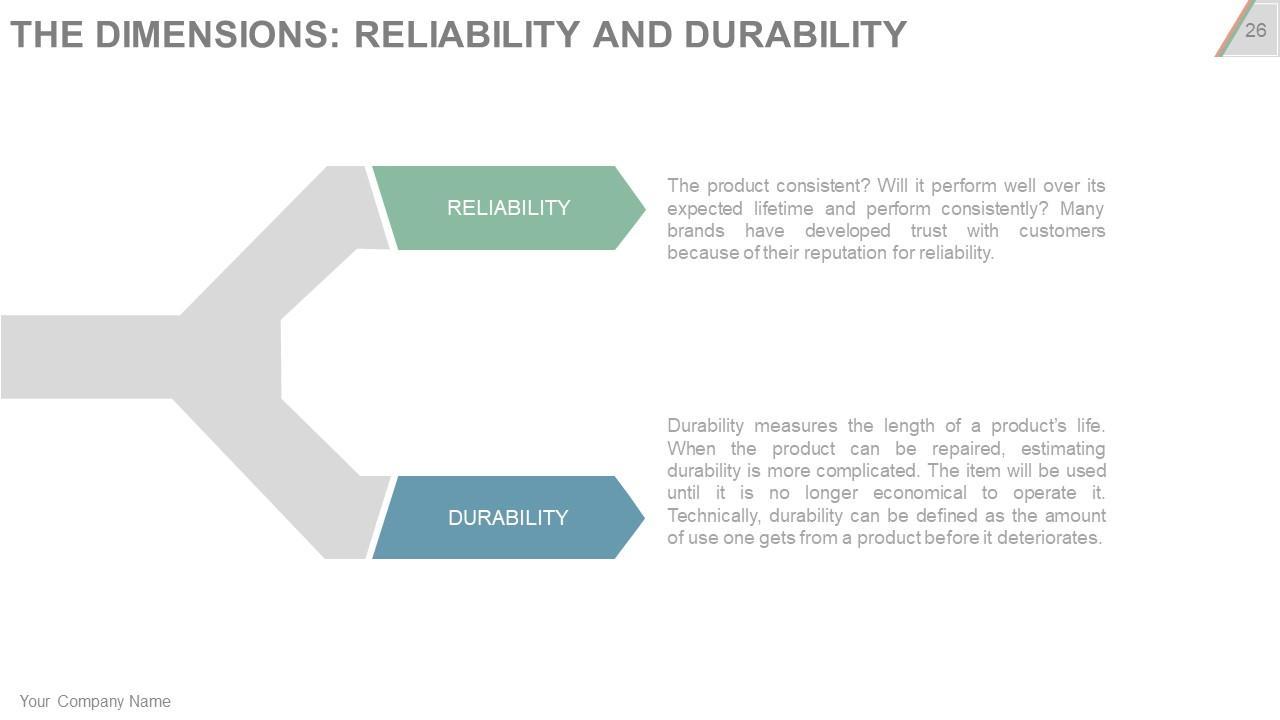
Slide 26: This slide shows The Dimensions: Reliability And Durability.
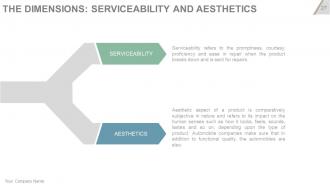
Slide 27: This slide shows The Dimensions: Serviceability And Aesthetics.
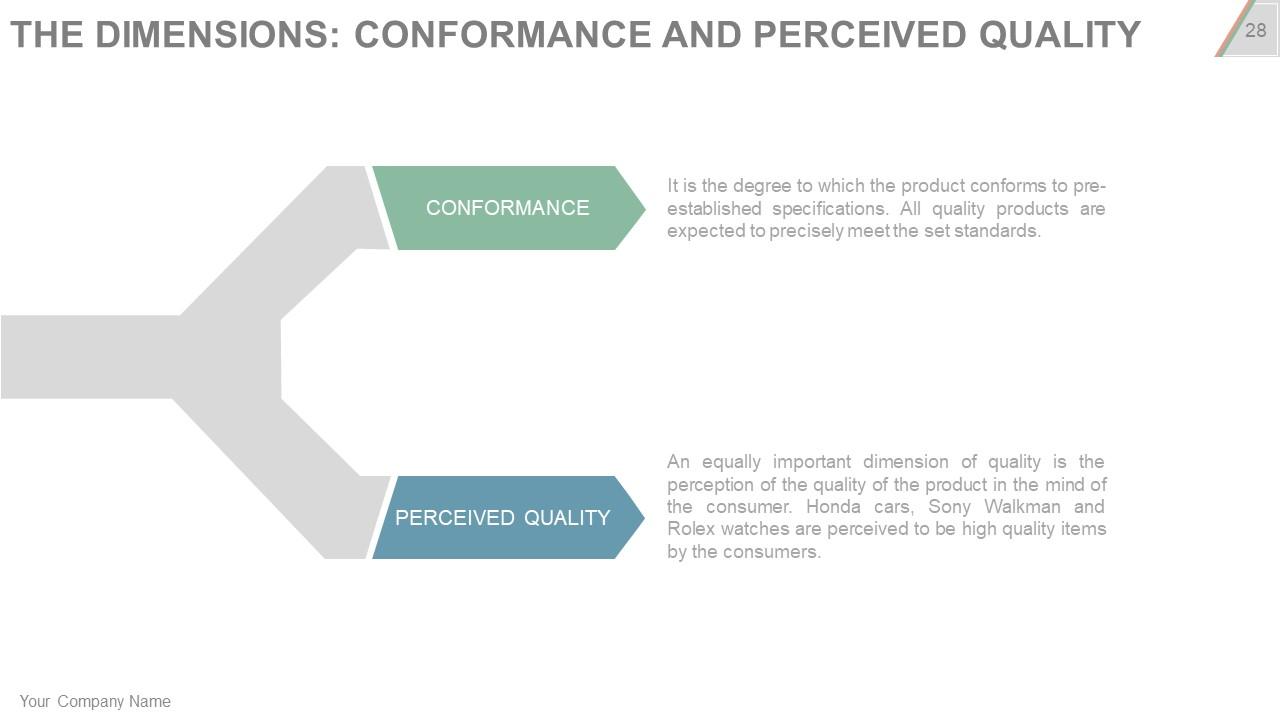
Slide 28: This slide shows The Dimensions: Conformance And Perceived Quality.
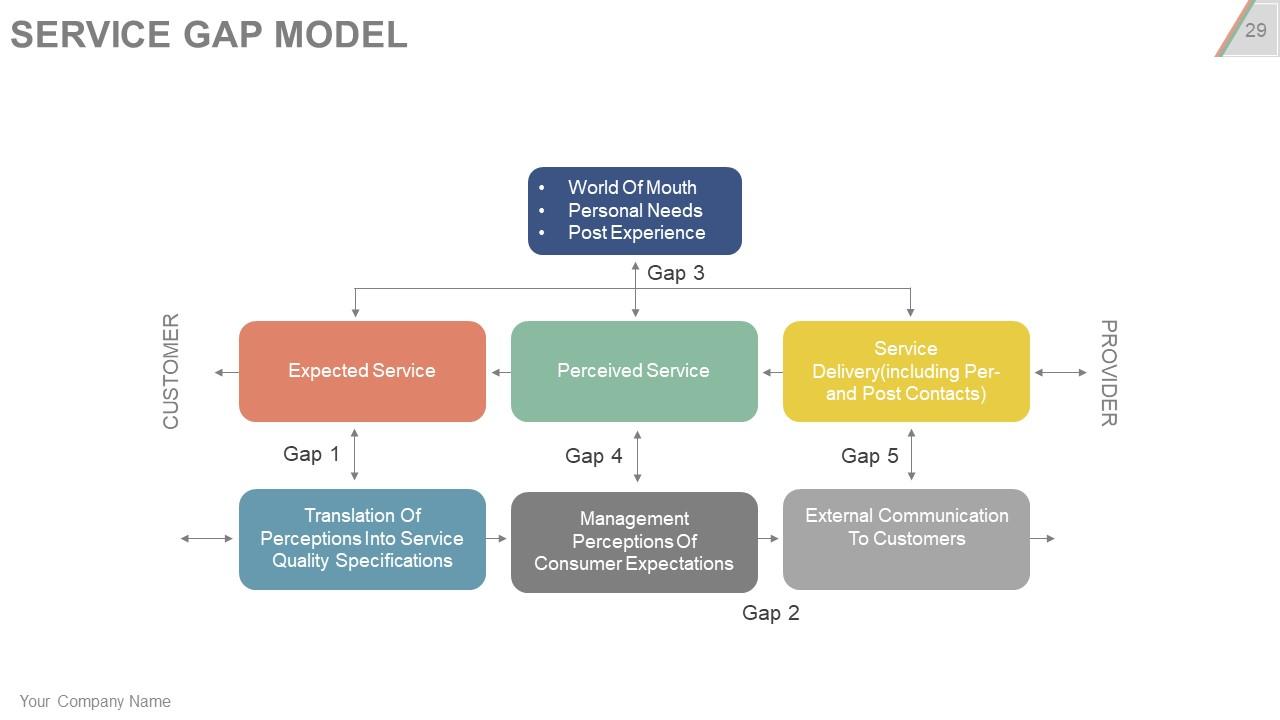
Slide 29: This slide presents the Service GAP Model in a flow chart form.
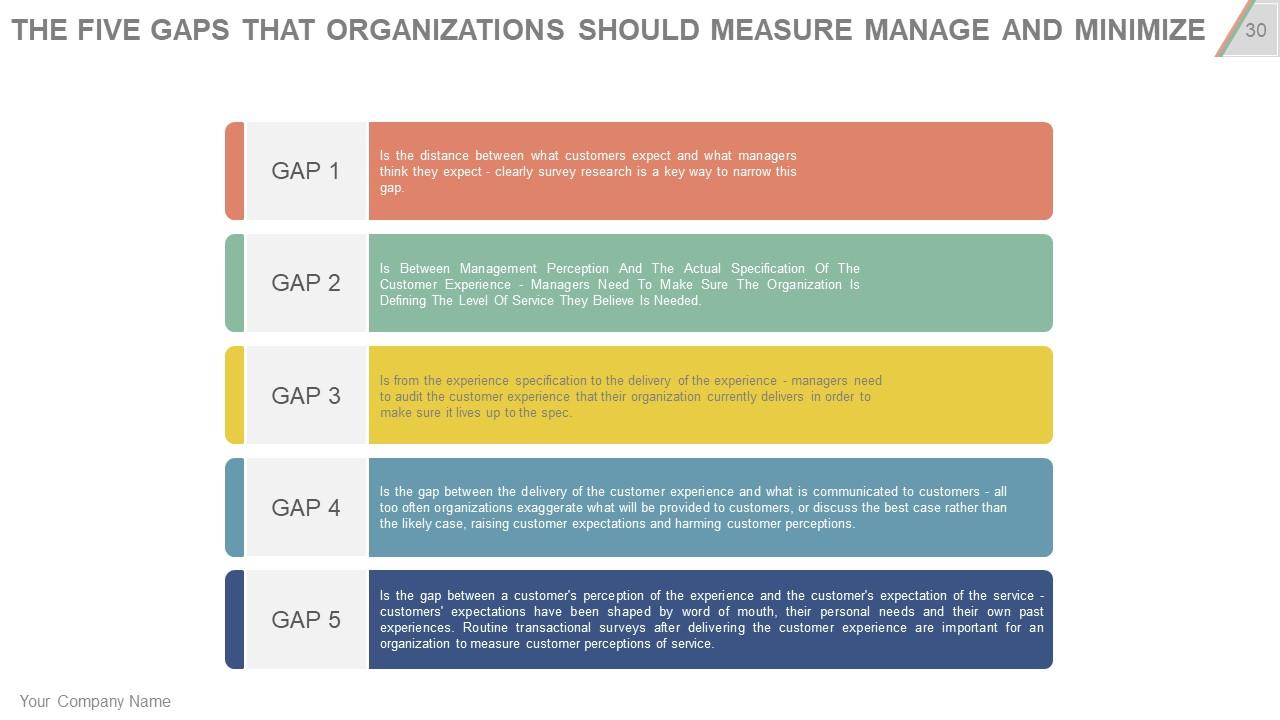
Slide 30: This slide shows The Five Gaps That Organizations Should MeasureManage And Minimize- GAP 1- Is the distance between what customers expect and what managers think they expect - clearly survey research is a key way to narrow this gap. GAP 2- Is Between Management Perception And The Actual Specification Of The Customer Experience - Managers Need To Make Sure The Organization Is Defining The Level Of Service They Believe Is Needed. GAP 3-Is from the experience specification to the delivery of the experience - managers need to audit the customer experience that their organization currently delivers in order to make sure it lives up to the spec. GAP 4- Is the gap between the delivery of the customer experience and what is communicated to customers - all too often organizations exaggerate what will be provided to customers, or discuss the best case rather than the likely case, raising customer expectations and harming customer perceptions. GAP 5- Is the gap between a customer's perception of the experience and the customer's expectation of the service - customers' expectations have been shaped by word of mouth, their personal needs and their own past experiences. Routine transactional surveys after delivering the customer experience are important for an organization to measure customer perceptions of service.
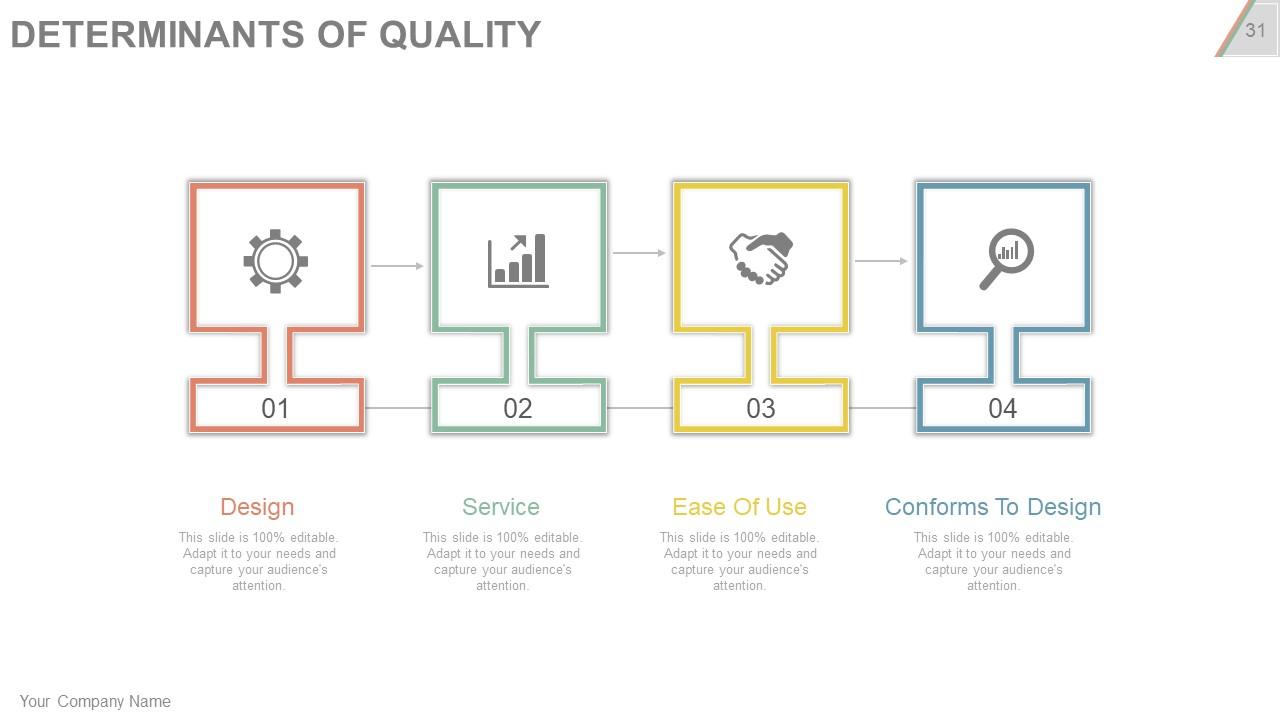
Slide 31: This slide shows four Determinants Of Quality with icon imagery- Design, Service, Ease Of Use, Conforms To Design.
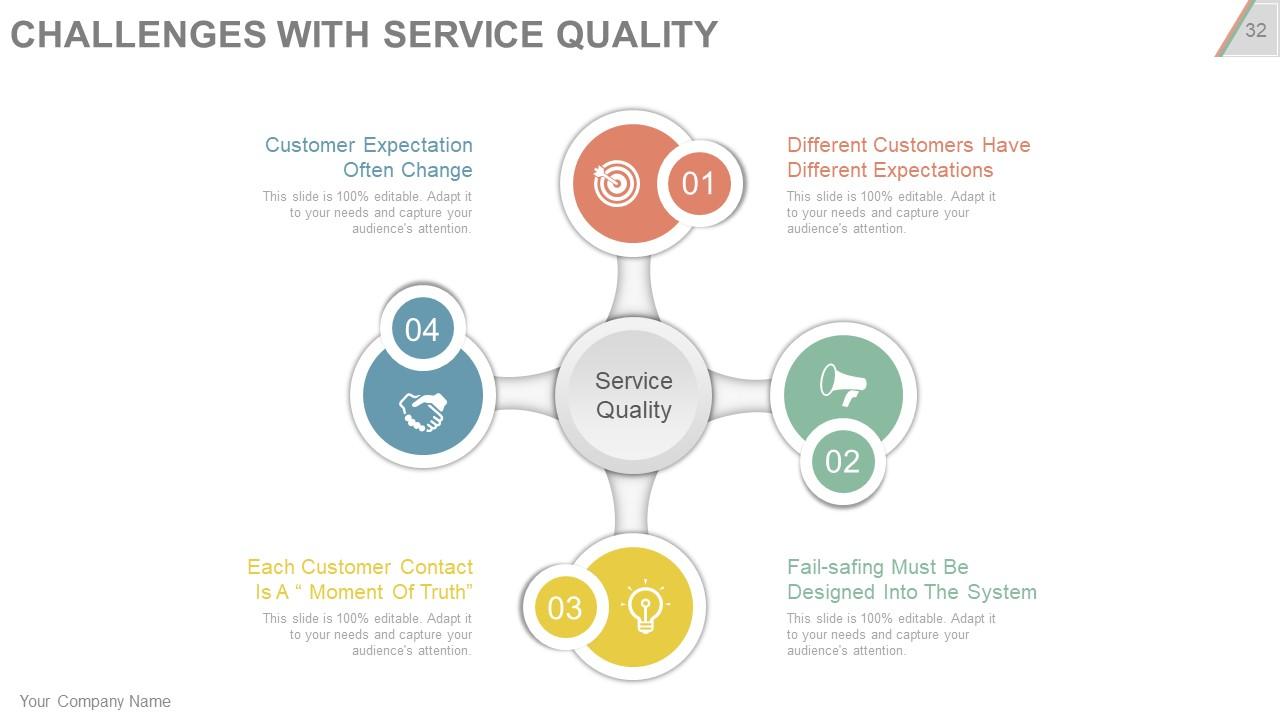
Slide 32: This slide states four Challenges With Service Quality that a company faces- Customer Expectation Often Change, Different Customers Have Different Expectations, Each Customer Contact Is A “ Moment Of Truth”, Fail-safing Must Be Designed Into The System.
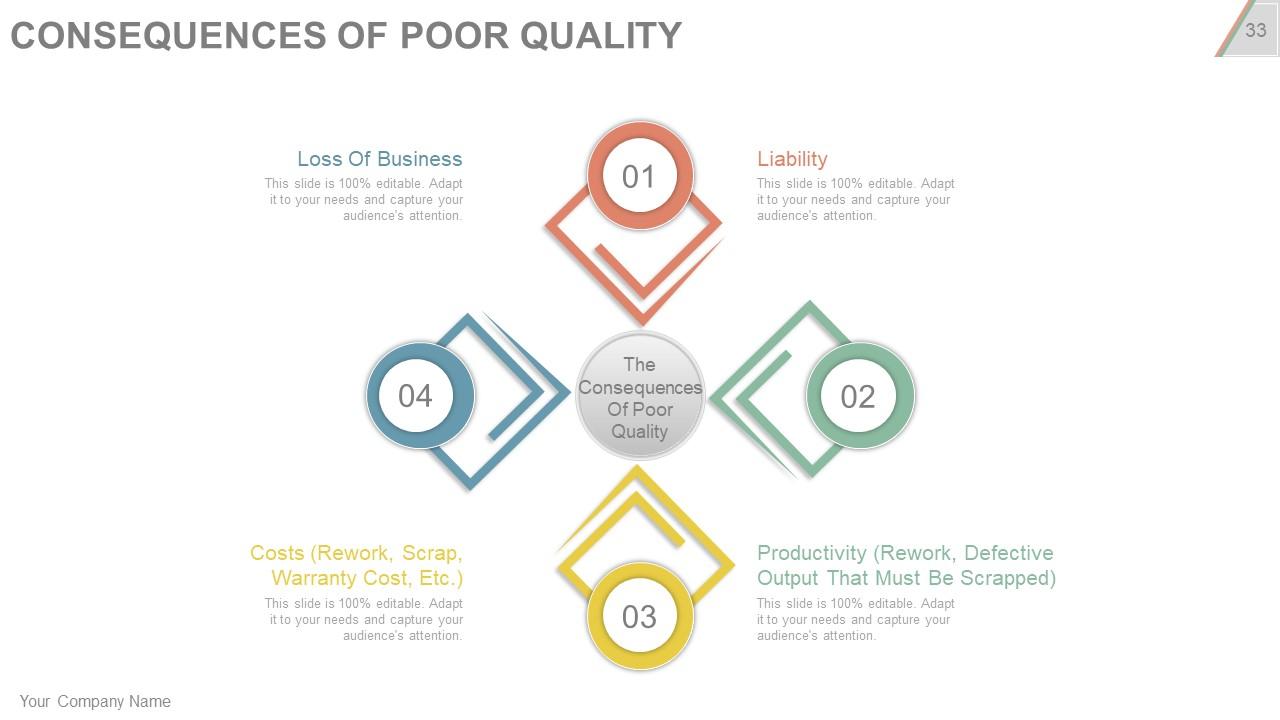
Slide 33: This slide shows The Consequences Of Poor Quality. We have mentioned four of these- Loss Of Business, Liability, Costs (Rework, Scrap, Warranty Cost, Etc.), Productivity (Rework, Defective Output That Must Be Scrapped). There are other consequences too which you can add as per your requirement.
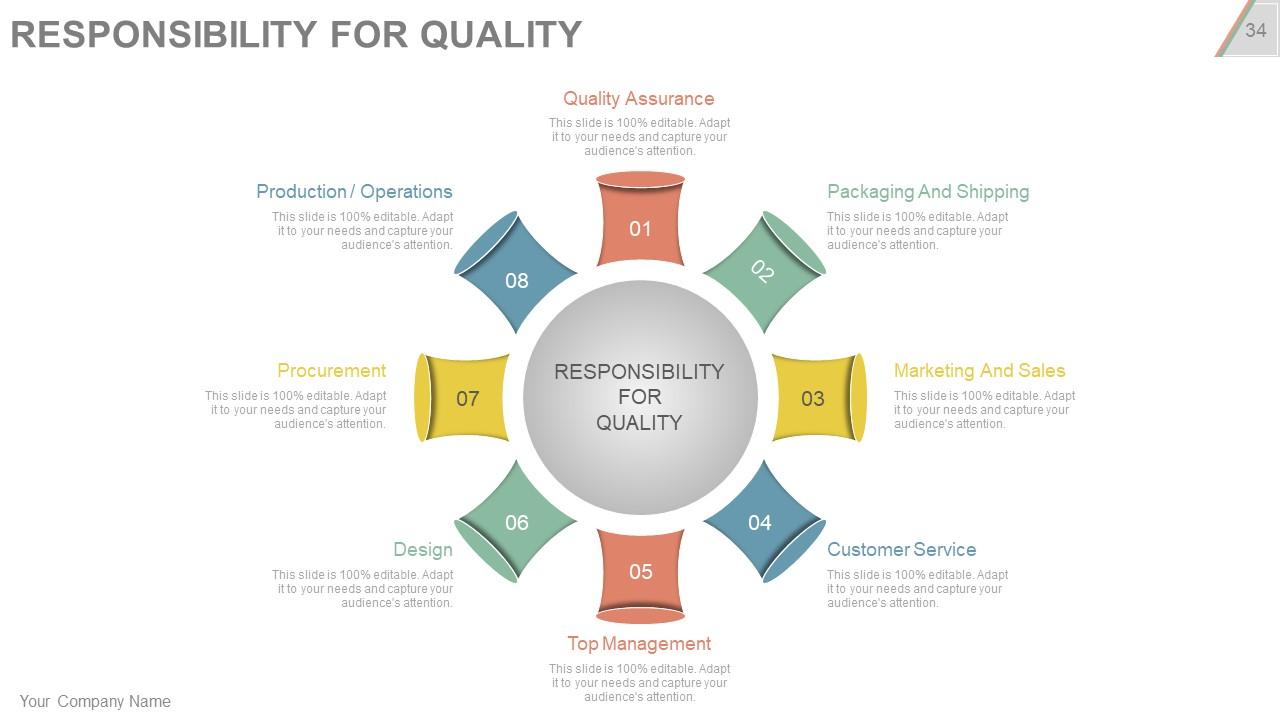
Slide 34: This slide shows eight points to describe the Responsibility For Quality- Top Management, Quality Assurance, Packaging And Shipping, Marketing And Sales, Customer Service, Production / Operations, Procurement, Design.
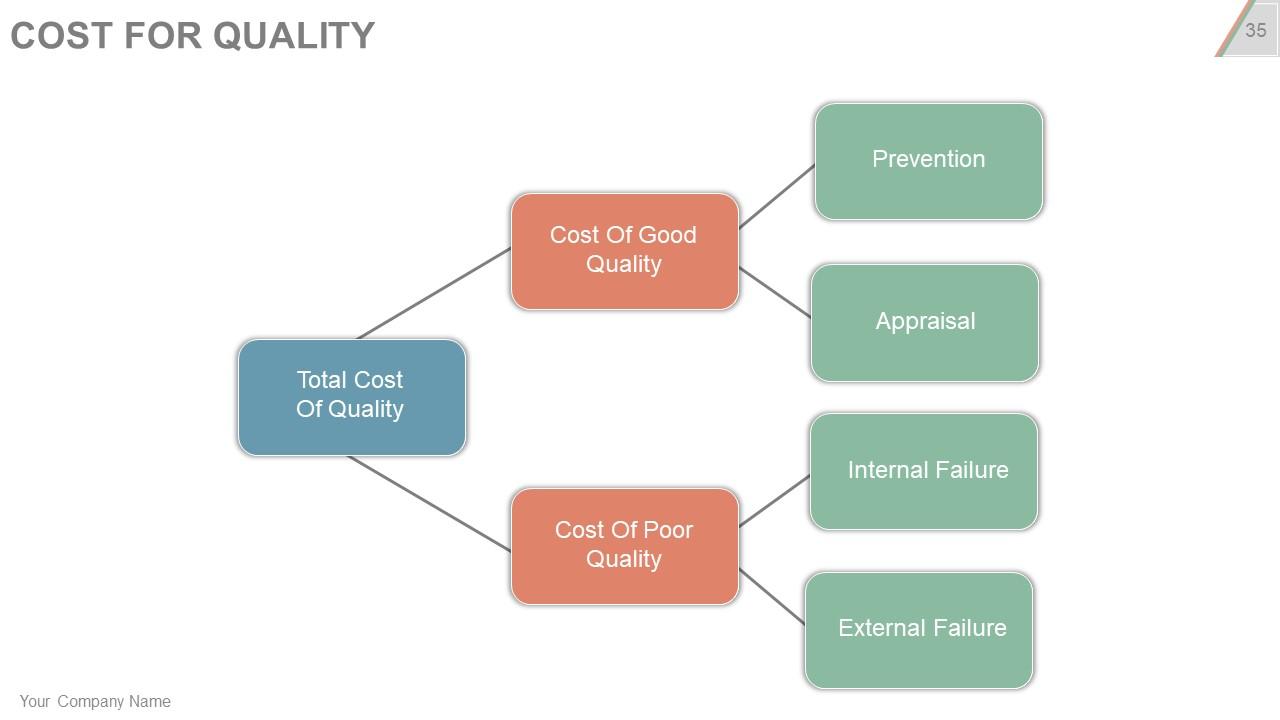
Slide 35: This slide shows the Cost For Quality flow chart with Total Cost Of Quality as its main sub heading.
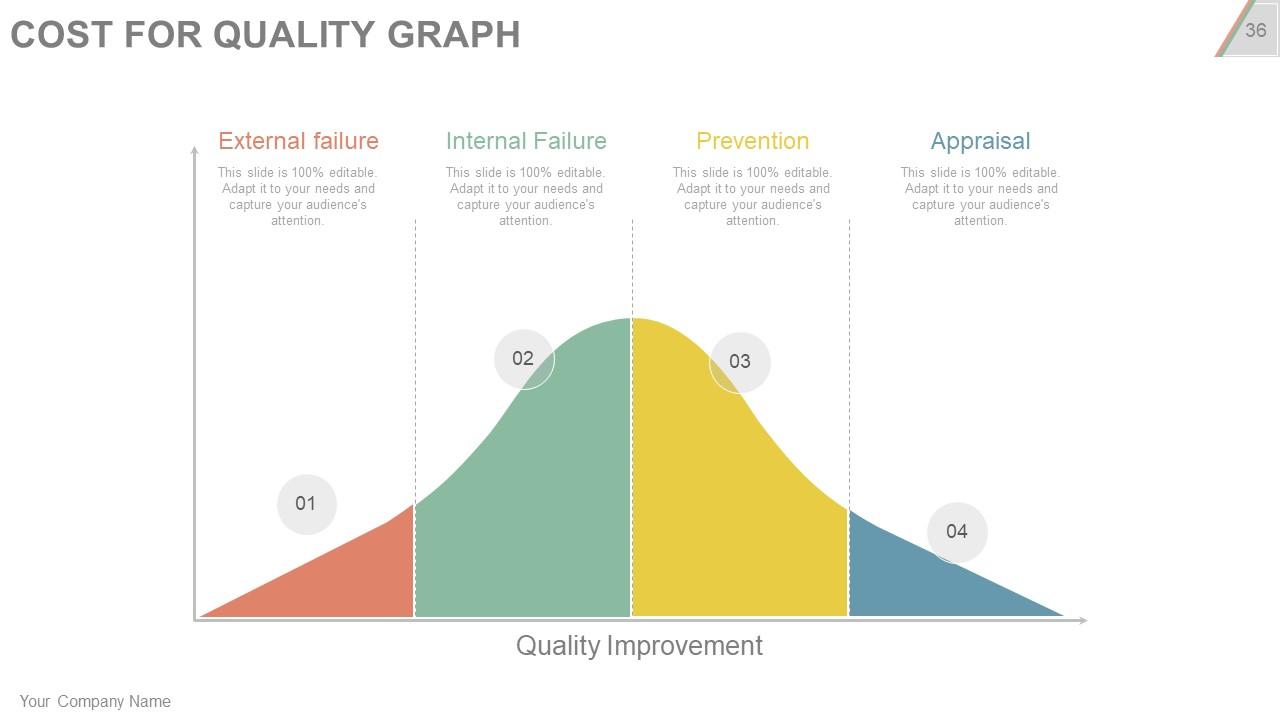
Slide 36: This slide shows Cost For Quality Graph with the following stages- External failure, Internal Failure, Prevention, Appraisal.
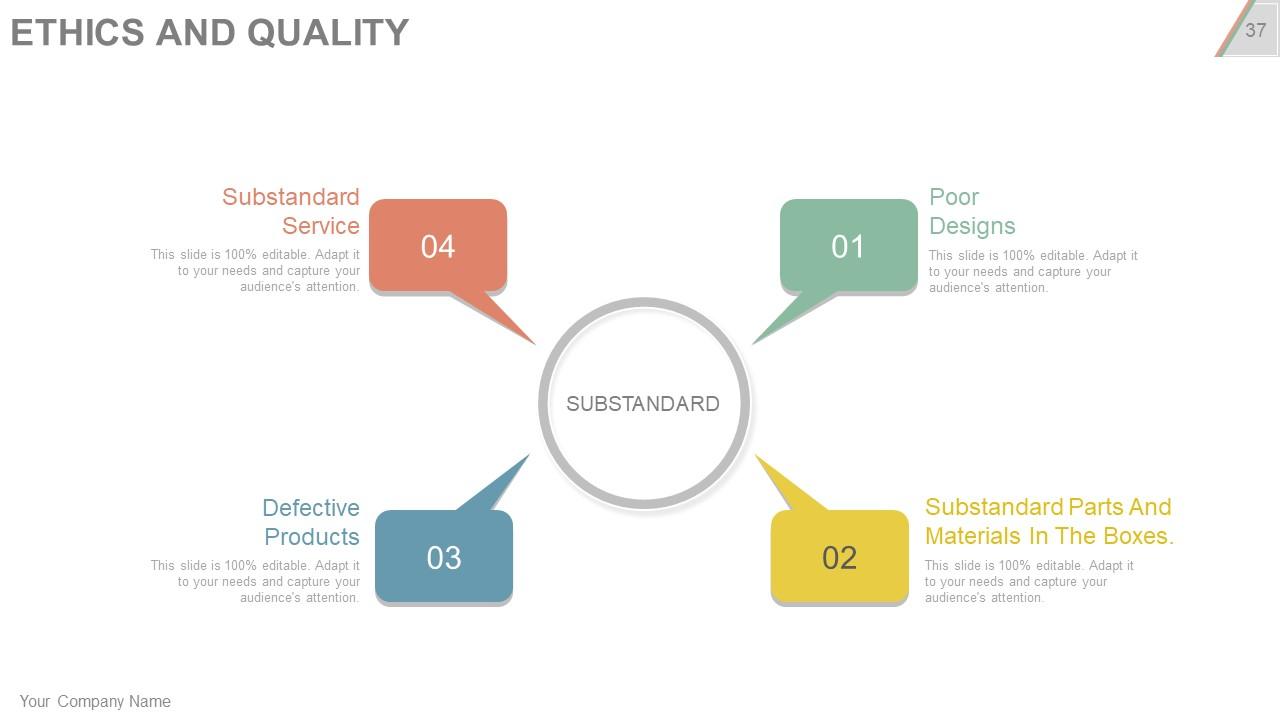
Slide 37: This slide shows Ethics and Quality with Substandard as its main subheading and Substandard Service, Poor Designs, Defective Products and Substandard Parts And Materials In The Boxes as its sub parts.
Slide 38: This slide is titled Additional Slides to move forward. You can change the slide content as per need.
Slide 39: This is Our Vision slide with text boxes. State your vision along with mission and goals here.
Slide 40: This is Our Team slide. Mention name, designation etc. here.
Slide 41: This is an About Us slide. Provide a brief introduction about company/ team here.
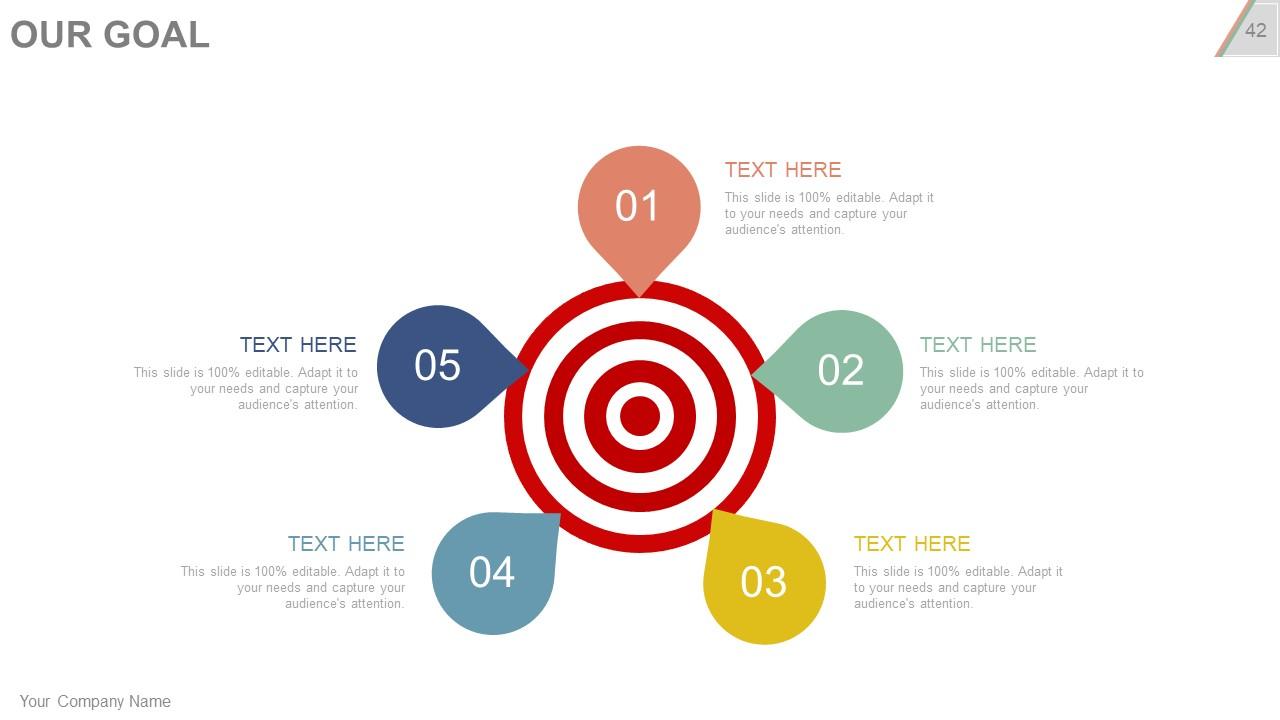
Slide 42: This is Our Goal slide to state company goals, aspirations etc.
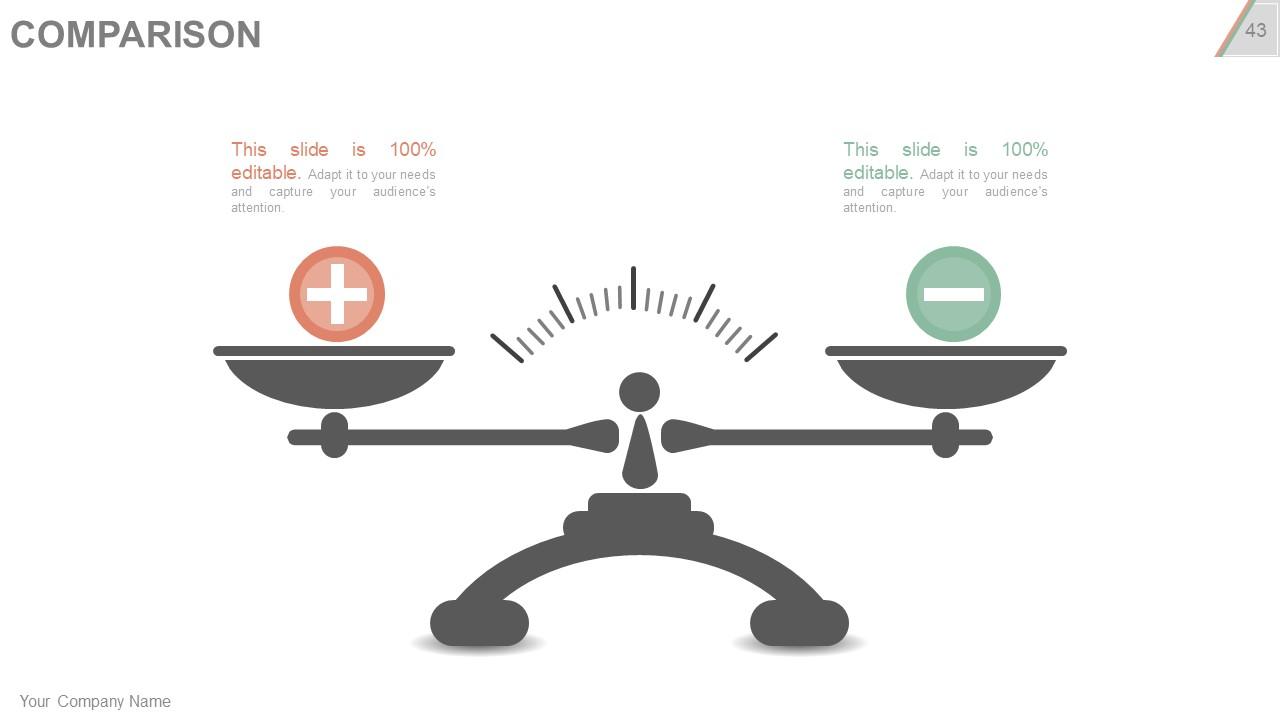
Slide 43: This is a Comparison slide with balancing scale imagery to compare two products/ entities etc.
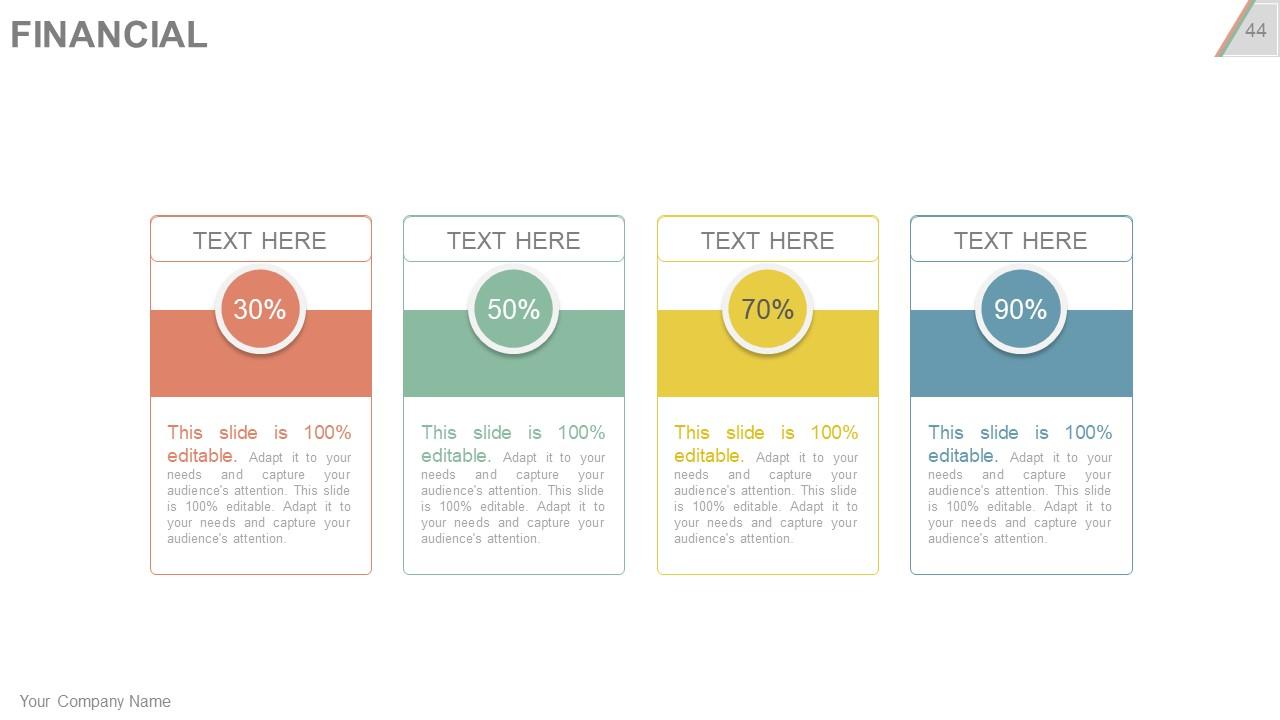
Slide 44: This is a Financial stats slide to state financial aspects etc.
Slide 45: This slide presents Quotes. Sate your inspirational quotes here. You may change the slide content as per need.
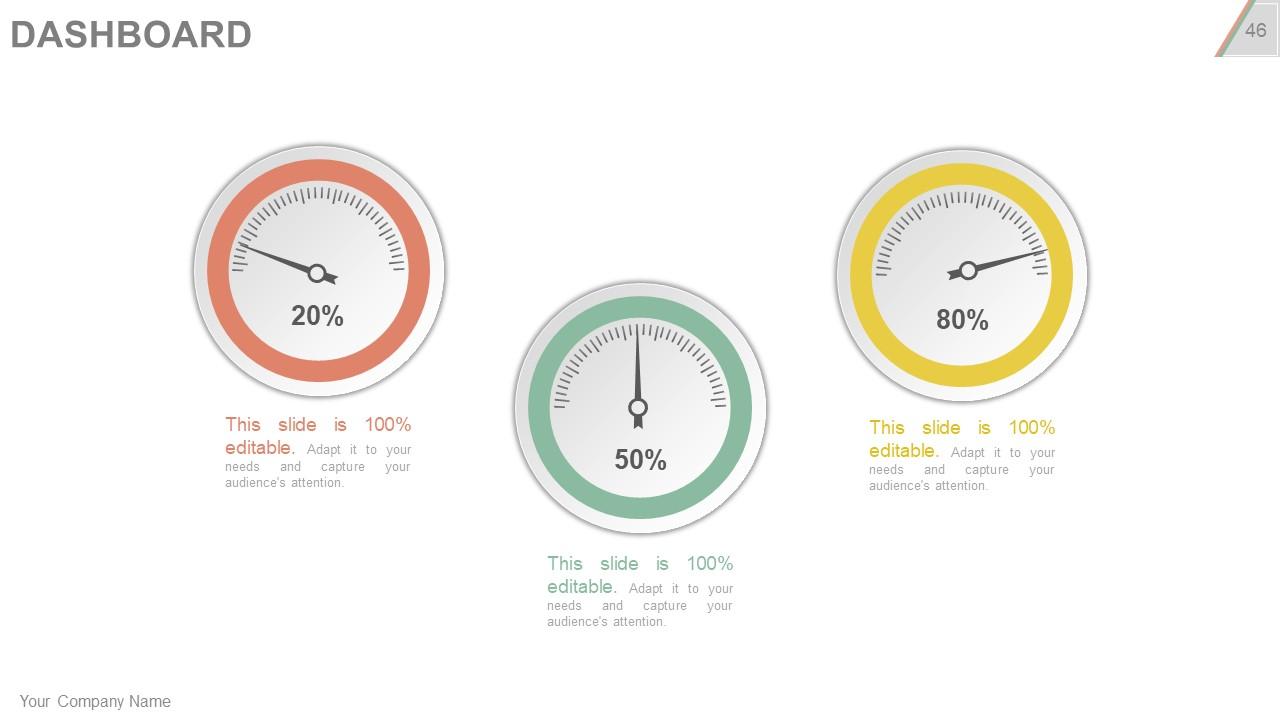
Slide 46: This is Dashboard slide to show information in percentages etc.
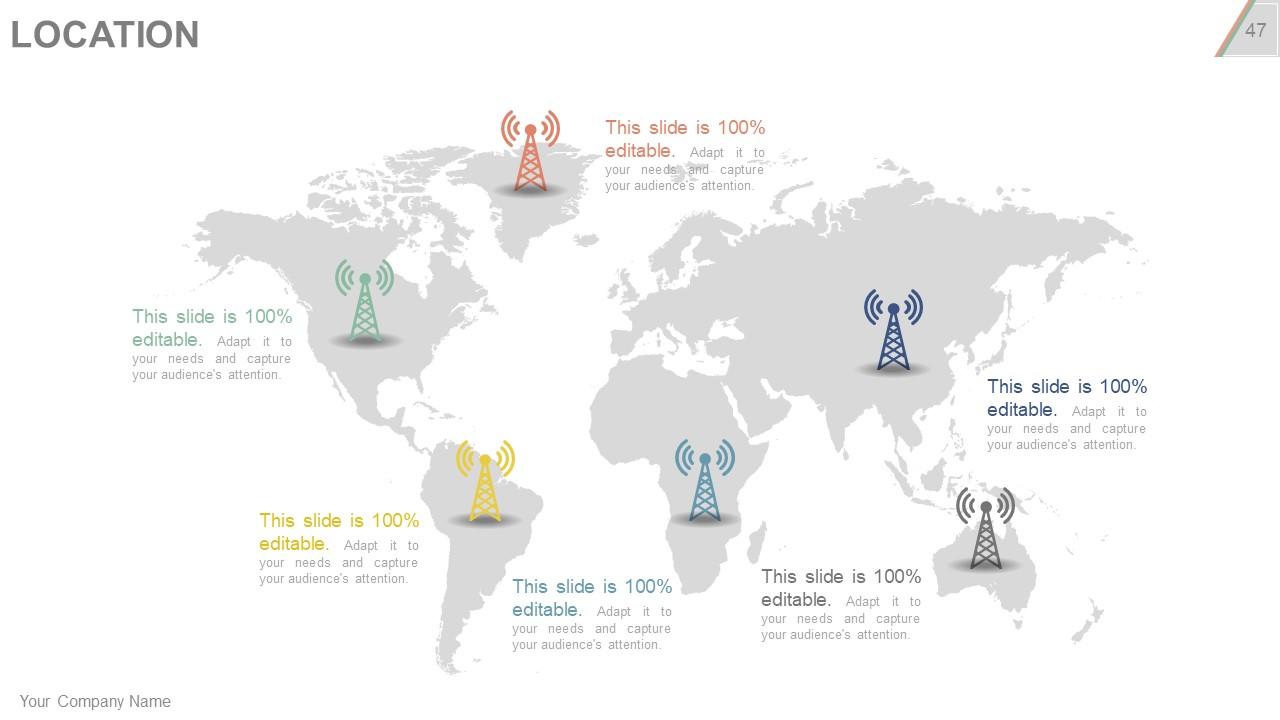
Slide 47: This is Location slide on a world map image to show global growth, presence etc.
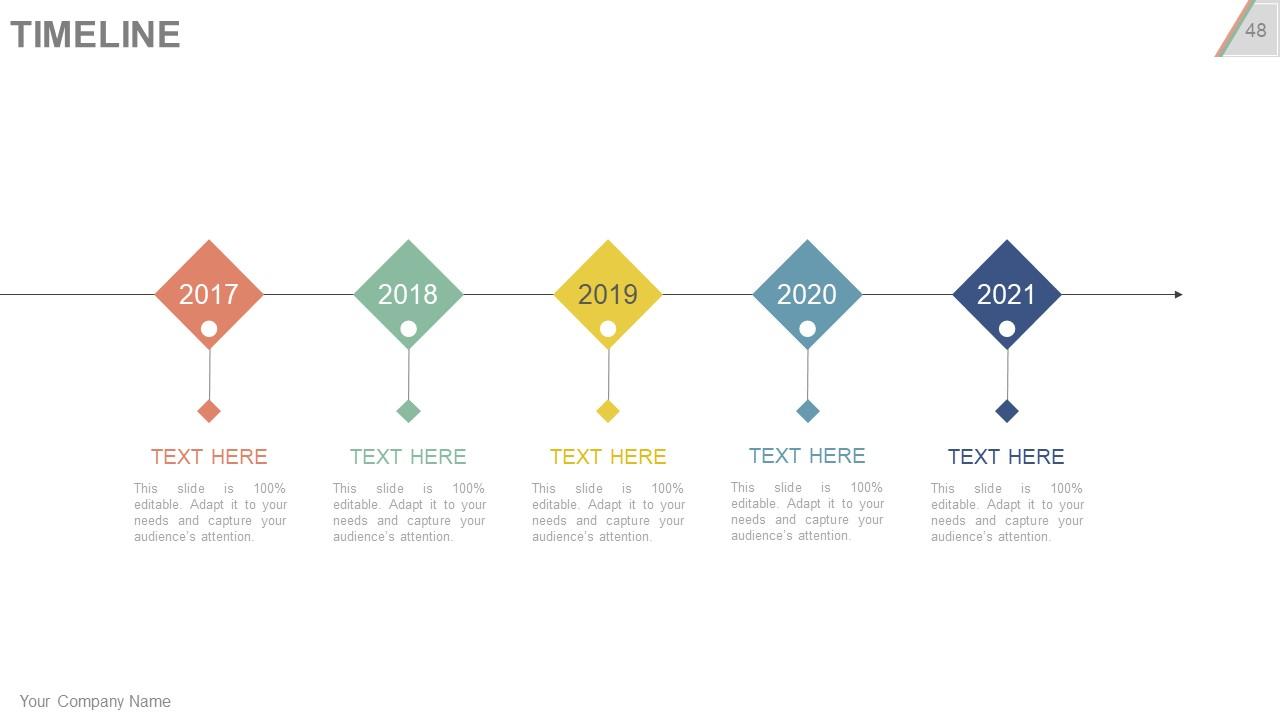
Slide 48: This is a Timeline slide to show milestones, growth or highlighting factors.
Slide 49: This is a Post it slide to mark reminders, events etc.
Slide 50: This is a Puzzle image slide to show information, specification etc.
Slide 51: This is a Target slide. State targets here.
Slide 52: This is a Circular image slide. State information, specifications etc. here.
Slide 53: This is a Venn diagram image slide to show information, specifications etc.
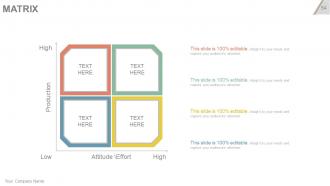
Slide 54: This is a MATRIX slide. Put relevant comparing data here.
Slide 55: This is a Silhouettes slides with text boxes. State information etc. here.
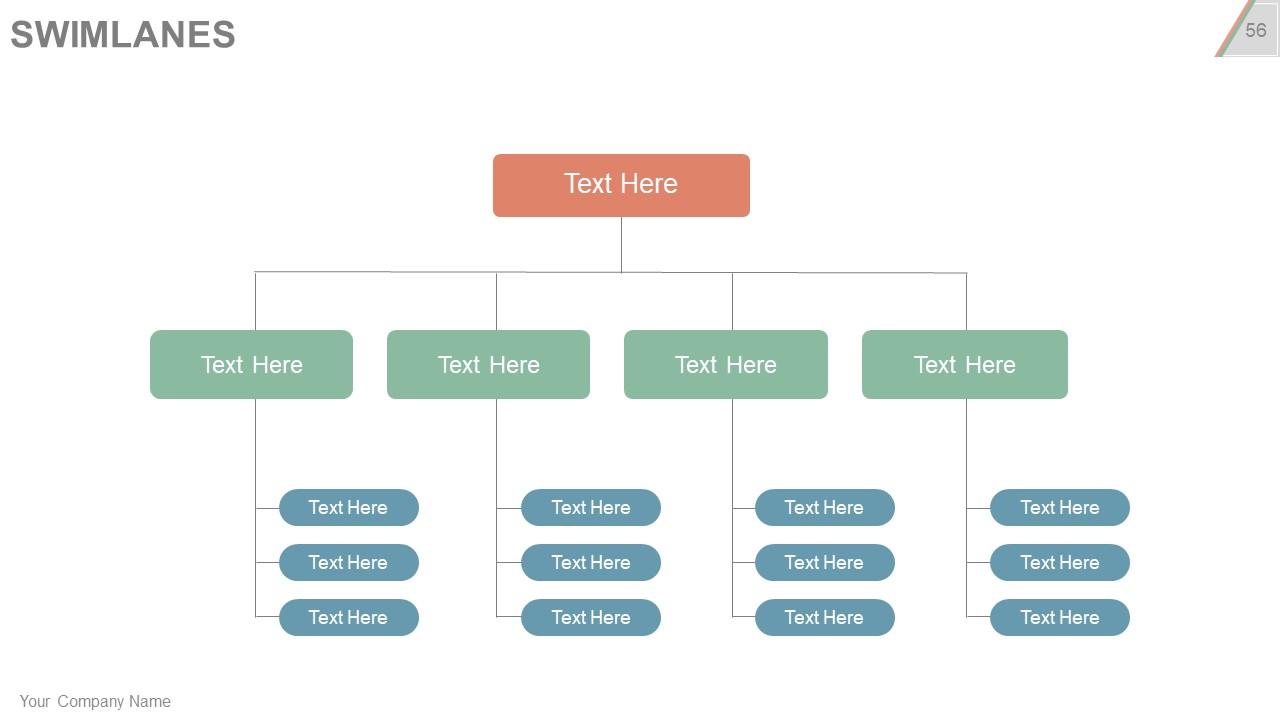
Slide 56: This slide presents SWIMLANES to show information, specifications etc.
Slide 57: This is a Bulb or Idea image slide to show ideas, innovative information etc.
Slide 58: This is a Magnifying Glass image slide to show information, specifications etc.
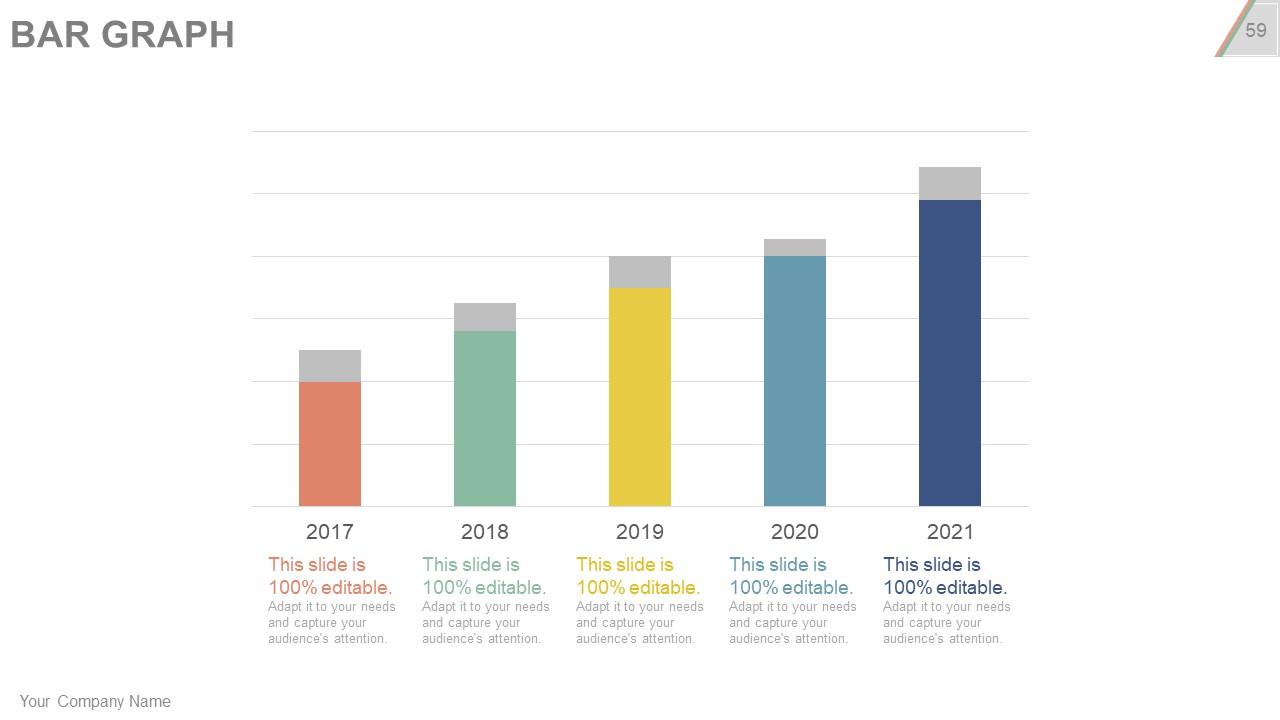
Slide 59: This is a Bar Graph slide to show product/ entity growth, comparison etc.
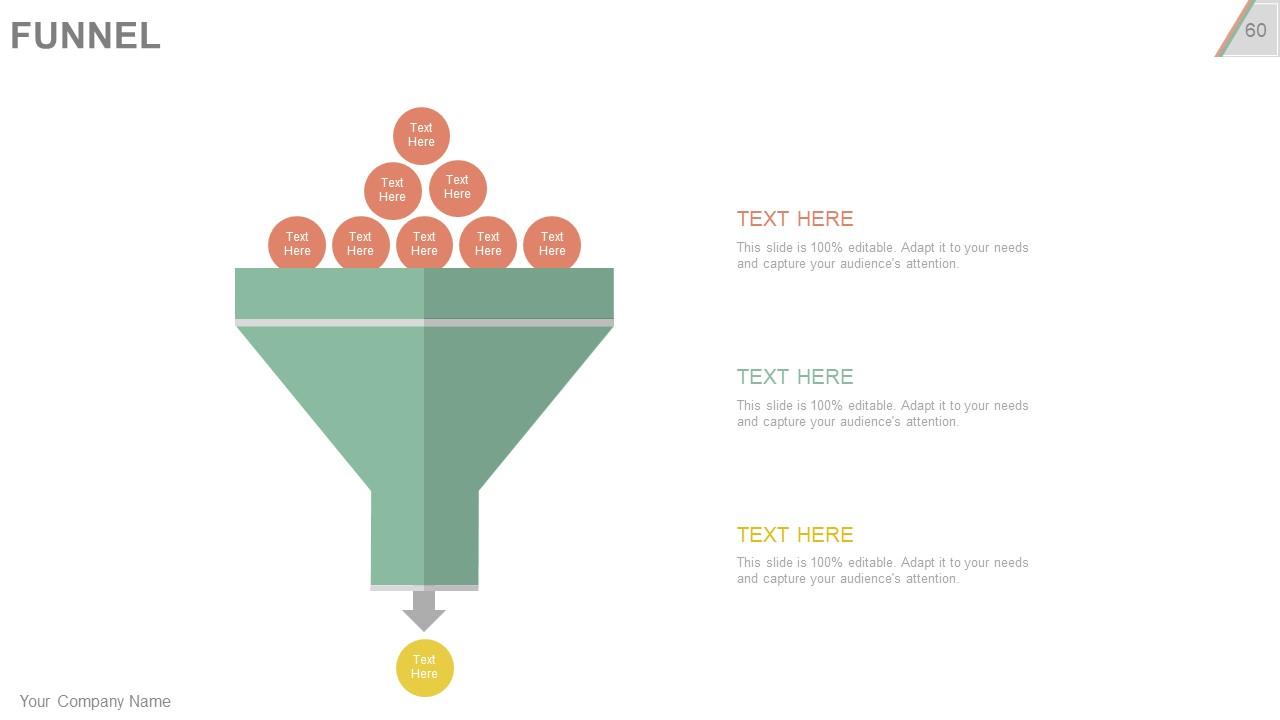
Slide 60: This slide shows a Funnel diagram with text boxes. State your specifications in funnel form.
Slide 61: This is a Thank You slide with Address# street number, city, state, Contact Number, Email Address.
Project quality management plan checklist powerpoint presentation slides with all 61 slides:
Avoid any haggling with our Project Quality Management Plan Checklist Powerpoint Presentation Slides. Get them to believe in your fairness.
-
Professional and unique presentations.
-
Innovative and Colorful designs.


