Quality Management Principles To Managing Stock Portfolios Powerpoint Presentation Slides
Managing your stock portfolio is the first step towards the path of financial stability. Therefore, we have come up with content-ready quality management principles to managing stock portfolios PowerPoint presentation slides. This stock portfolio PPT template contains 57 slides that covers topics such as portfolio management process, investment objectives, risk tolerance analysis, asset allocation, target modelling, scheduling, pareto optimal portfolio, investment approaches, performance attribution, security analysis, and much more. Apart from this, many related topics have also been covered which includes quality investing, stock portfolio management, share portfolio, investment portfolio, and equity portfolio management. Managing your stocks is not at all easy but with our ready-made presentation visuals, it will be an easy task. So, download quality management principles to managing stock portfolios presentation right now. This will provide you with the strategy you can adopt to protect, preserve, and amass wealth. Let your thoughts flower with our Quality Management Principles To Managing Stock Portfolios Powerpoint Presentation Slides. They will combine to create a beautiful garden.
- Google Slides is a new FREE Presentation software from Google.
- All our content is 100% compatible with Google Slides.
- Just download our designs, and upload them to Google Slides and they will work automatically.
- Amaze your audience with SlideTeam and Google Slides.
-
Want Changes to This PPT Slide? Check out our Presentation Design Services
- WideScreen Aspect ratio is becoming a very popular format. When you download this product, the downloaded ZIP will contain this product in both standard and widescreen format.
-

- Some older products that we have may only be in standard format, but they can easily be converted to widescreen.
- To do this, please open the SlideTeam product in Powerpoint, and go to
- Design ( On the top bar) -> Page Setup -> and select "On-screen Show (16:9)” in the drop down for "Slides Sized for".
- The slide or theme will change to widescreen, and all graphics will adjust automatically. You can similarly convert our content to any other desired screen aspect ratio.
Compatible With Google Slides

Get This In WideScreen
You must be logged in to download this presentation.
PowerPoint presentation slides
Edit slides to the way you want them. 57 designs having quality content. Download all slides with just a single click. Standard and widescreen compatibility. Google Slides support. Suitable for use by managers, stock brokers, businessmen, and companies. Premium Customer support service.The stages in this process are quality management principles to managing stock portfolios, quality assurance, strategic management etc.
People who downloaded this PowerPoint presentation also viewed the following :
Content of this Powerpoint Presentation
Slide 1: This slide introduces Quality Management Principles To Managing Stock Portfolios. State your company name and proceed.
Slide 2: This slide shows agenda. You can add your company agenda and use it accordingly.
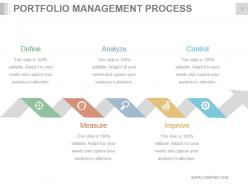
Slide 3: This slide shows portfolio management process with these five stages- Define, Analyze, Control, Measure, Improve.
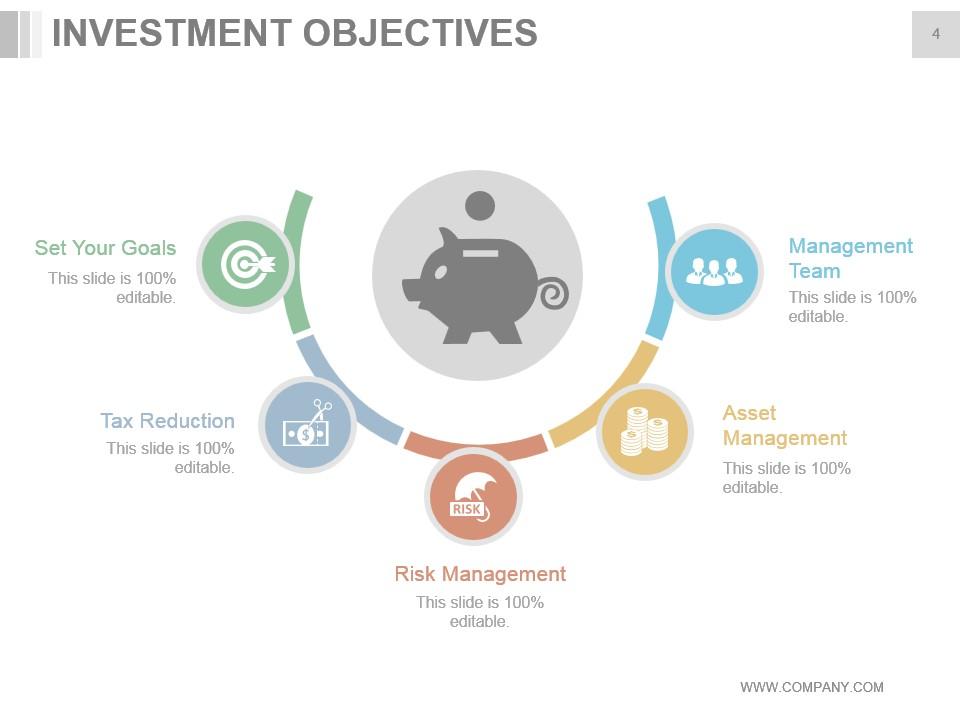
Slide 4: This slide showcases investment objective Set Your Goals, Tax Reduction, Risk Management, Asset Management, Management Team.
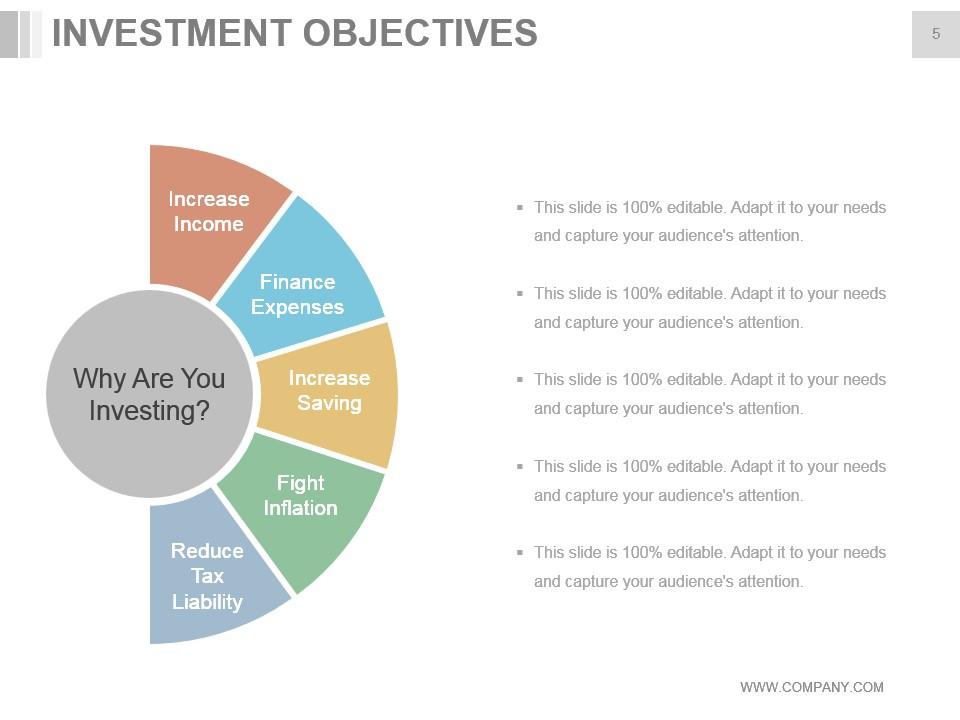
Slide 5: This slide presents investment objective with these parameters- Increase Income, Finance Expenses, Increase Saving, Fight Inflation, Reduce Tax Liability.
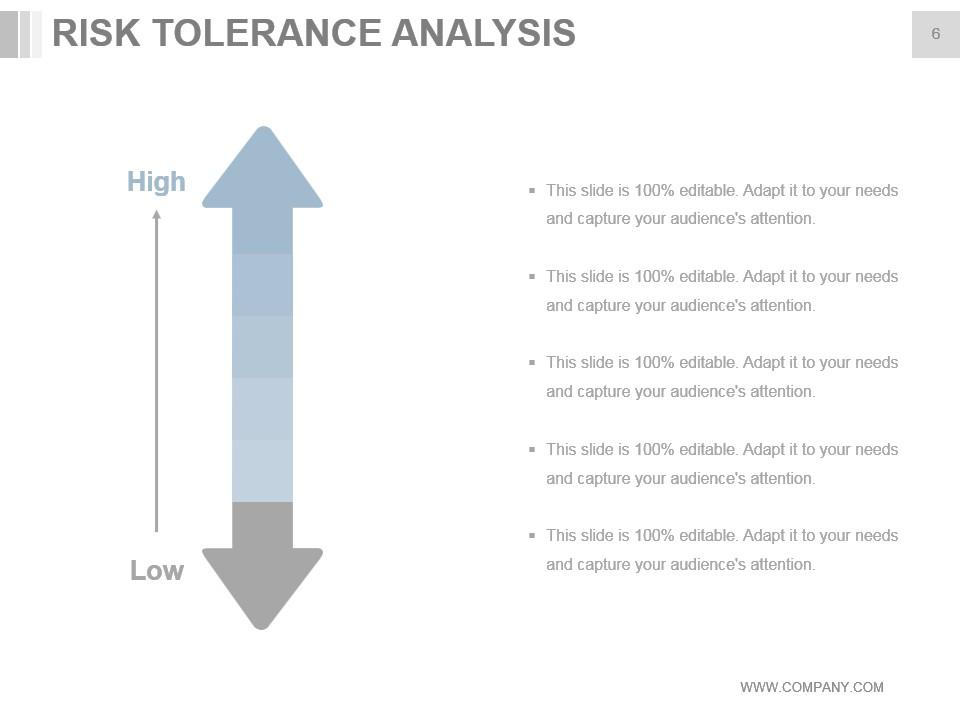
Slide 6: This slide showcases risk tolorence analysis with a scale of- High, Low.
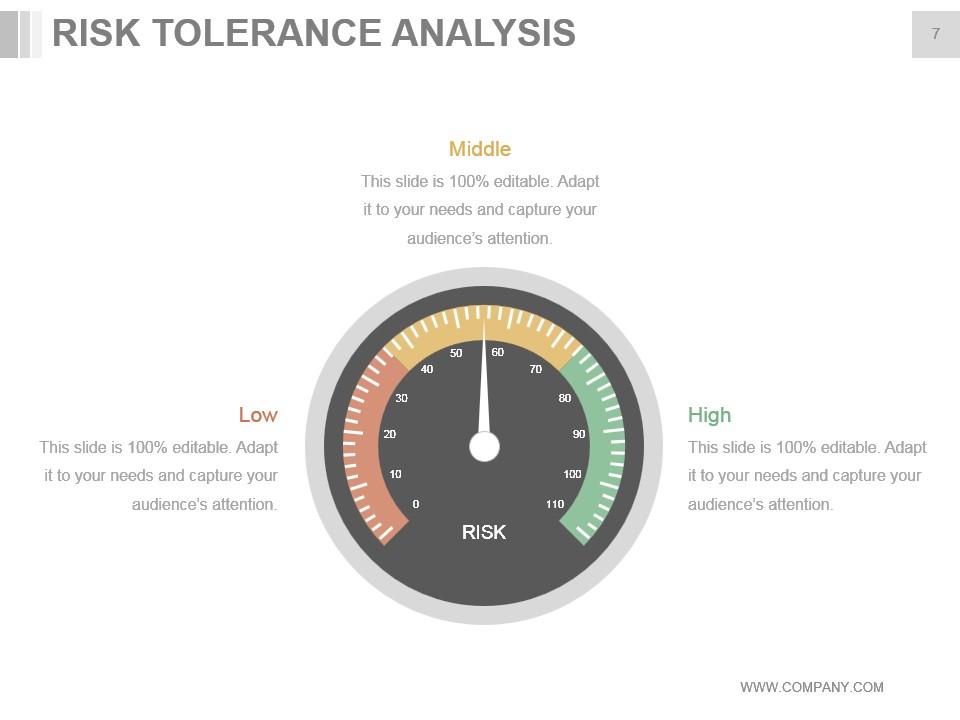
Slide 7: This slide presents risk tolorence analysis with meter showing- Low, Middle, High.
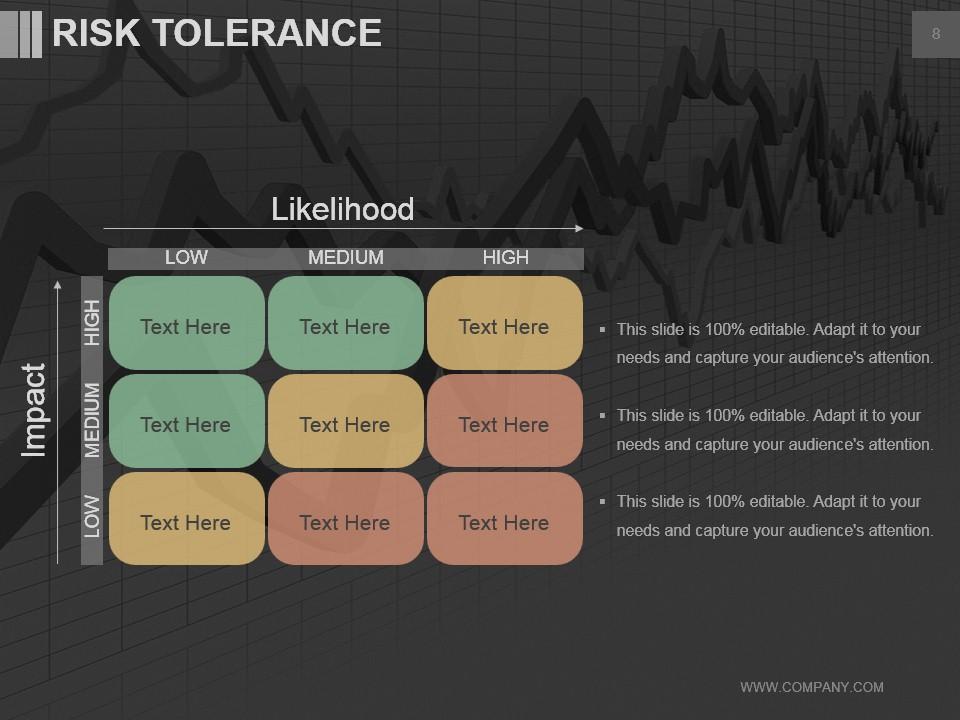
Slide 8: This slide presents risk tolerance matrix low, medium, high.
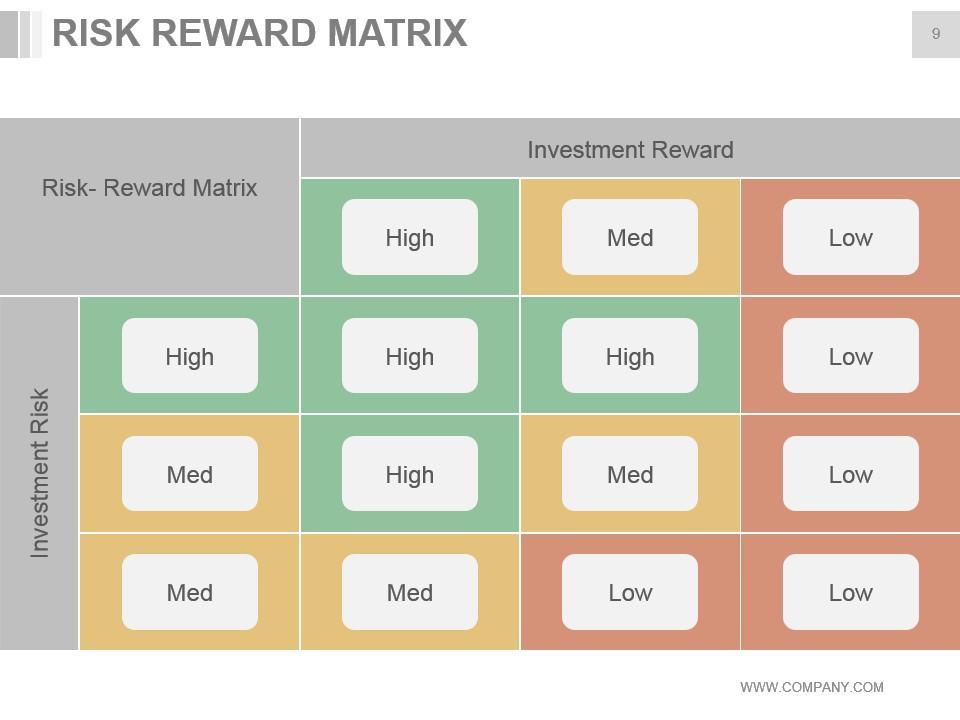
Slide 9: This slide presents risk reward matrix with this three factors- Investment Reward, Investment Risk, Risk- Reward Matrix.
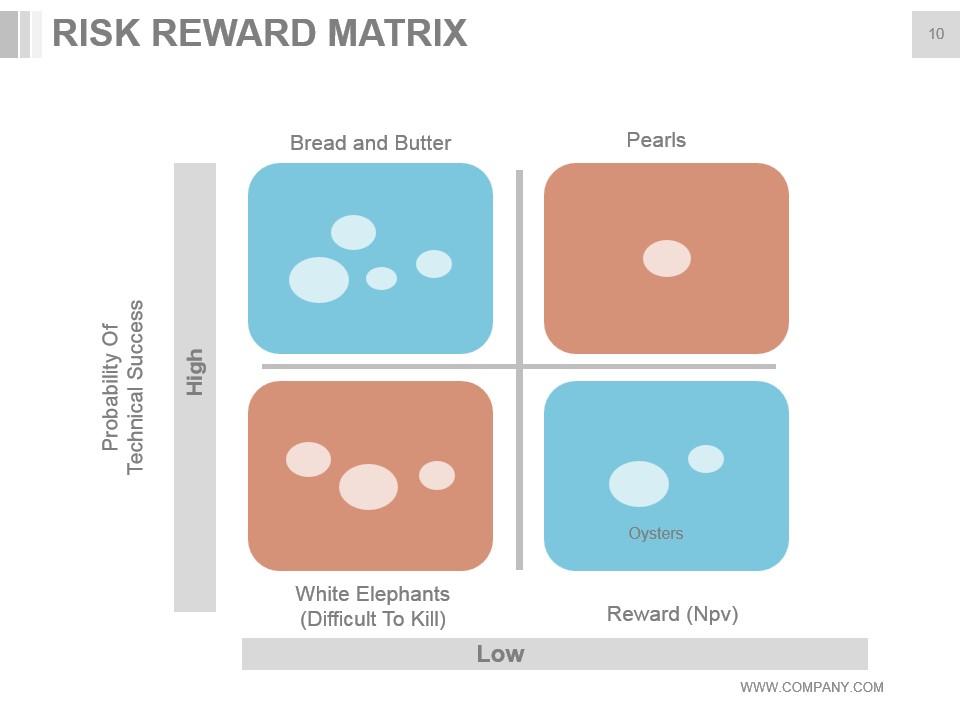
Slide 10: This slide showcases Risk Reward Matrix which further give you information about Probability Of Technical Success.
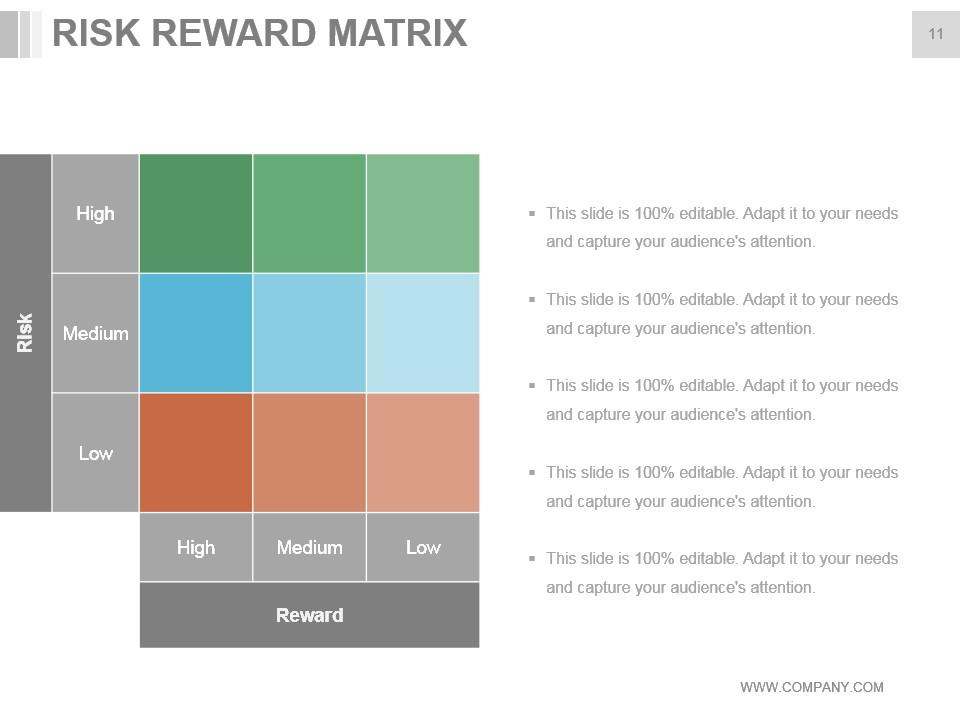
Slide 11: This slide presents Risk Reward Matrix with three parameters of low, Medium, high.
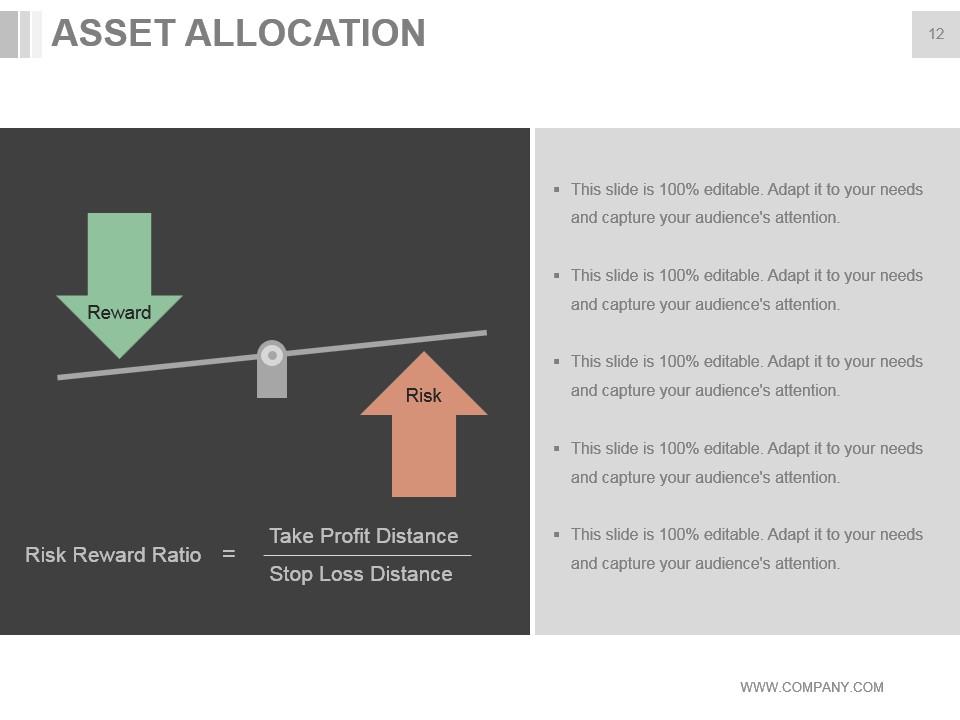
Slide 12: This slide shows Asset Allocation is balance scale with risk and reward.
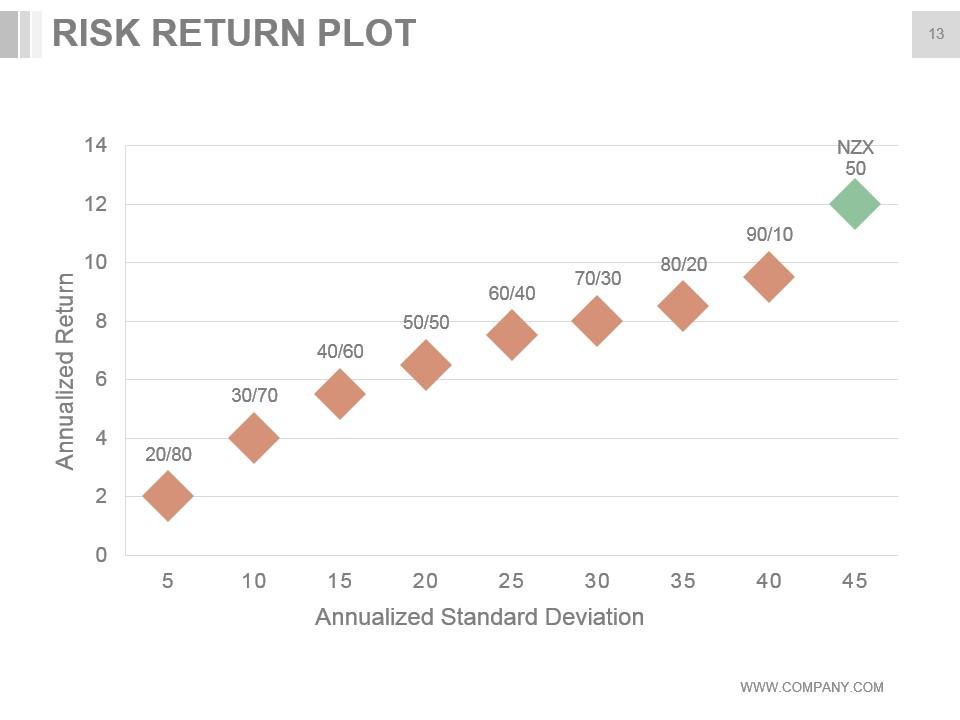
Slide 13: This slide presents Risk Return Plot with main criterias as - Annualized Return, Annualized Standard Deviation. You can add and utilize as per your requirement.
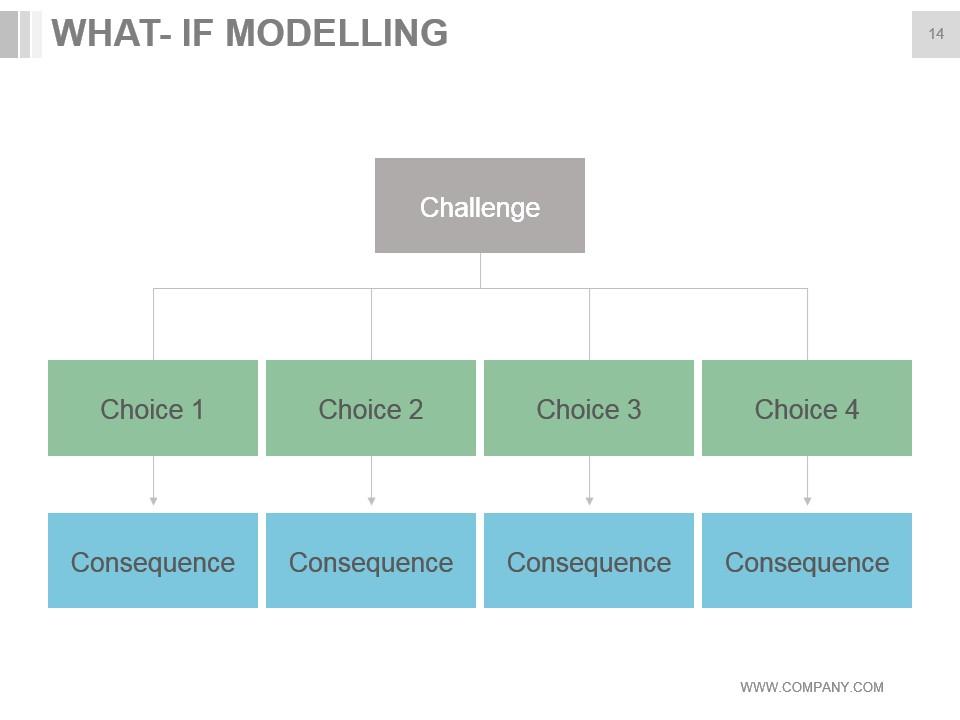
Slide 14: This slide showcases what -If modelling with these components- Challenge, Choice.
Slide 15: This slide presents what- if modelling with certain blocks you can put information in.
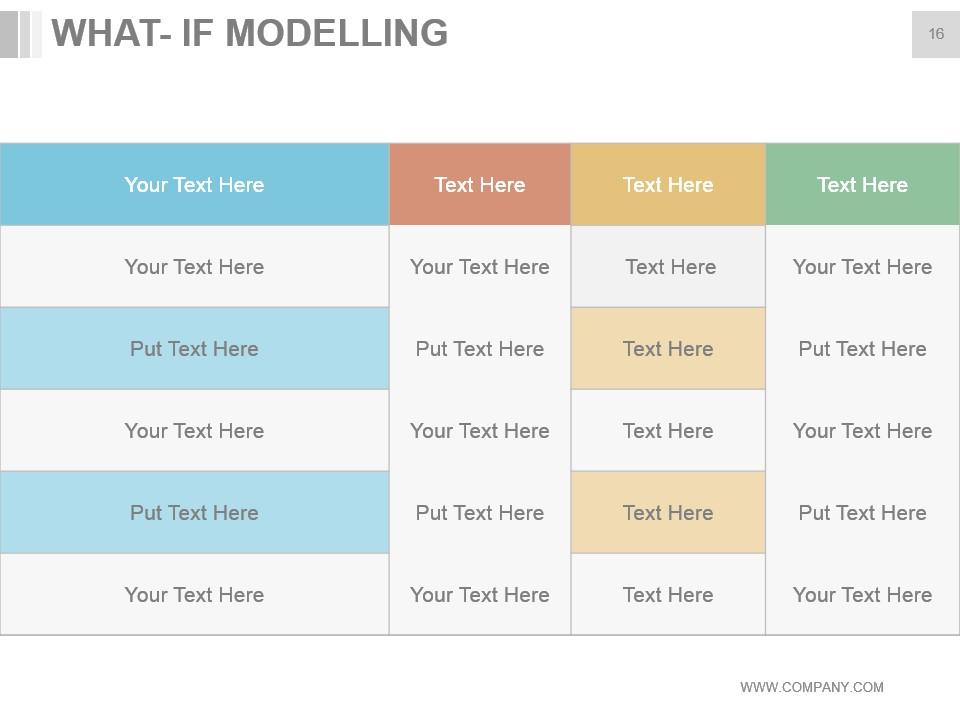
Slide 16: This slide covers what-if modelling with the table. You can add your data in that table and use it.
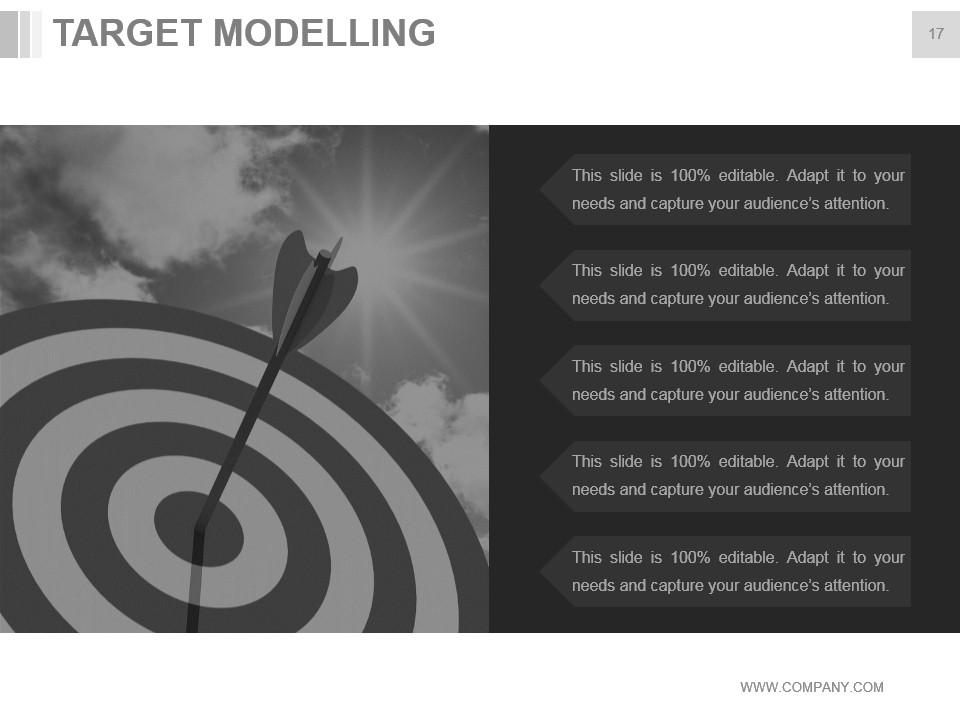
Slide 17: This slide showing target modelling with an imagery dartboard. You can add the data or information as per your requirement.
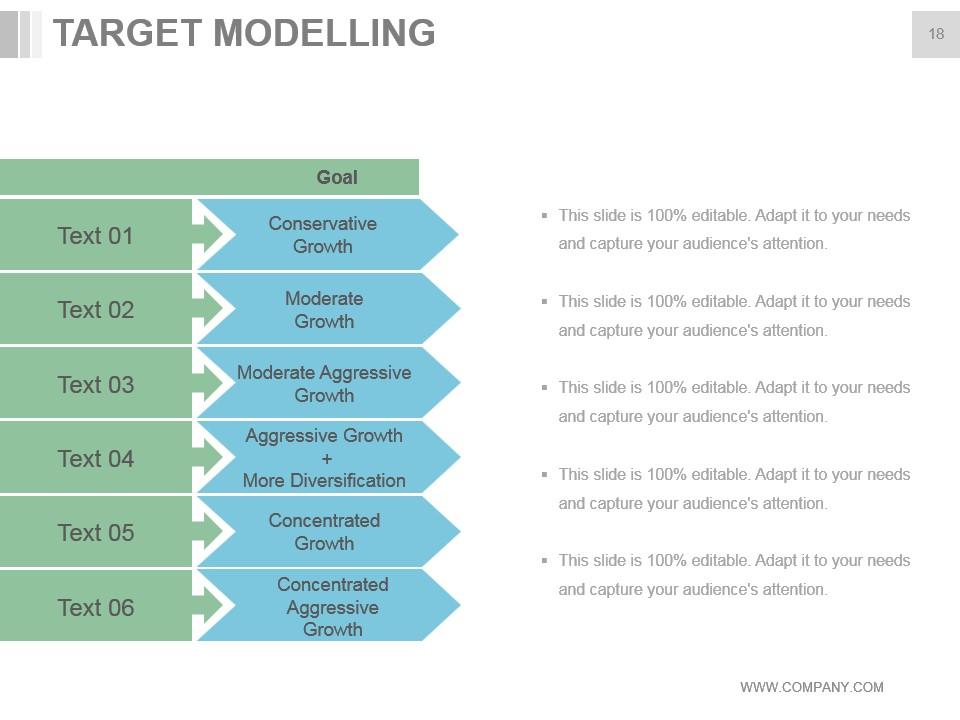
Slide 18: This slide showcases Target modelling with these parameters- Conservative Growth, Moderate Growth, Moderate Aggressive Growth, Aggressive Growth, More Diversification, Concentrated Growth, Concentrated Aggressive Growth.
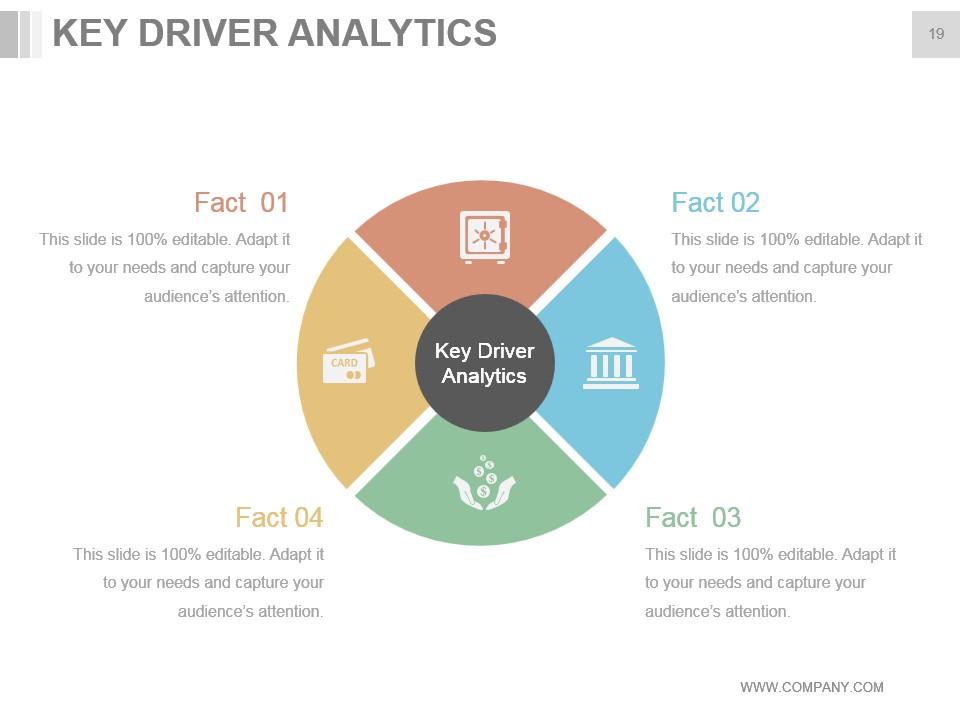
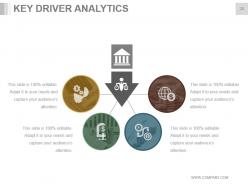
Slide 19: This slide shows key driver analytics with these four facts we have mentioned. You can add in those text boxes what you want to.
Slide 20: This slide presents key driver analystics with five icons we have provided. You can add your drivers as per your requirement.
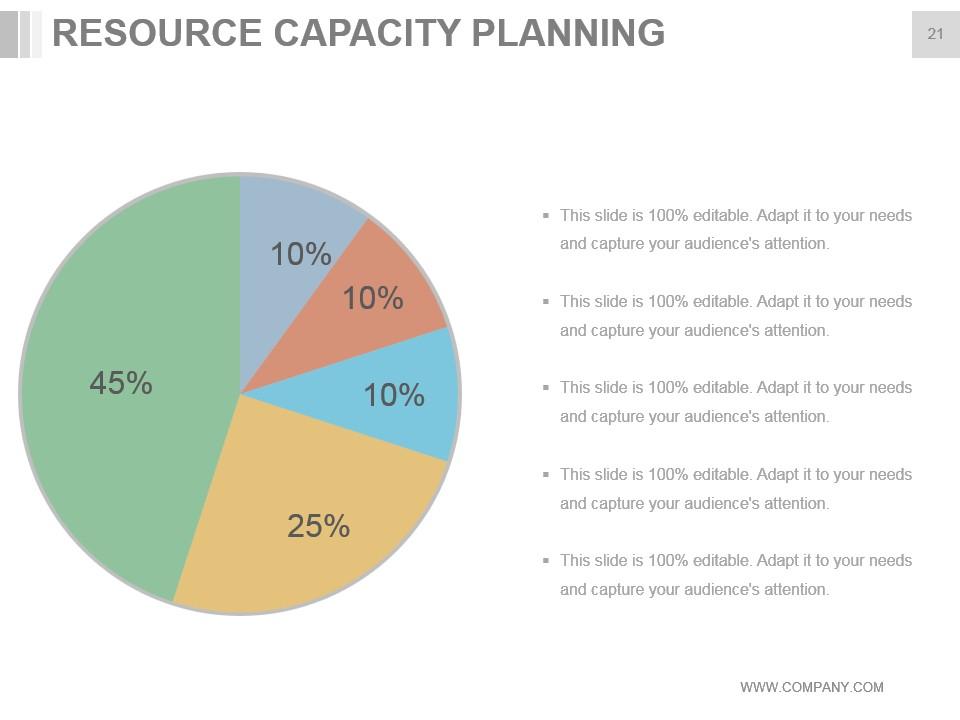
Slide 21: This slide showcases resource planning capacity with a pie chart. We have mentioned percentages, You can use it to show the capacity planning.
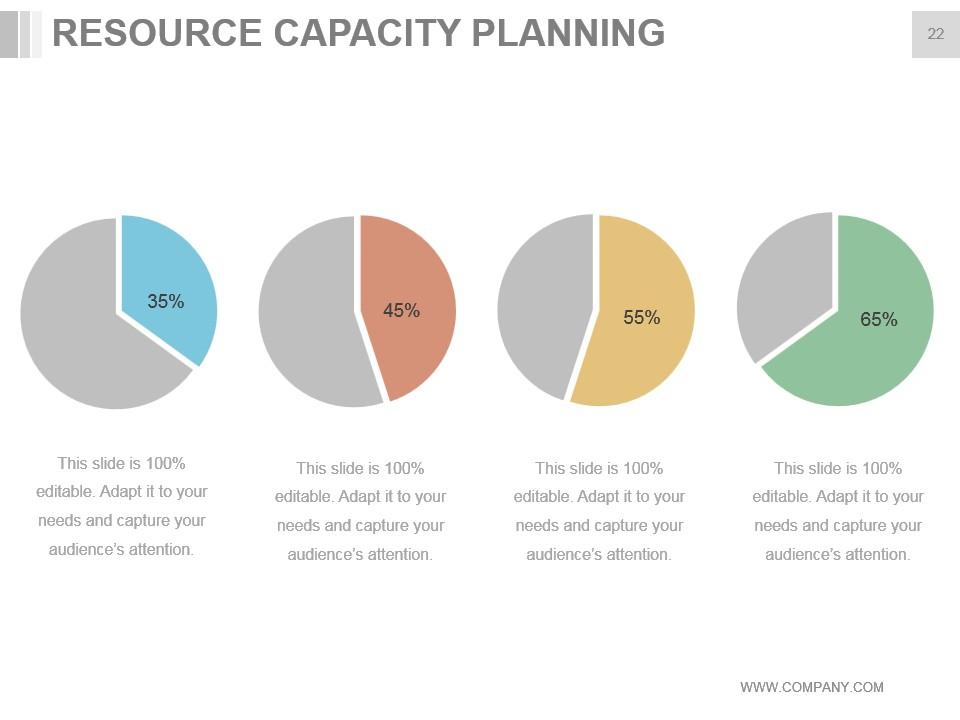
Slide 22: This slide shows resource capacity planning with four pie chart. You can presents the different planning with this.
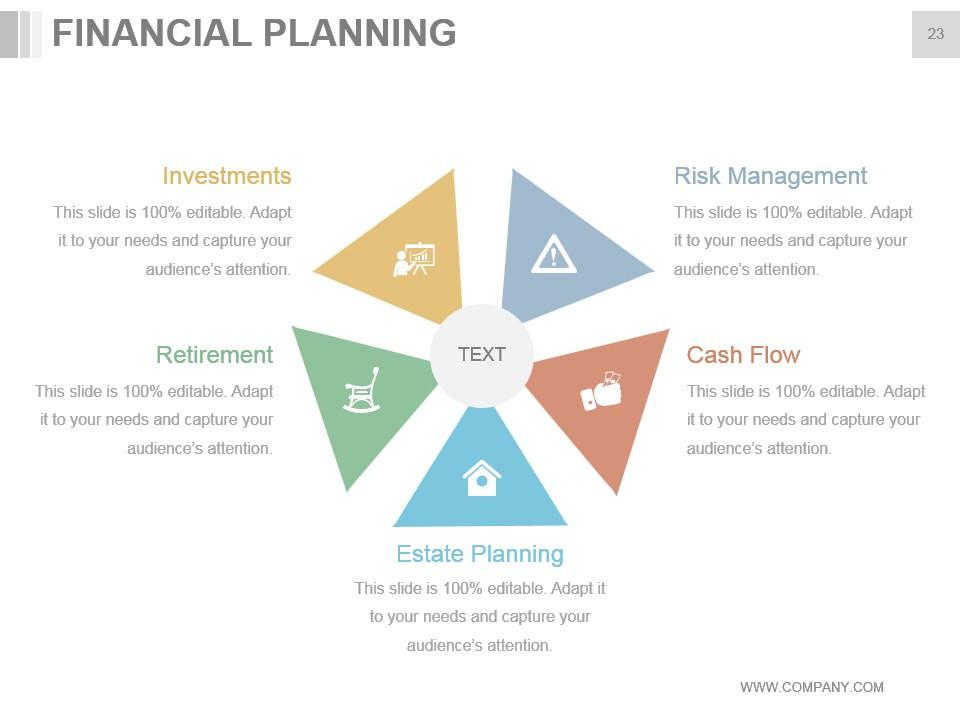
Slide 23: This slide presents financial planning with these five following criterion to consider- Estate Planning, Cash Flow, Retirement, Risk Management, Investments.
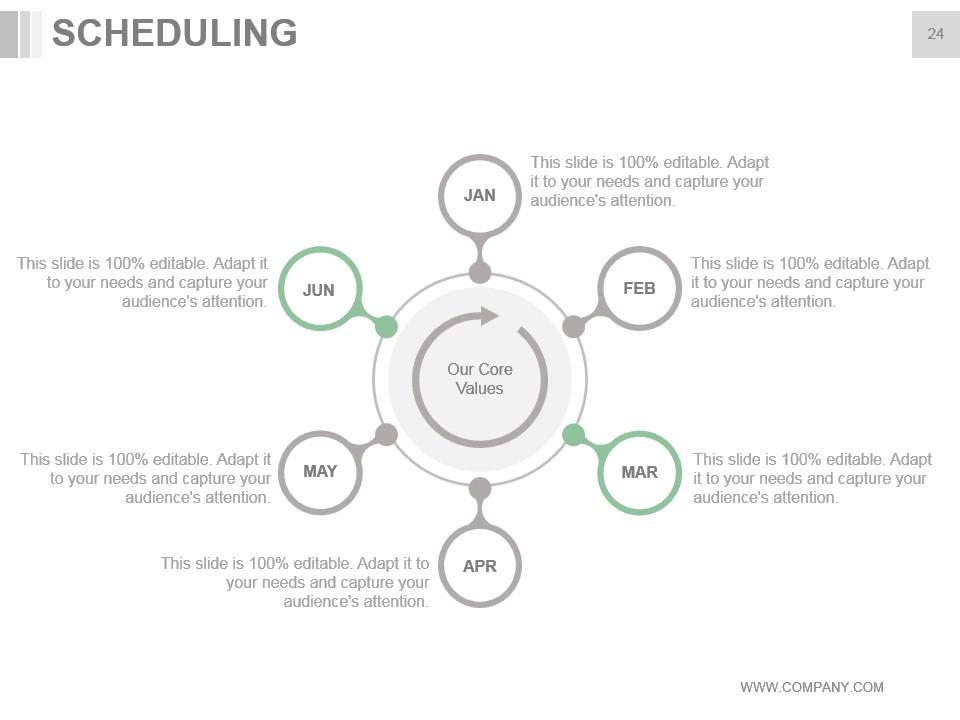
Slide 24: This slide showcases scheduling which further includes Our Core Values and further with number of months- jan, feb, mar, apr, may, jun.
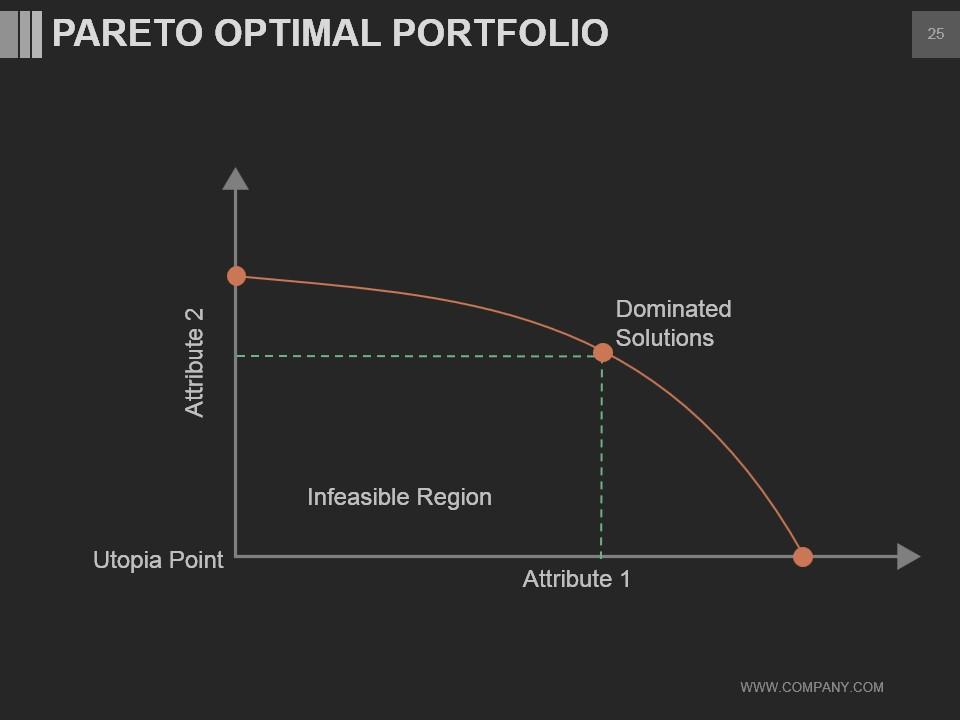
Slide 25: This slide presents pareto optimal portfolio graphical representation. You can use as such for your business requirement.
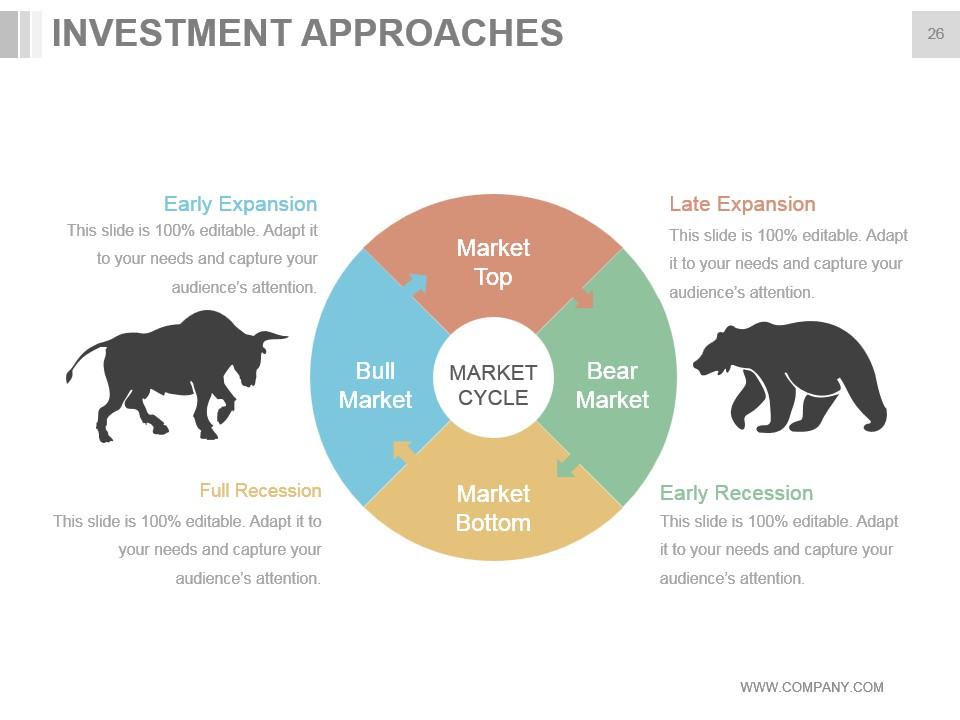
Slide 26: This slide shows investment approaches- Full Recession, Early Recession, Early Expansion, Late Expansion, Bull Market, Market Top, Bear Market, Market Bottom.
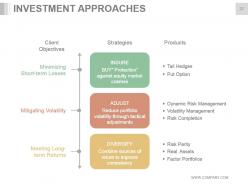
Slide 27: This slide presents investment approaches and also showing further these components to consider- Client Objectives, Strategies, Products, Dynamic Risk Management, Volatility Management, Risk Completion, Tail Hedges, Put Option, Risk Parity, Real Assets, Factor Portfolios, Minimizing, Short-term Losses, Mitigating Volatility, Meeting Long-term Returns, Insure, Adjust, Diversify.
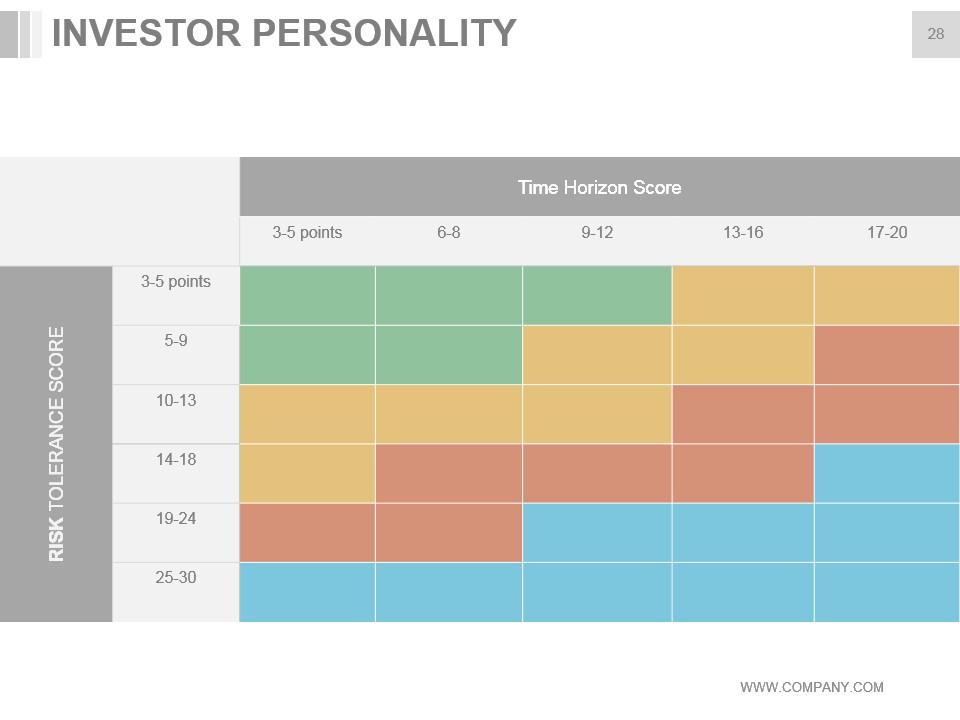
Slide 28: This slide shows investor personality with risk tolerance score and time horizon score.
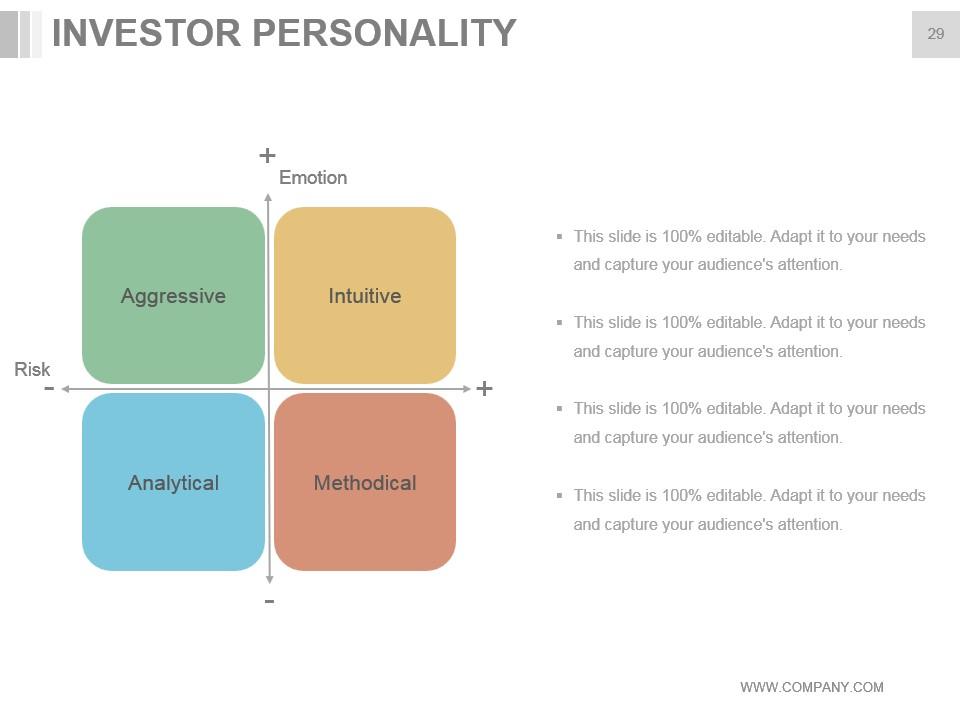
Slide 29: This slide presents investor personality with these six factors- Aggressive, Intuitive, Analytical, Methodical, Risk, Emotion.
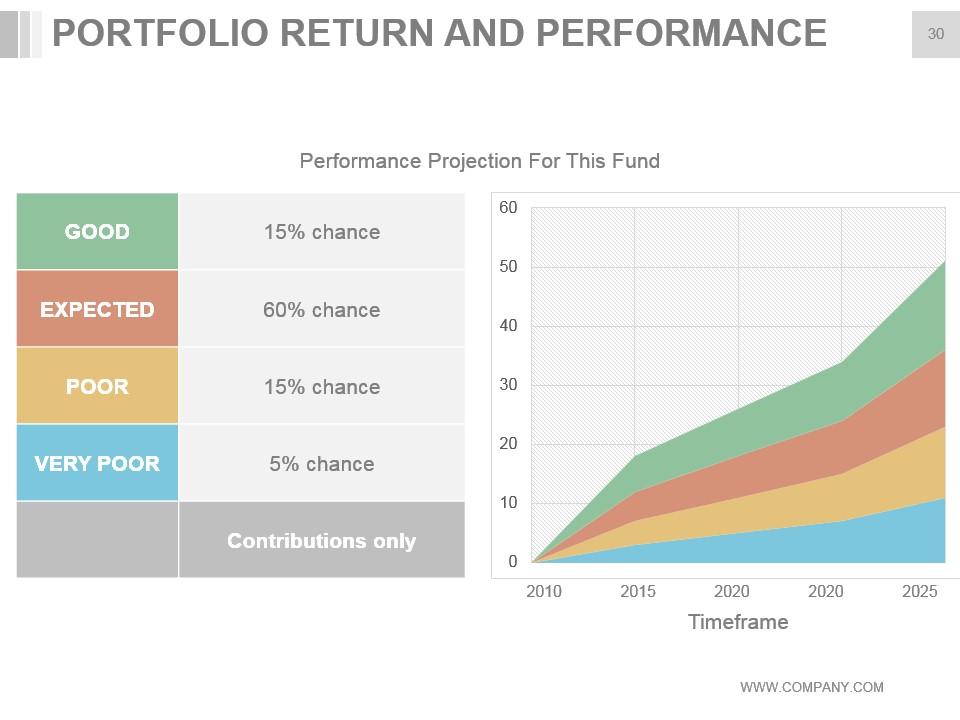
Slide 30: This slide showcases portfolio return and performance and further Performance Projection For This Fund
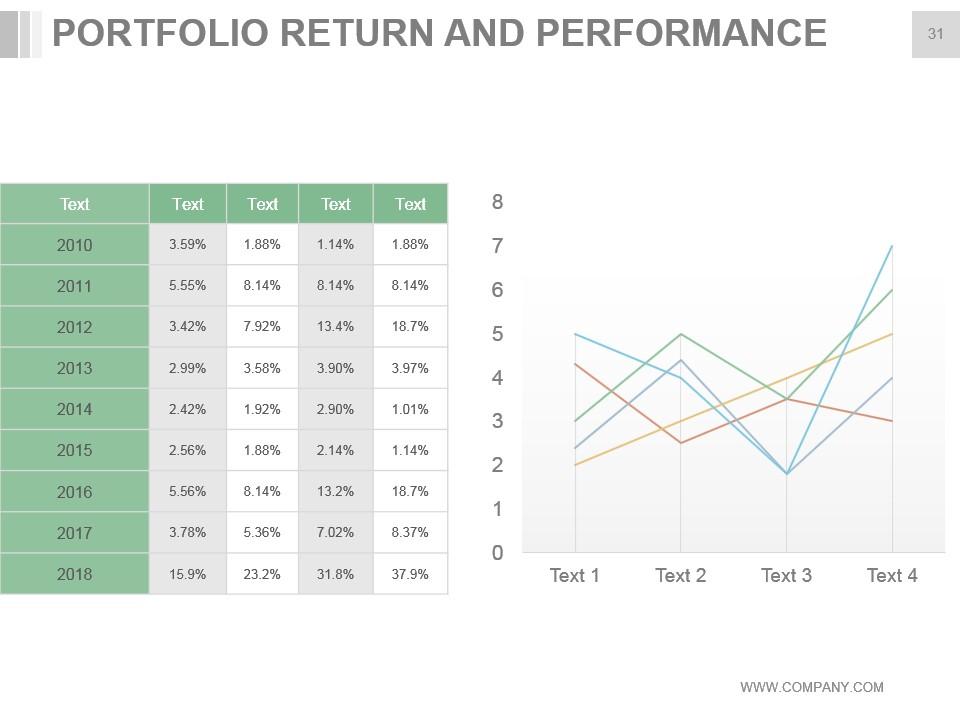
Slide 31: This slide presents portfolio return and performance with number of years and percentage in this.
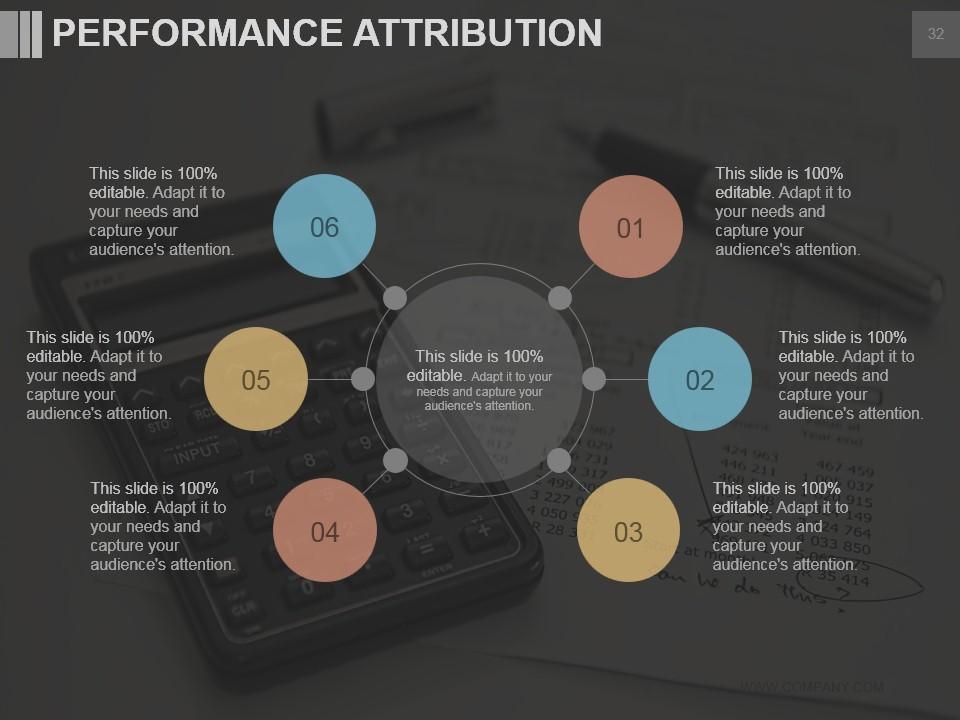
Slide 32: This slide shows performance attribution with six points .You can add your data as per you business requirement.
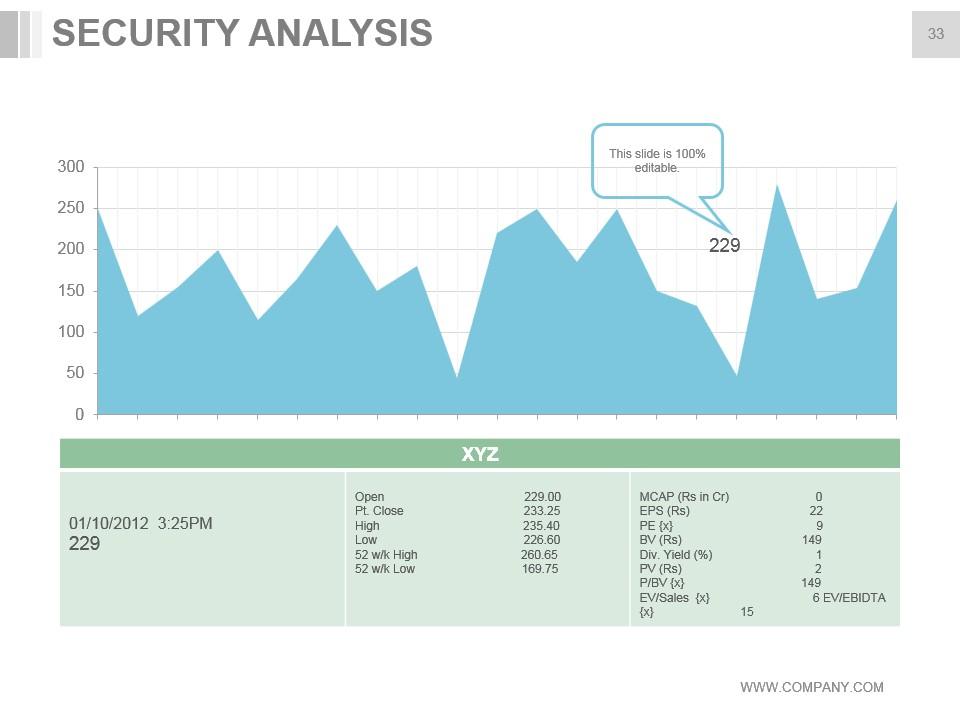
Slide 33: This slide showing security analysis with a graph and the table .You can use as per your business needs.
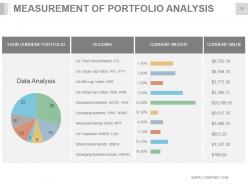
Slide 34: This slide showcases measurement of portfolio analysis. You can use this and add your own content.
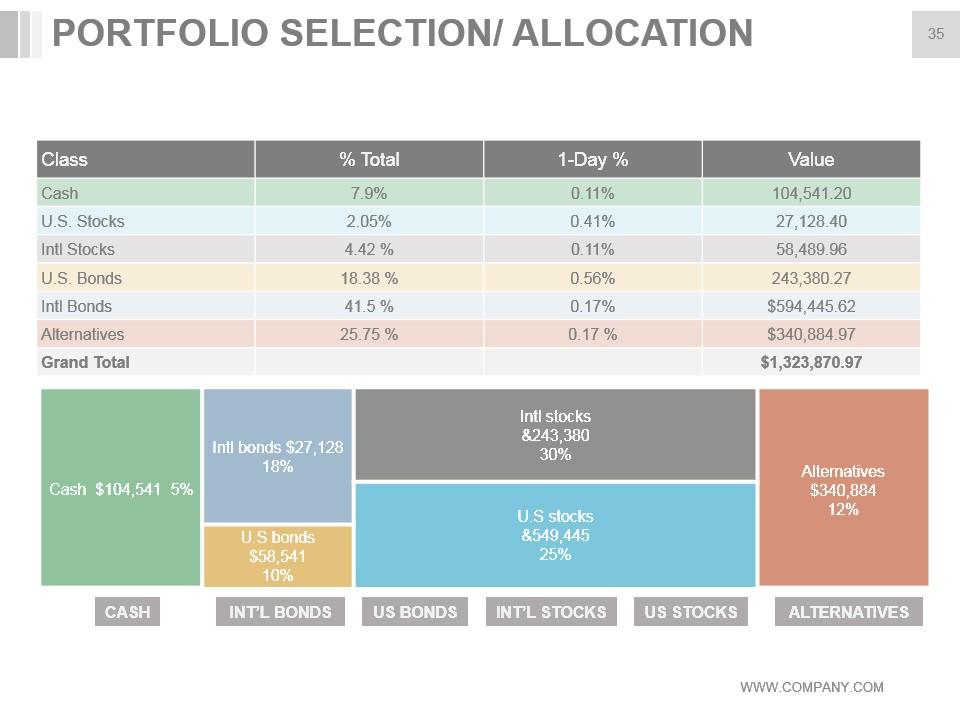
Slide 35: This slide presents portfolio selection/allocation with a table. It further includes some parameters you can add and use it.
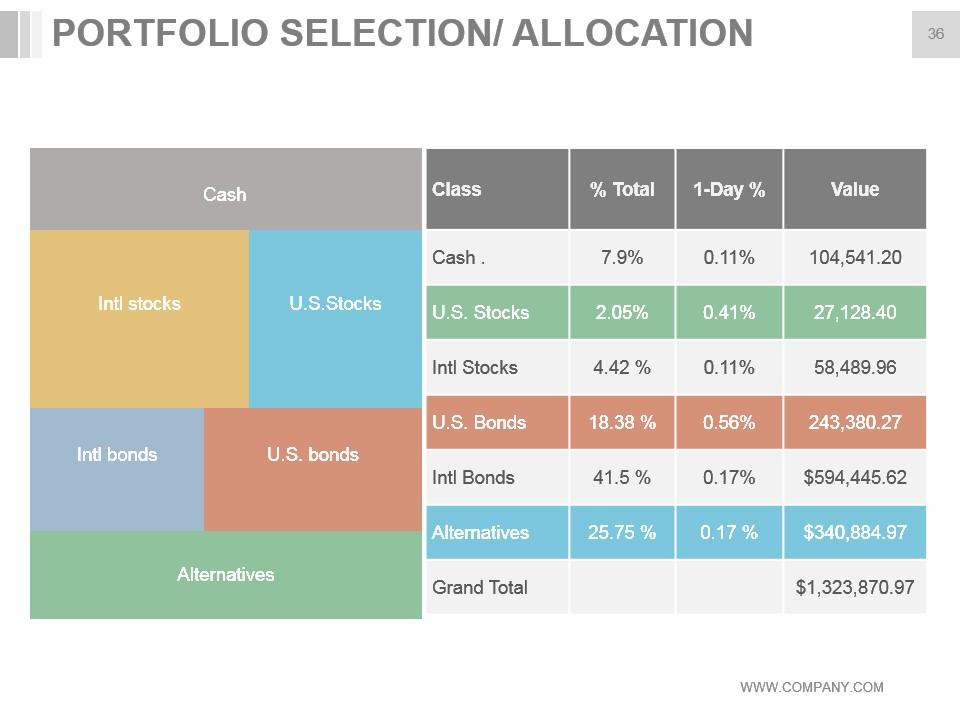
Slide 36: This slide displays portfolio selection. You can use it as per your requirement.
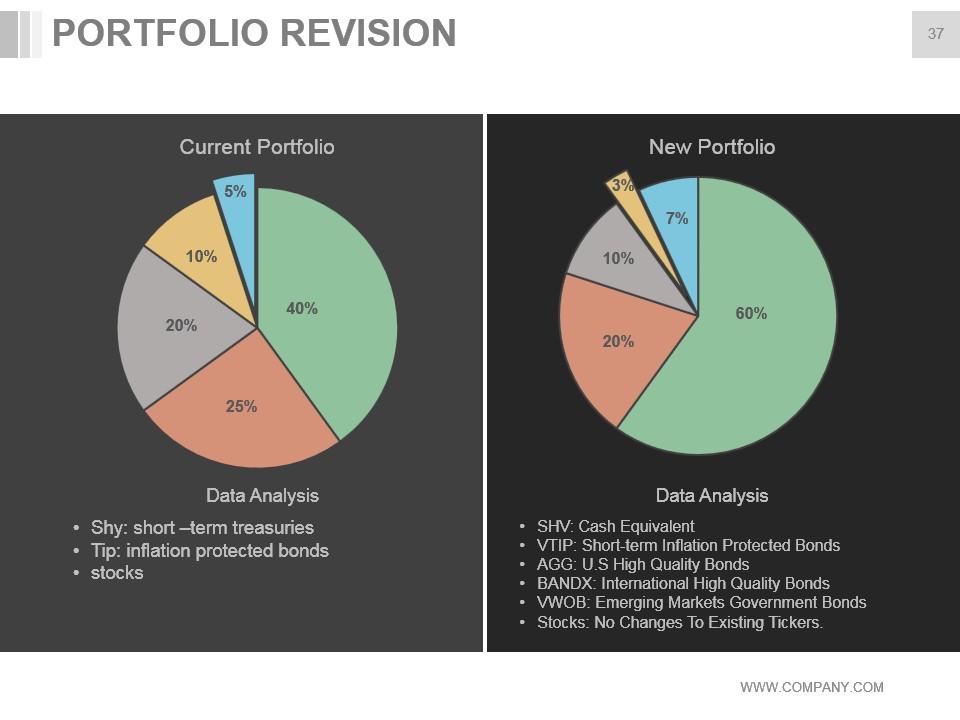
Slide 37: This slide showcases portfolio revision with two pie chart for data analysis.
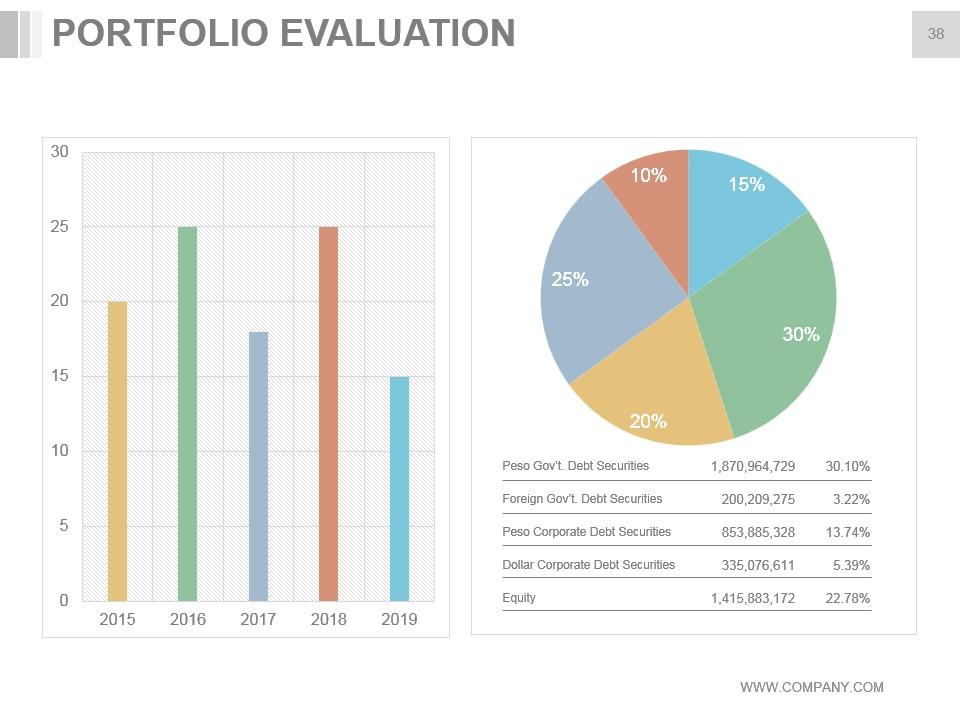
Slide 38: This slide shows portfolio evaluation with a bar graph and pie chart.
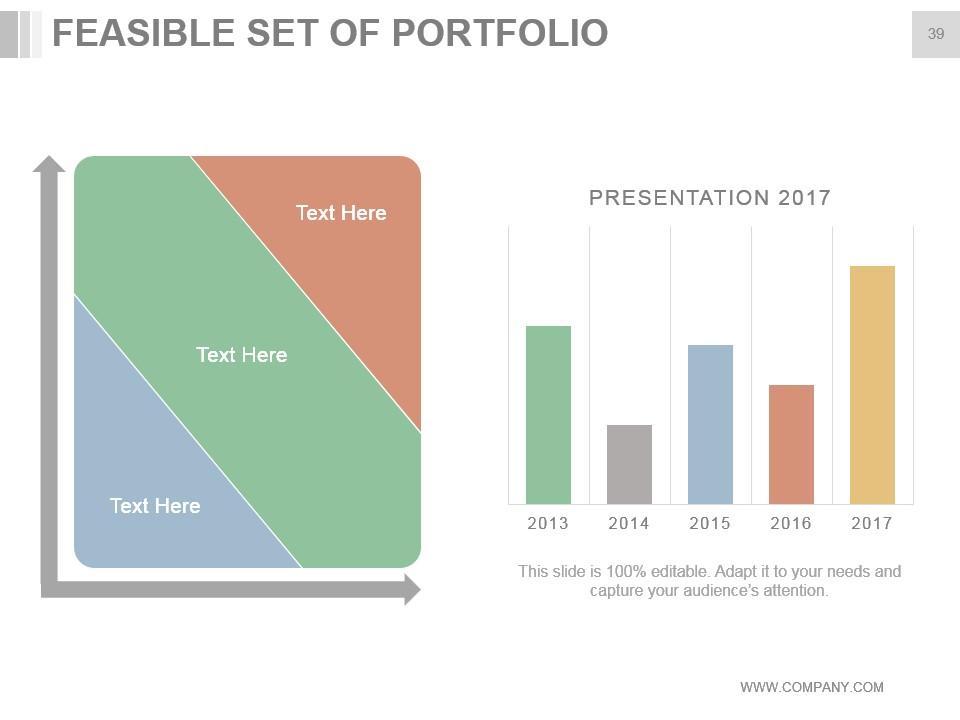
Slide 39: This slide is about feasible set of portfolio. You can use the graph abd bar chart for your own use.
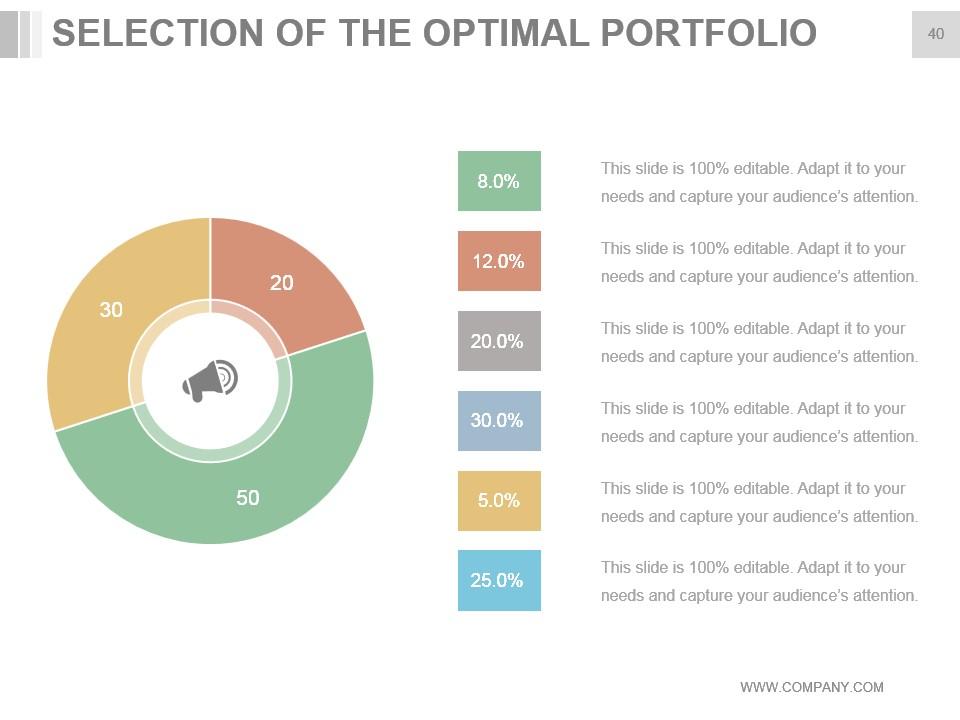
Slide 40: This slide shows selection of optimal portfolio. You can use it as per your requirement.
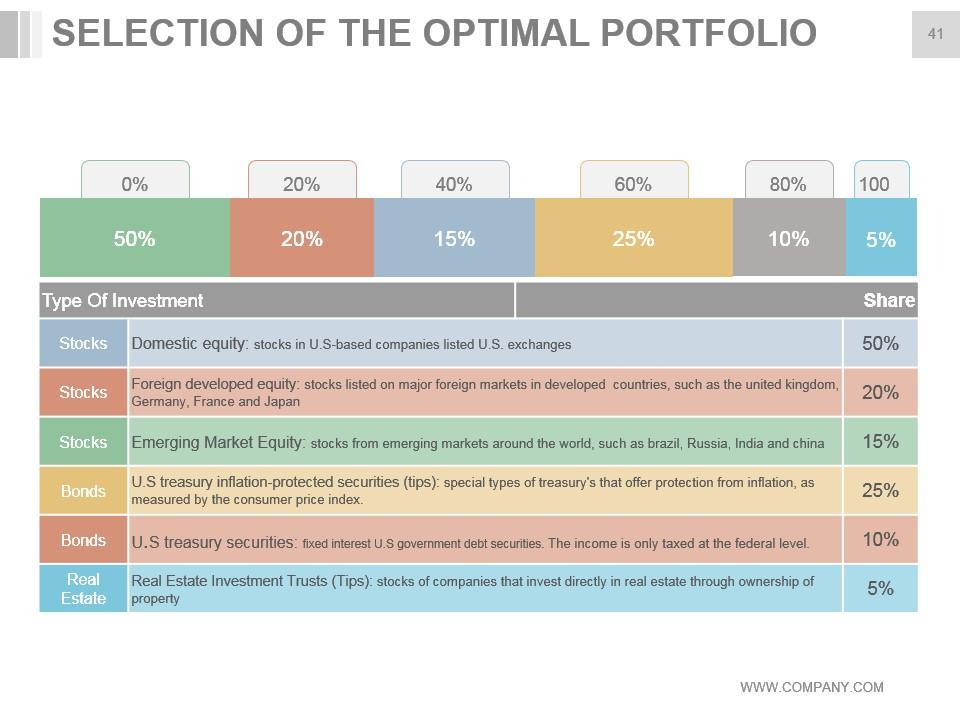
Slide 41: This slide presents selection of the optimal portfolio which shows the types of investment.
Slide 42: This slide showcases key evaluation metrics with relevant icons.
Slide 43: This slide is titled Additional slides.
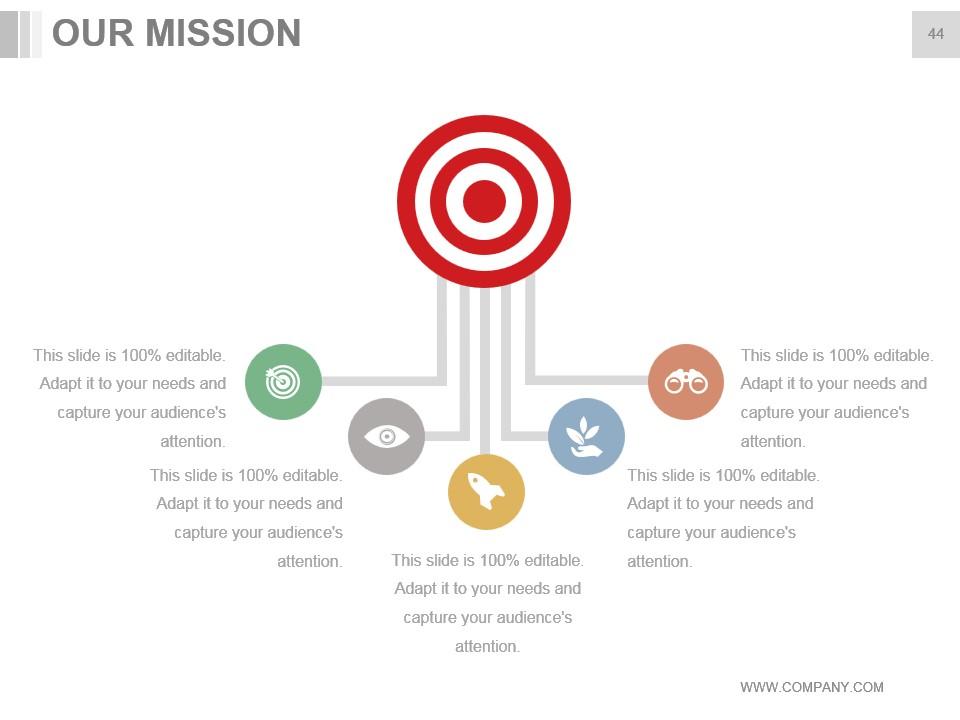
Slide 44: This is Our mission slide with imagery and text boxes to go with.
Slide 45: This is Our team slide with names and designation.
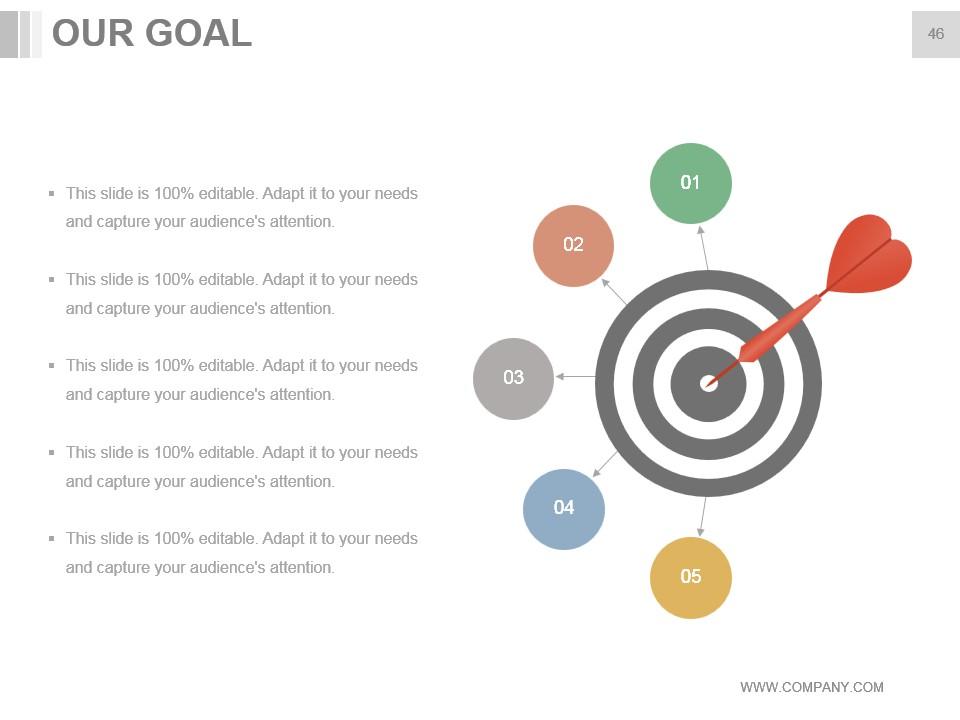
Slide 46: This is an Our Goal slide. State your important goals here.
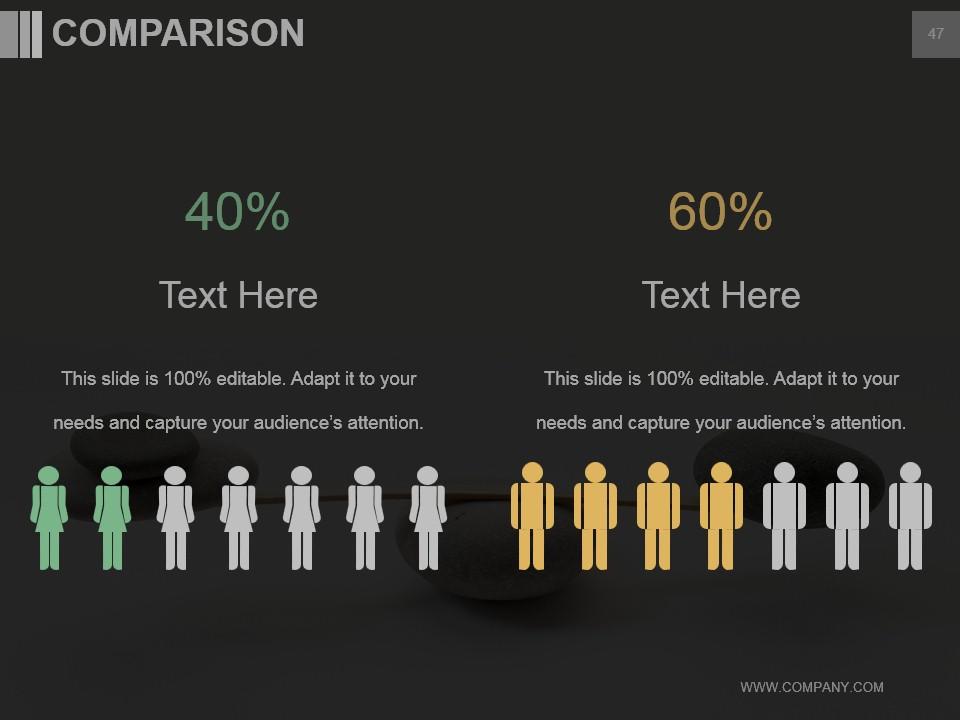
Slide 47: This slide shows comparison. You can use as peryour requirement.
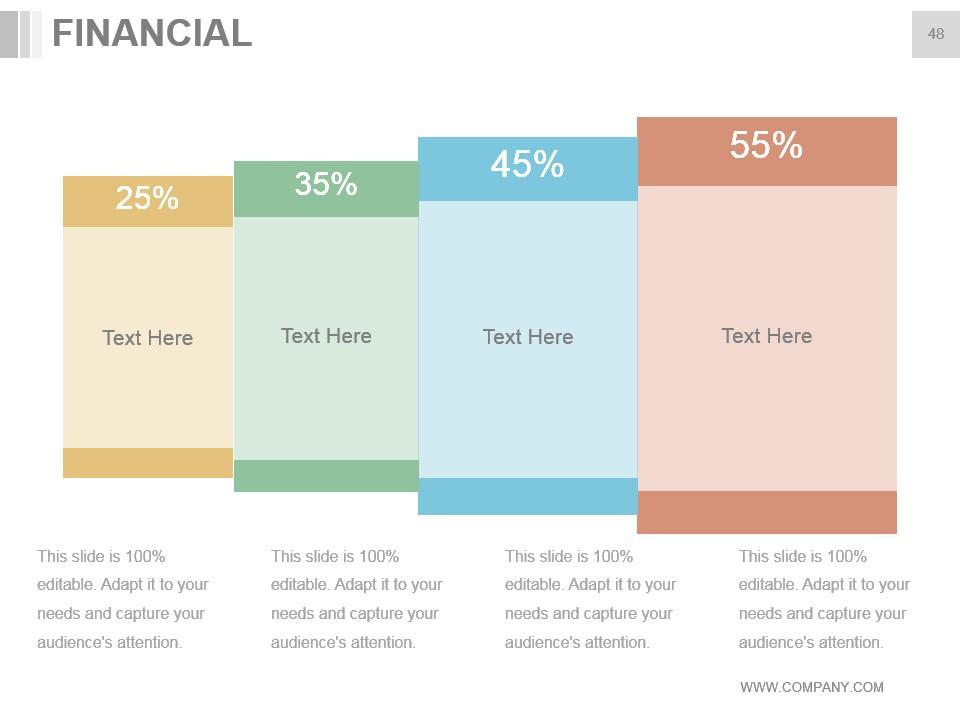
Slide 48: This slide presents Financial scores to display.
Slide 49: This is a Business Quotes slide to quote something you believe in.
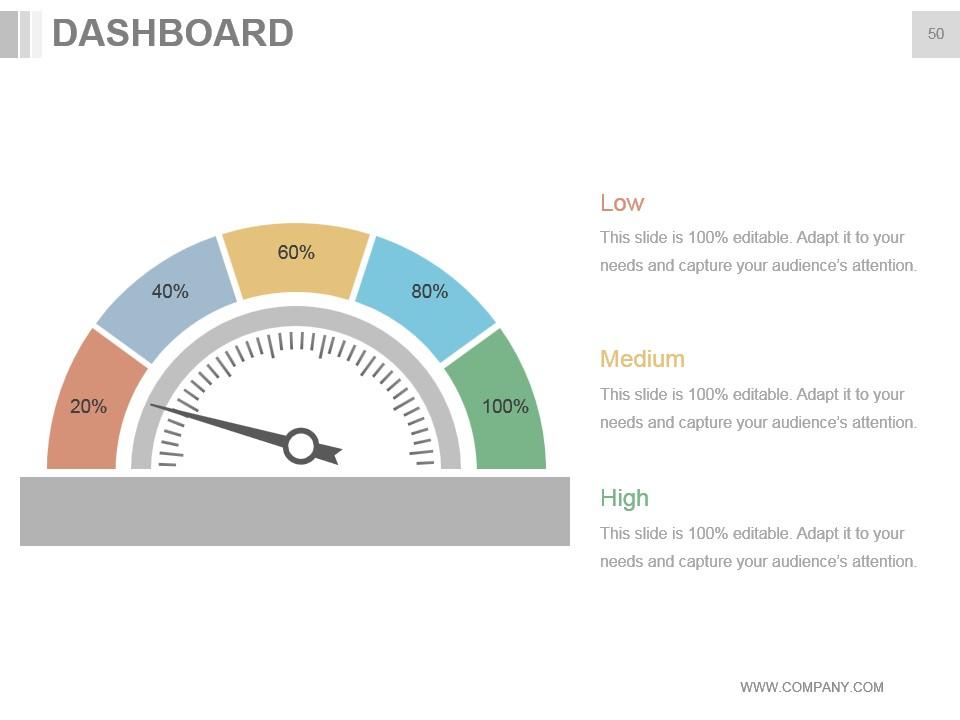
Slide 50: This is a Dashboard slide to show- Strategic System, Success, Goal Process, Sales Review, Communication Study.
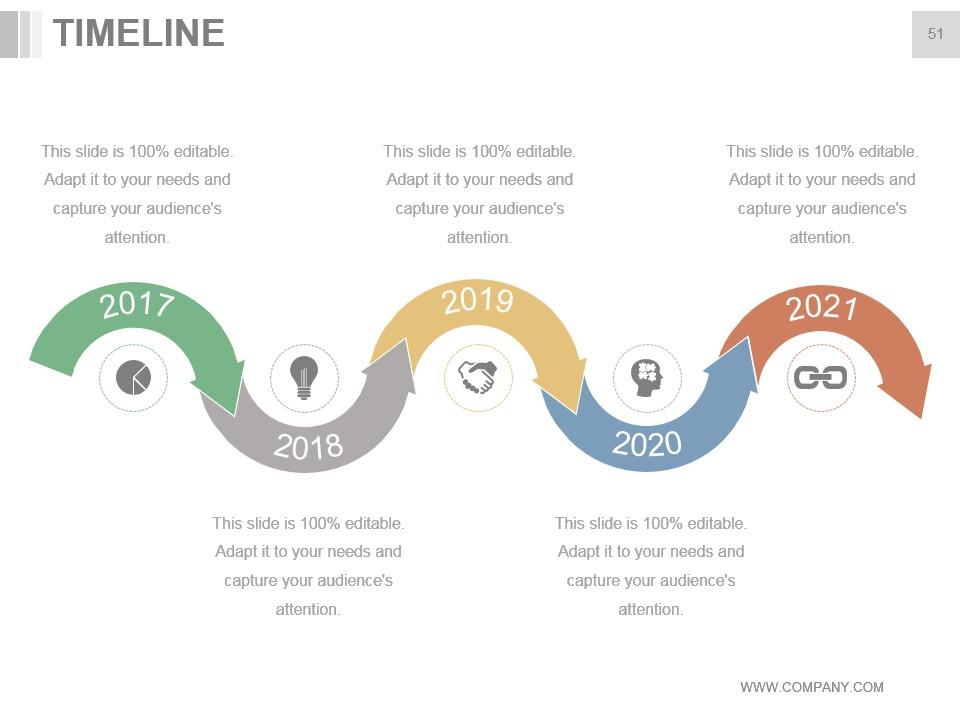
Slide 51: This is a Timelines slide to show- Plan, Budget, Schedule, Review.
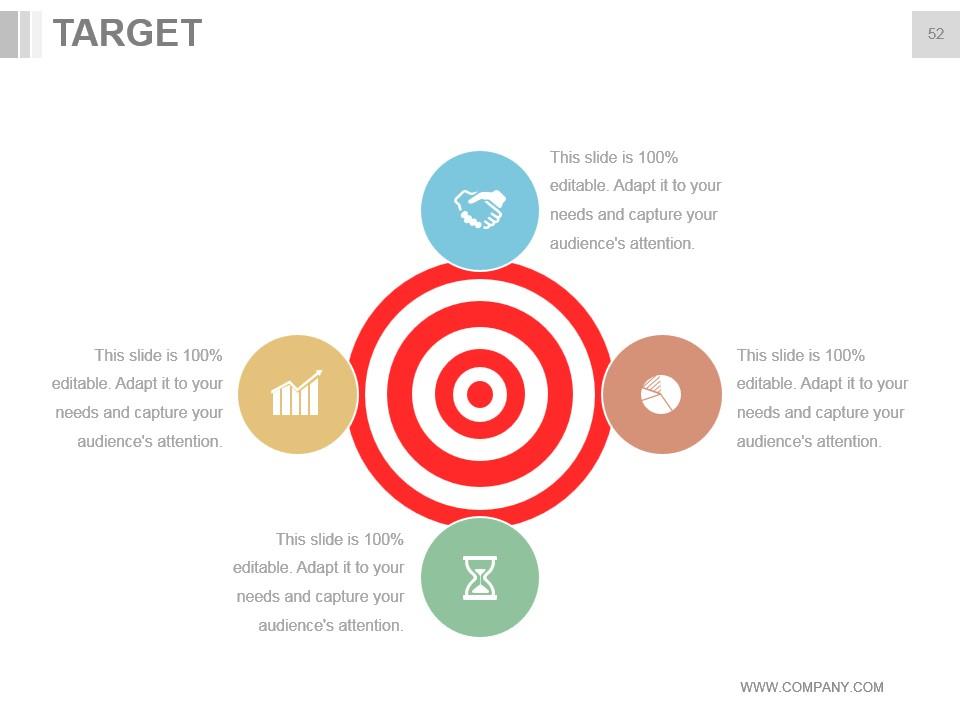
Slide 52: This slide shows Target image with text boxes.
Slide 53: This slide shows a Matrix in terms of High and Low.
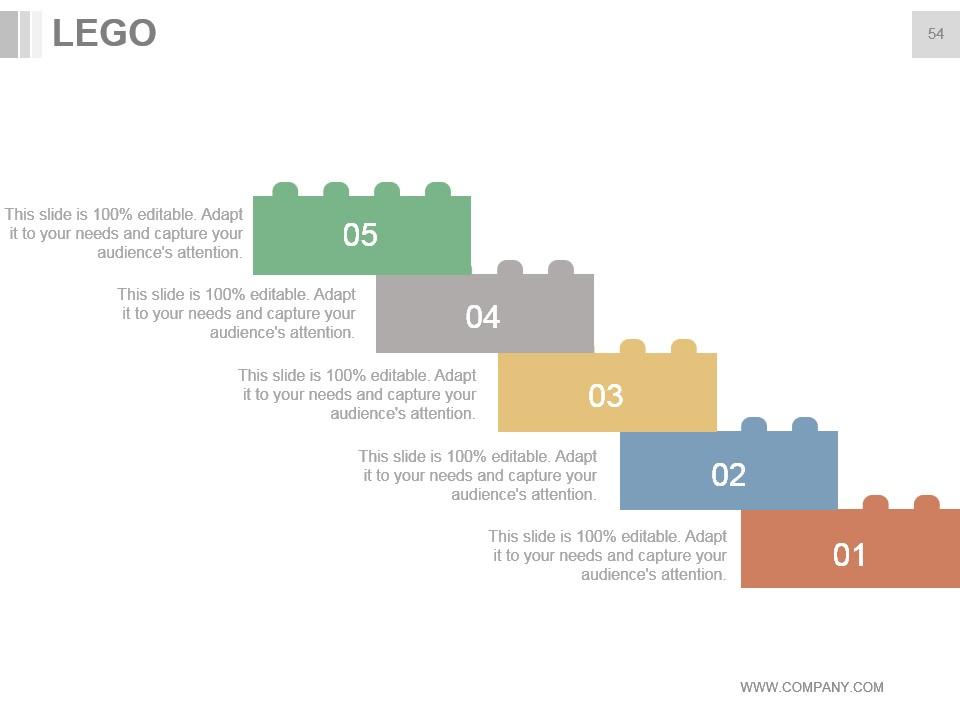
Slide 54: This is a LEGO slide with text boxes to show information.
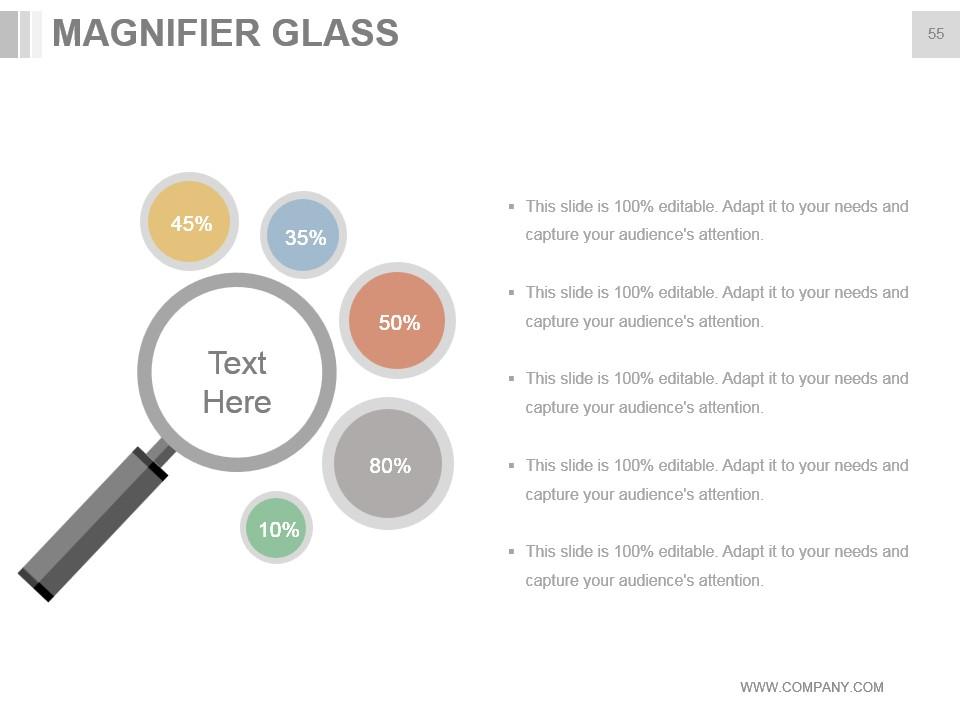
Slide 55: This slide shows a Magnifying glass with text boxes.
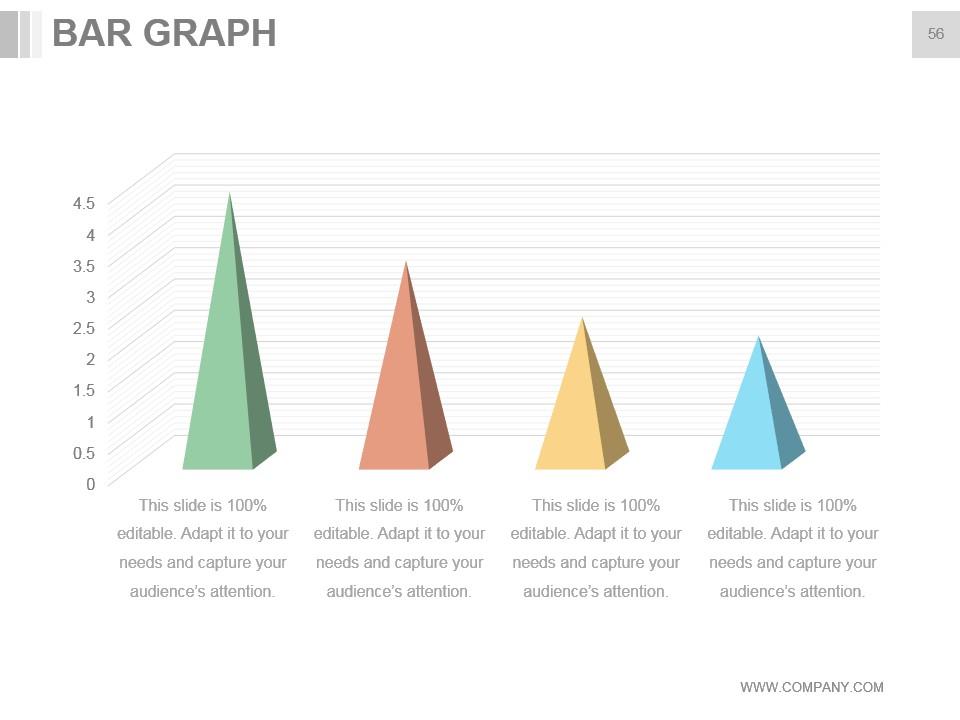
Slide 56: This slide shows a Magnifier with tools and Bar graph.
Slide 57: This is a Thank You slide with image.
Quality Management Principles To Managing Stock Portfolios Powerpoint Presentation Slides with all 57 slides:
Fatigue ebbs away with our Quality Management Principles To Managing Stock Portfolios Powerpoint Presentation Slides. Cool off in fabulous comfort.
-
Best Representation of topics, really appreciable.
-
Appreciate the research and its presentable format.


