Sales Performance Review Powerpoint Presentation Slides
Introducing Sales Performance Review PowerPoint Presentation Slides. Modern organizations execute marketing performance system to be in control of the business. Sales management PowerPoint complete deck contains professional slides such as business overview, financial highlights, product offerings, sales performance dashboards, quarterly sales review, project updates, process map, customers and vendors, sales KPIs, competitive analysis, business prospects, business process roadmap, etc. Sales management is very important to measure the company’s productivity. New strategies should be implemented where poor performance is identified. Sales plan PowerPoint template will be helpful in analyzing sales revenue and growth. In addition, marketing performance evaluation PPT slide also be used for topics like sales decision making process, sales performance management, sales review, retail performance, marketing performance. Download the retail performance presentation design to present the sales strategy, communicate the goals that need to be achieved and how they are going to be measured. Our Sales Performance Review Powerpoint Presentation Slides will gladden the gathering. They will appreciate the aesthetics.
- Google Slides is a new FREE Presentation software from Google.
- All our content is 100% compatible with Google Slides.
- Just download our designs, and upload them to Google Slides and they will work automatically.
- Amaze your audience with SlideTeam and Google Slides.
-
Want Changes to This PPT Slide? Check out our Presentation Design Services
- WideScreen Aspect ratio is becoming a very popular format. When you download this product, the downloaded ZIP will contain this product in both standard and widescreen format.
-

- Some older products that we have may only be in standard format, but they can easily be converted to widescreen.
- To do this, please open the SlideTeam product in Powerpoint, and go to
- Design ( On the top bar) -> Page Setup -> and select "On-screen Show (16:9)” in the drop down for "Slides Sized for".
- The slide or theme will change to widescreen, and all graphics will adjust automatically. You can similarly convert our content to any other desired screen aspect ratio.
Compatible With Google Slides

Get This In WideScreen
You must be logged in to download this presentation.
PowerPoint presentation slides
Presenting Sales Performance Review PowerPoint Presentation Slides. This PowerPoint deck contains 66 professional PPT slides. All slides are 100% editable in PowerPoint. Edit the font size, font color, graphic colors, and slide background without any hassle. The designs have text holders to add your presentation content. Data-driven charts and graphs help you present your research in easy to understand, visual style. Downloaded presentation in both widescreen) and standard screen. PPT slides are compatible with Google Slides.
People who downloaded this PowerPoint presentation also viewed the following :
Content of this Powerpoint Presentation
Slide 1: This slide presesnts Sales Performance Review. Add your company name and get started.
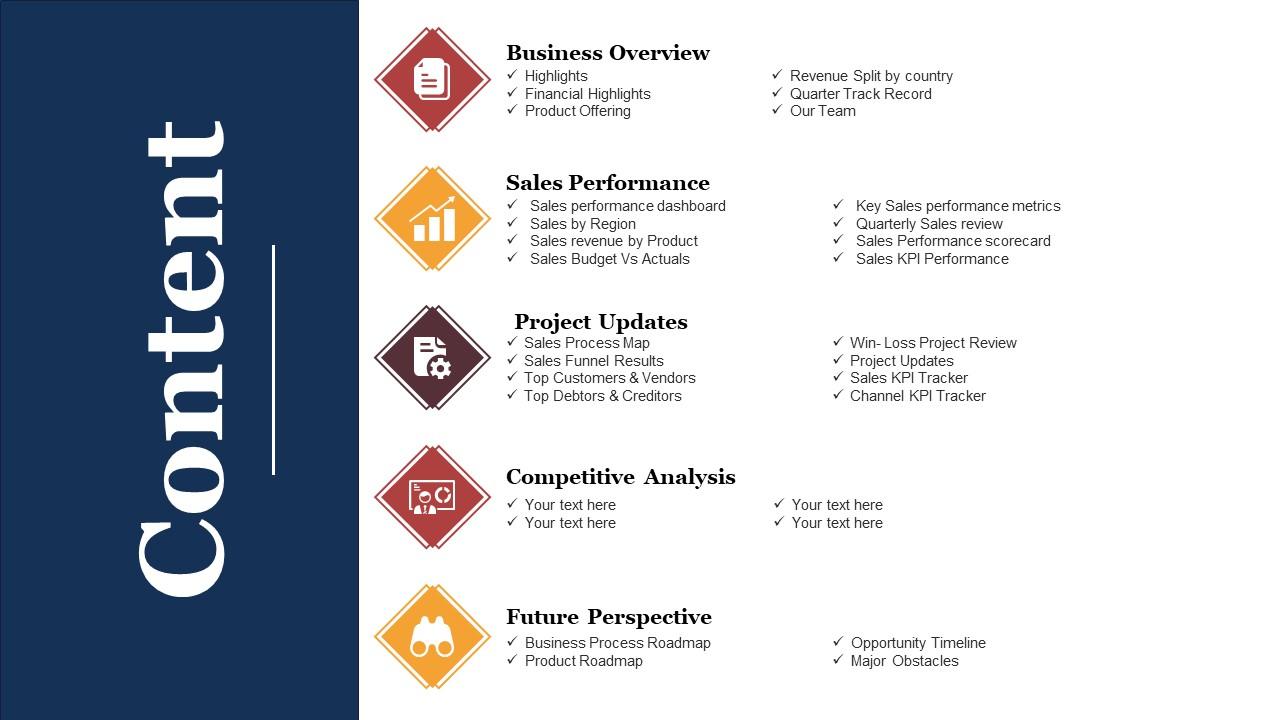
Slide 2: This slide showcases Contents with the following constituents- Business Overview, Sales Performance, Project Updates, Competitive Analysis, Future Perspective.
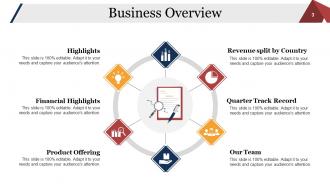
Slide 3: This slide showcases Business Overview consisting of- Revenue split by Country, Quarter Track Record, Our Team, Product Offering, Financial Highlights, Highlights.
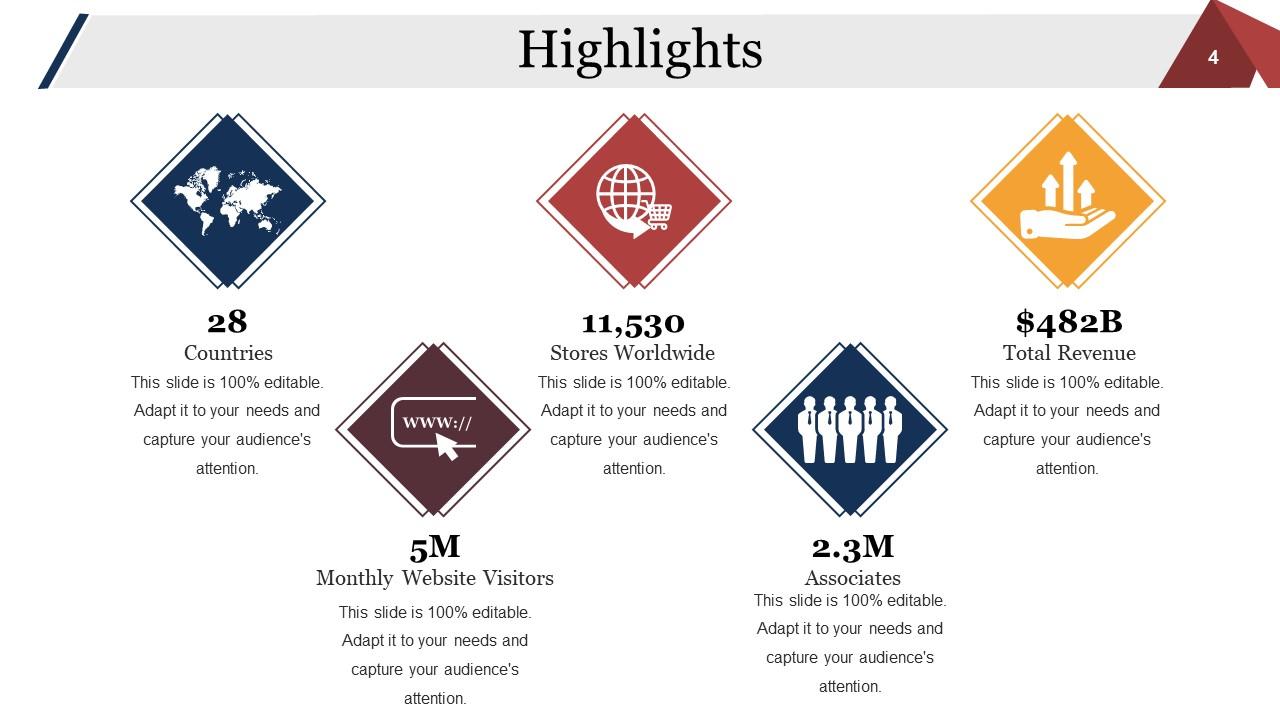
Slide 4: This slide showcases Highlights with icon imagery.
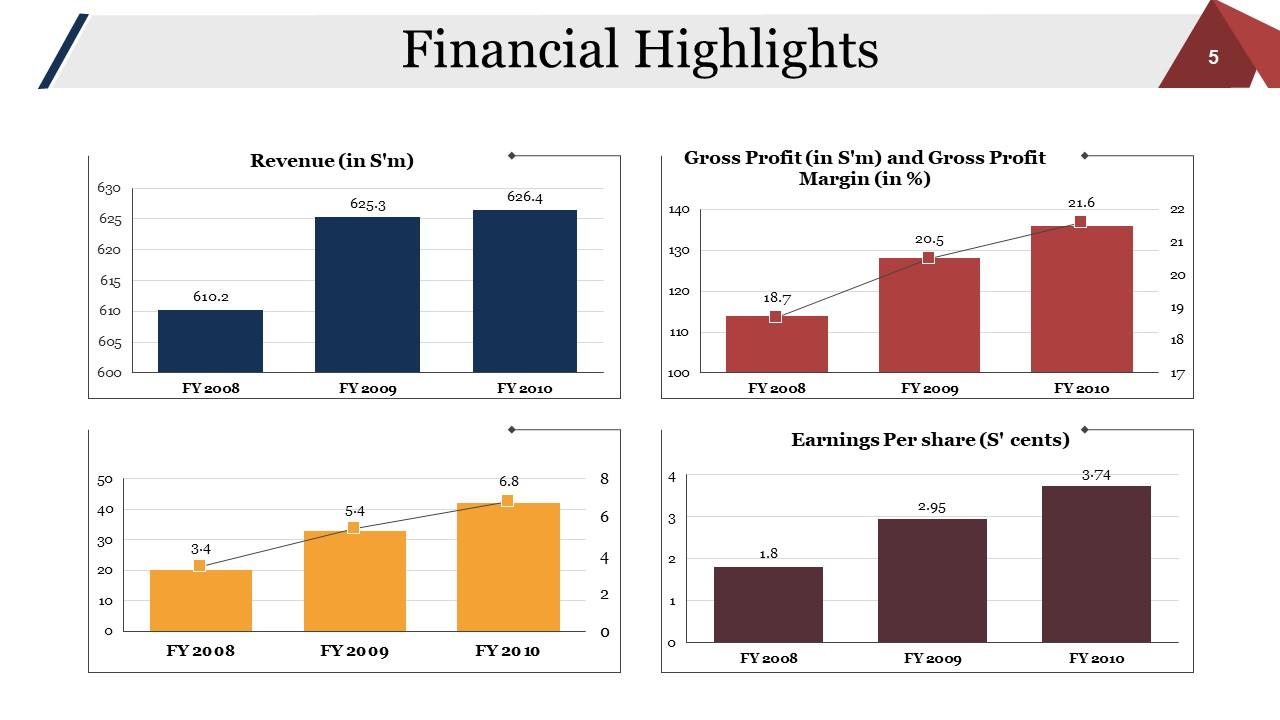
Slide 5: This slide displays Financial Highlights. Specify the financial performance of the company here.
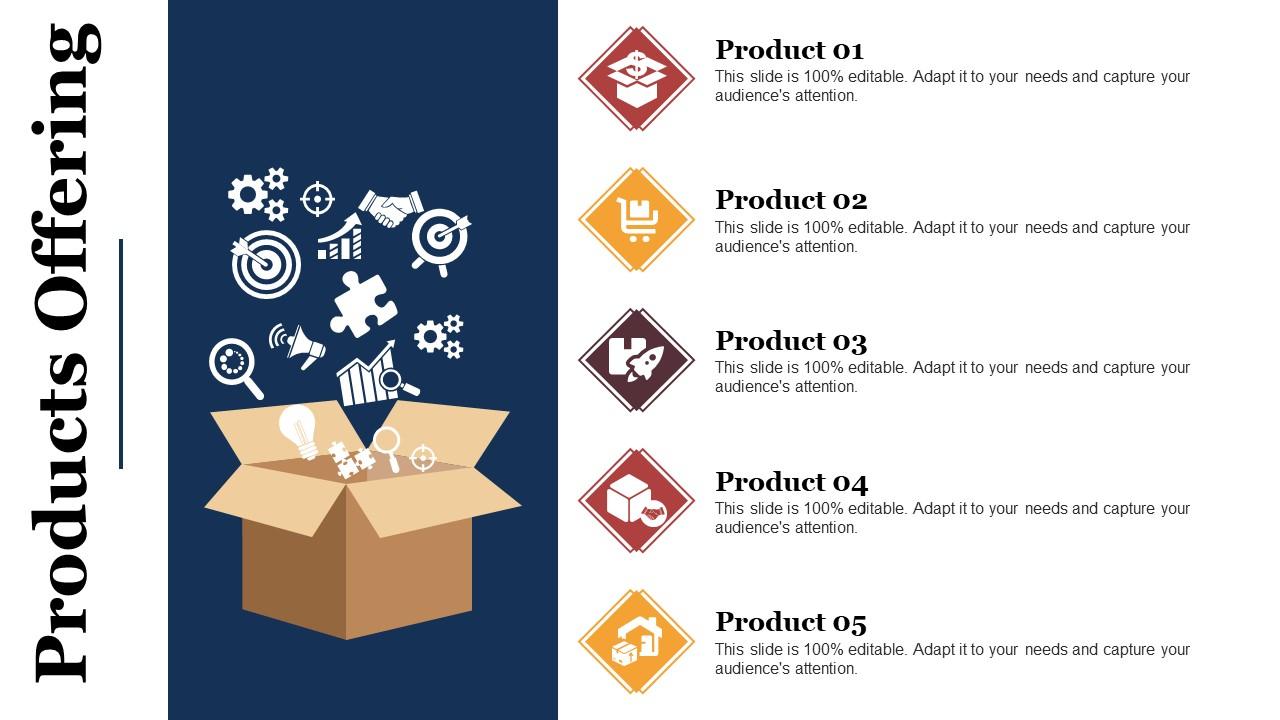
Slide 6: This slide presents Products Offering. Mention the products that are being offered by the company.
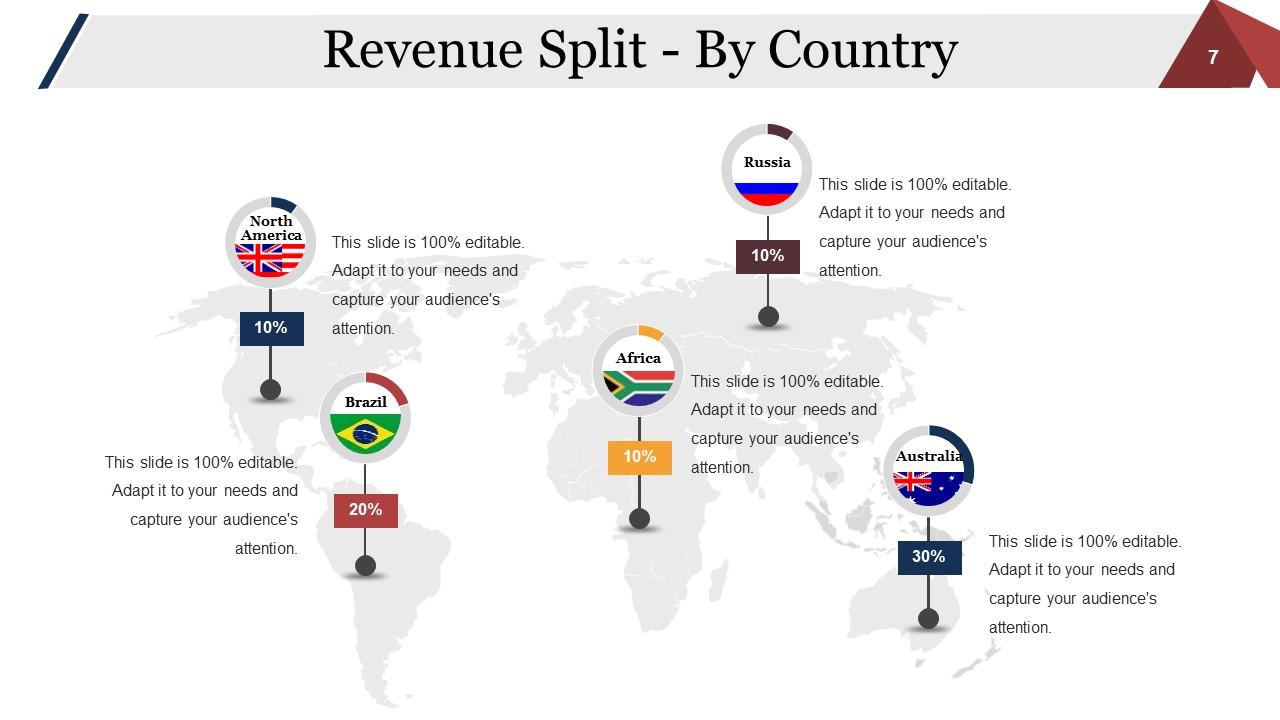
Slide 7: This slide showcases Revenue Split - By Country.
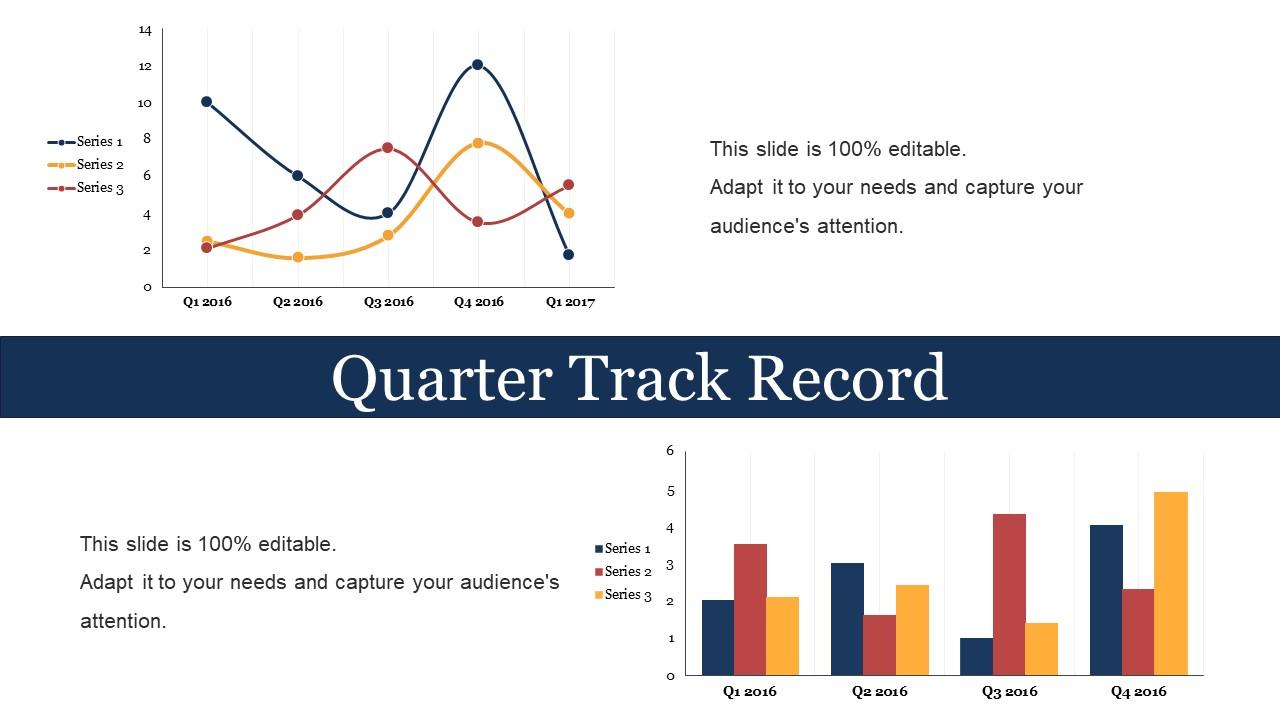
Slide 8: This slide showcases Quarter Track Record in a graphical form.
Slide 9: This is Our Team slide with name and designation to fill.
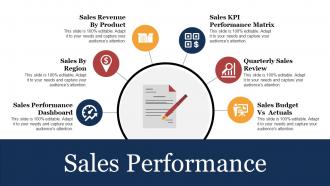
Slide 10: This slide showcases Sales Performance with- Sales Budget Vs Actuals, Sales Performance Dashboard, Quarterly Sales Review, Sales By Region, Sales Revenue By Product, Sales KPI Performance Matrix.
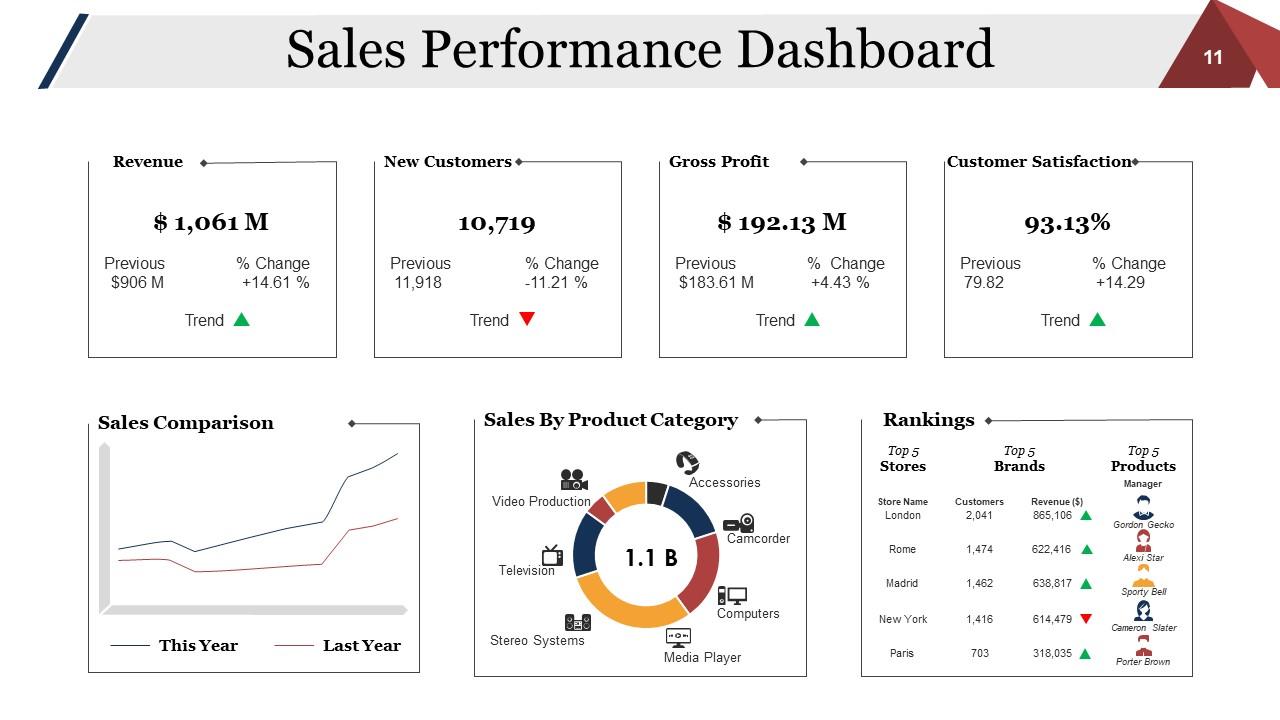
Slide 11: This slide showcases Sales Performance Dashboard.
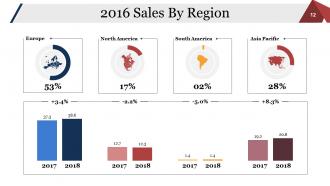
Slide 12: This slide showcases 2016 Sales By Region in charts and graphs.
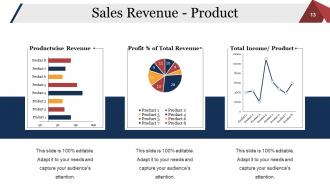
Slide 13: This slide showcases Sales Revenue - Product in charts and graphs.
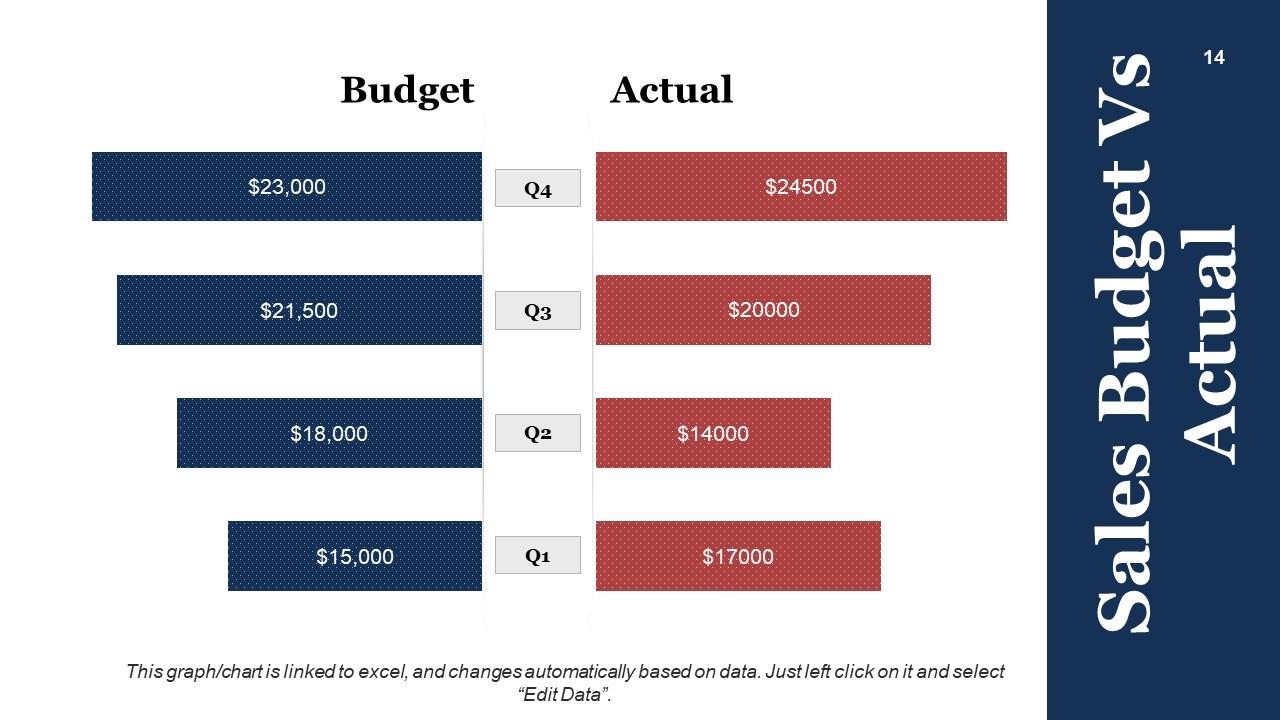
Slide 14: This slide showcases Sales Budget Vs Actual in a graphical form.
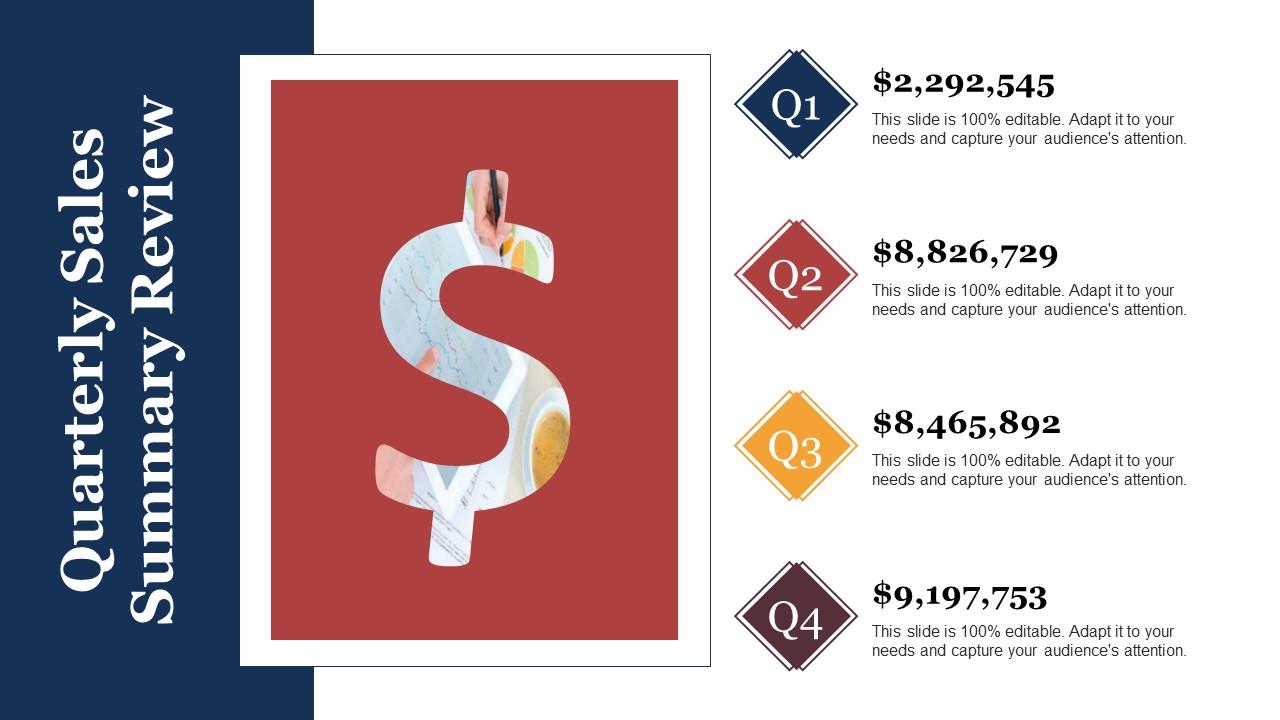
Slide 15: This slide presents Quarterly Sales Summary Review.
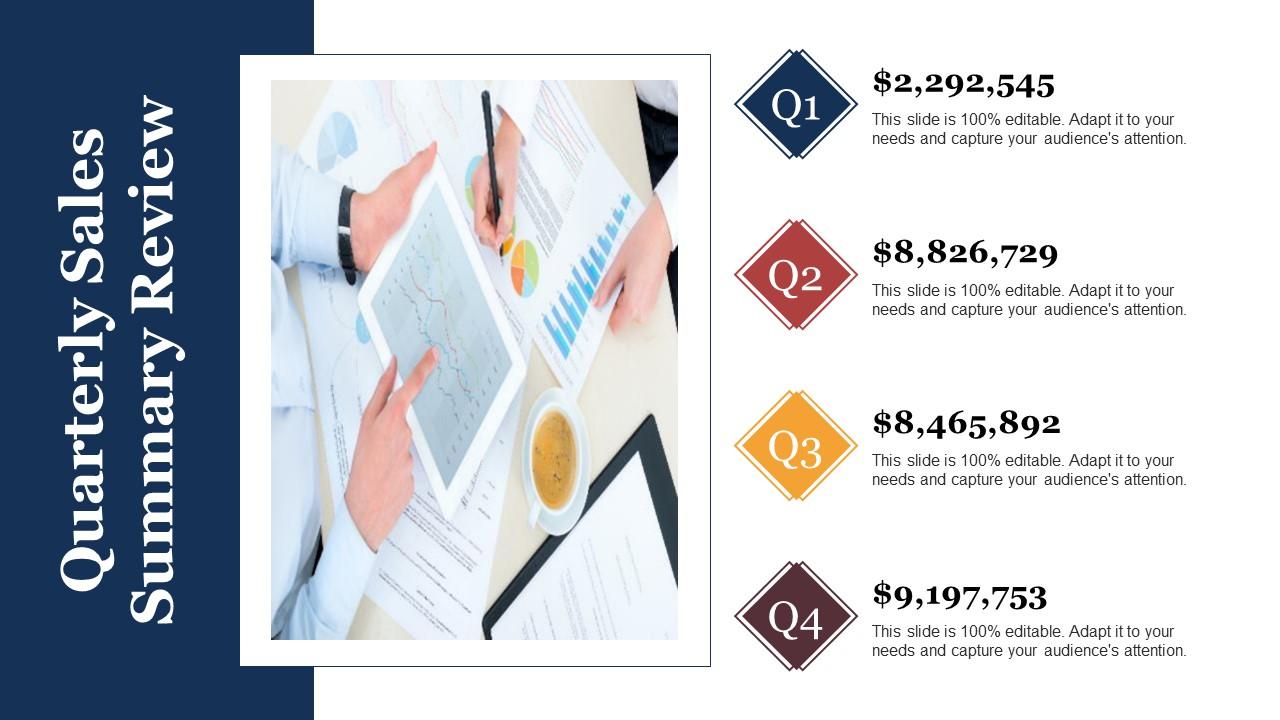
Slide 16: This is another slide showing Quarterly Sales Summary Review.
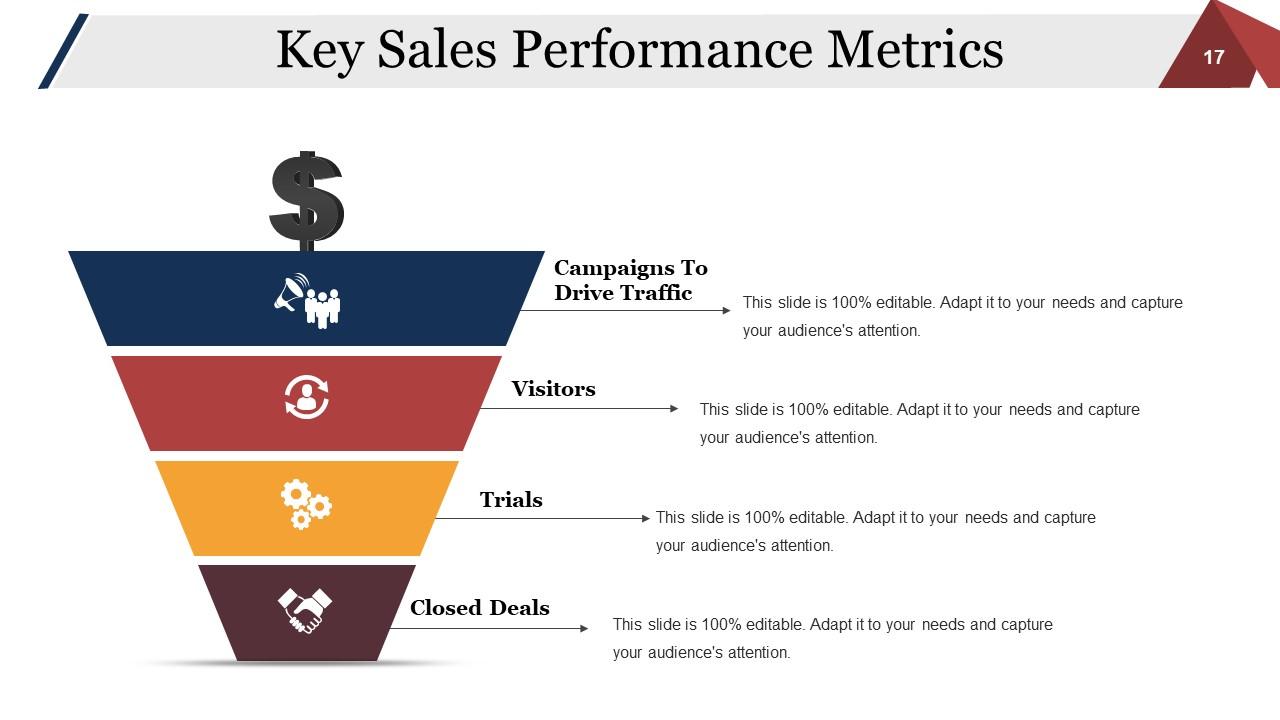
Slide 17: This slide showcases Key Sales Performance Metrics. Show the follwing here- Campaigns To Drive Traffic, Visitors, Trials, Closed Deals.
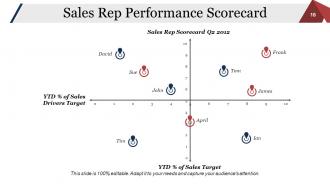
Slide 18: This slide Sales Rep Performance Scorecard.
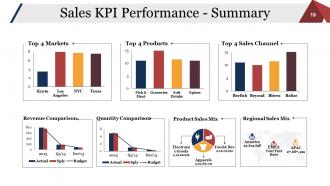
Slide 19: This slide showcases Sales KPI Performance - Summary in charts and graphs. Present your own Sales KPI Perfomance- Summary here.
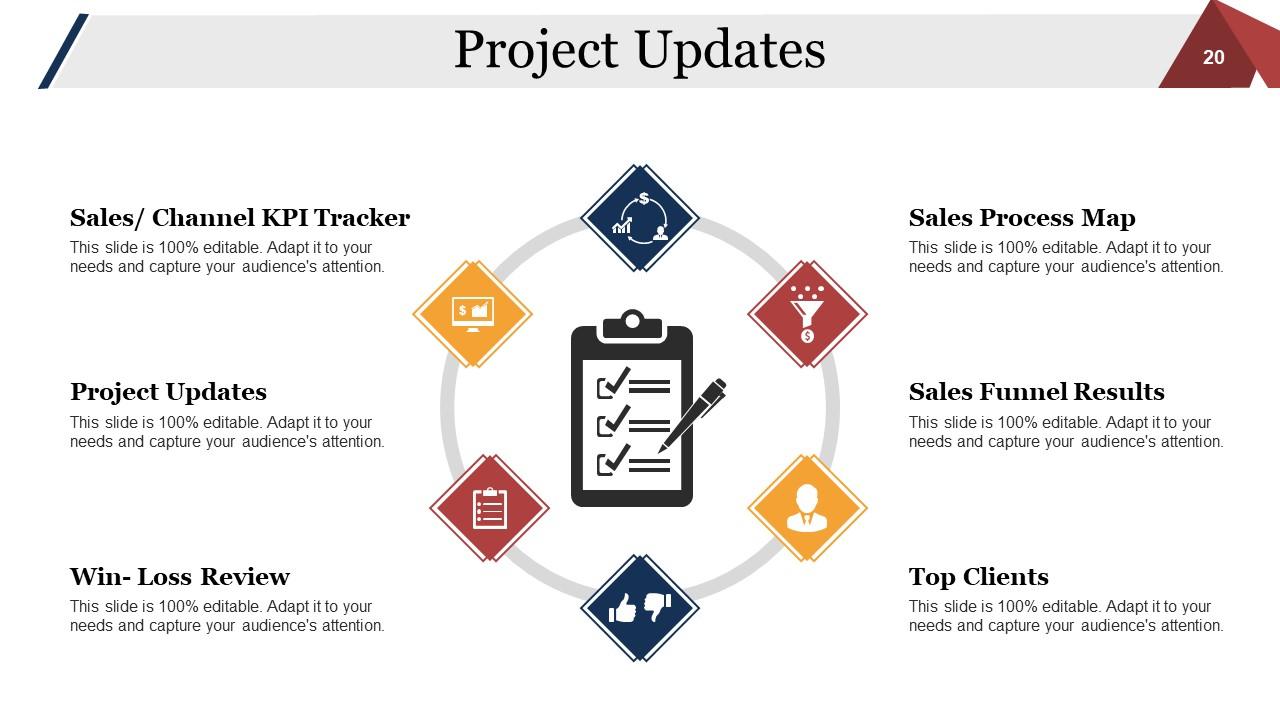
Slide 20: This slide presents Project Updates with- Sales Process Map, Sales Funnel Results, Top Clients, Sales/ Channel KPI Tracker, Win- Loss Review.
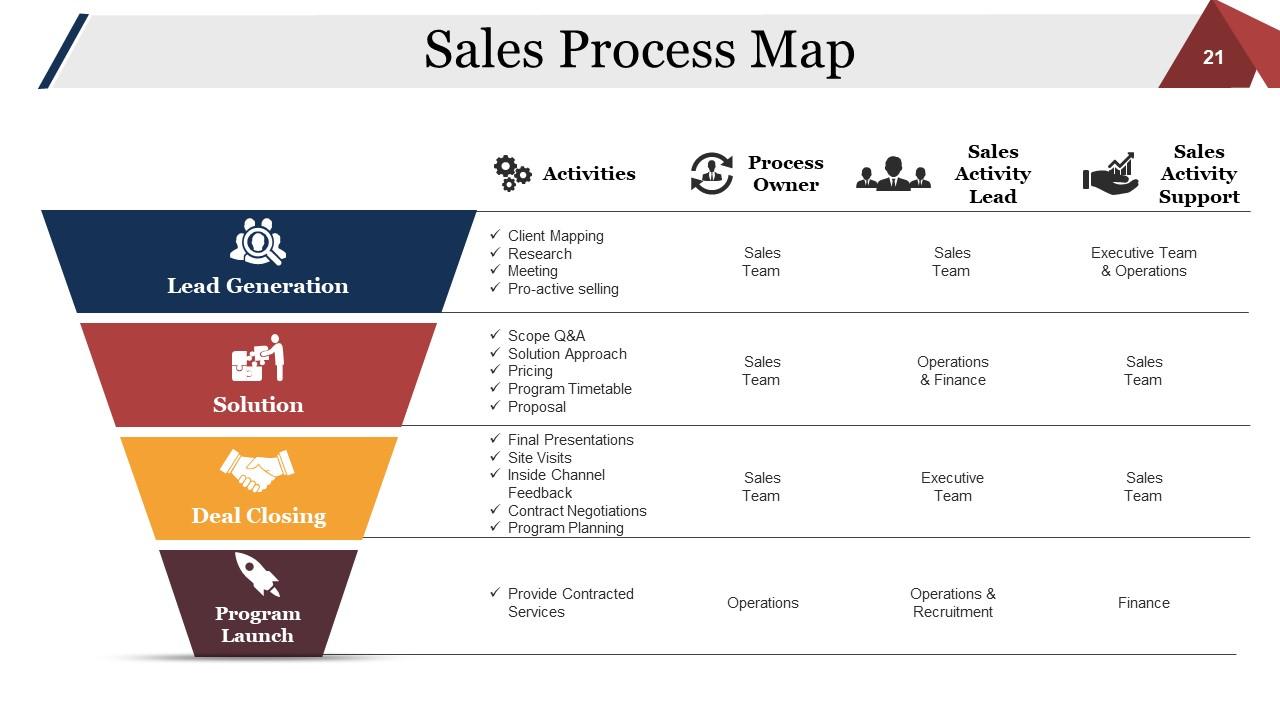
Slide 21: This is Sales Process Map slide showing- Solution Lead Generation Program Launch Deal Closing
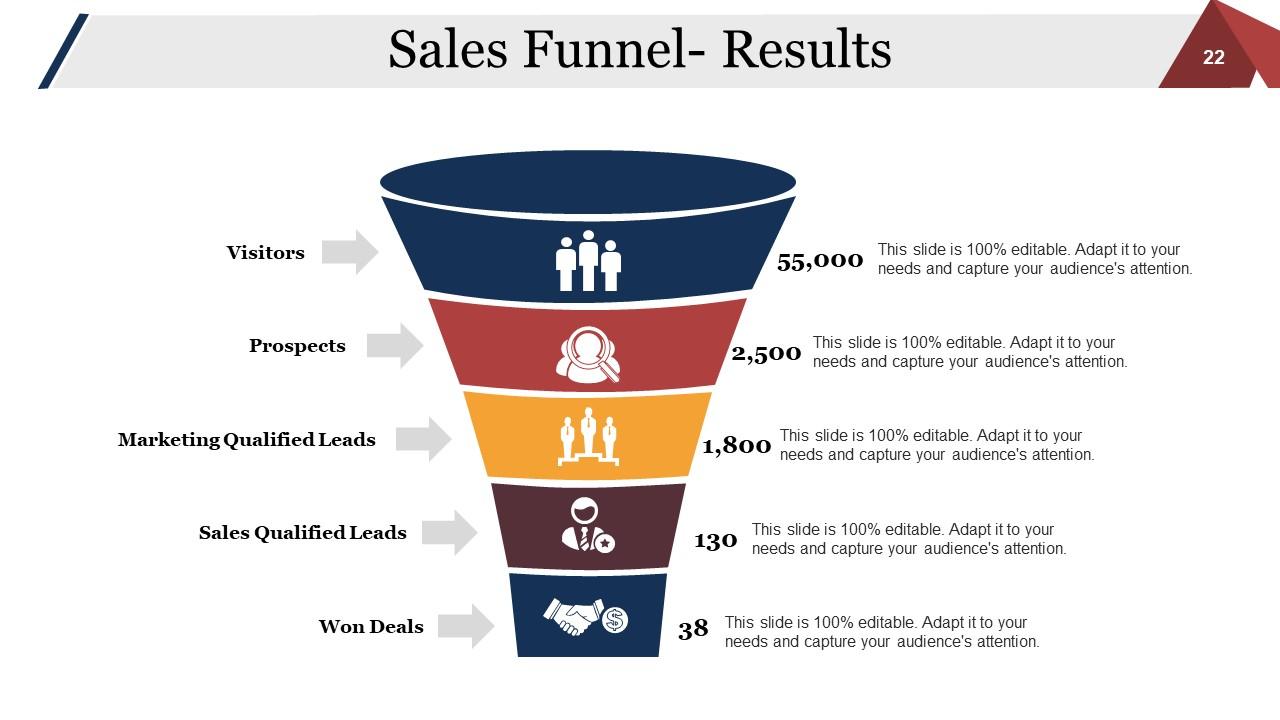
Slide 22: This slide showcases Sales Funnel- Results. Use it as per need.
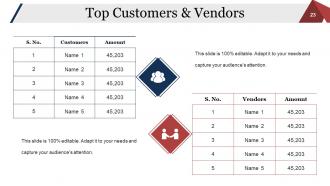
Slide 23: This slide showcases Top Customers & Vendors in a tabular form.
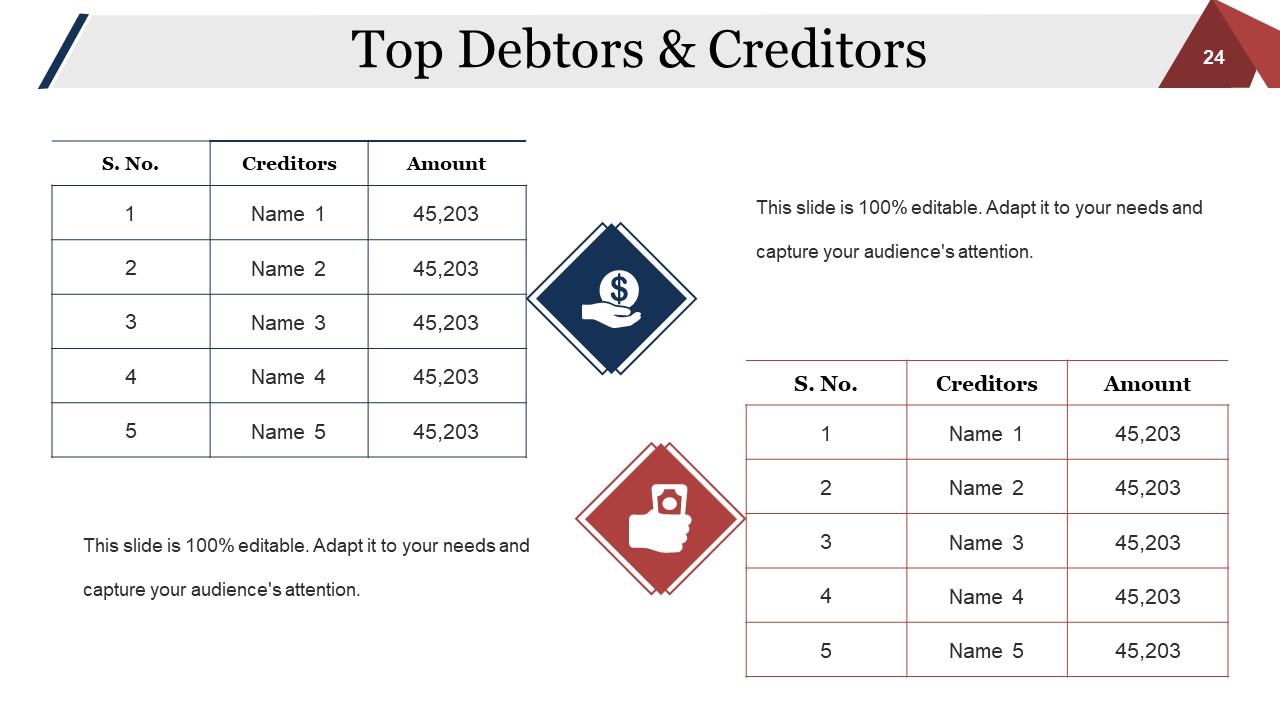
Slide 24: This slide showcases Top Debtors & Creditors in a tabular form.
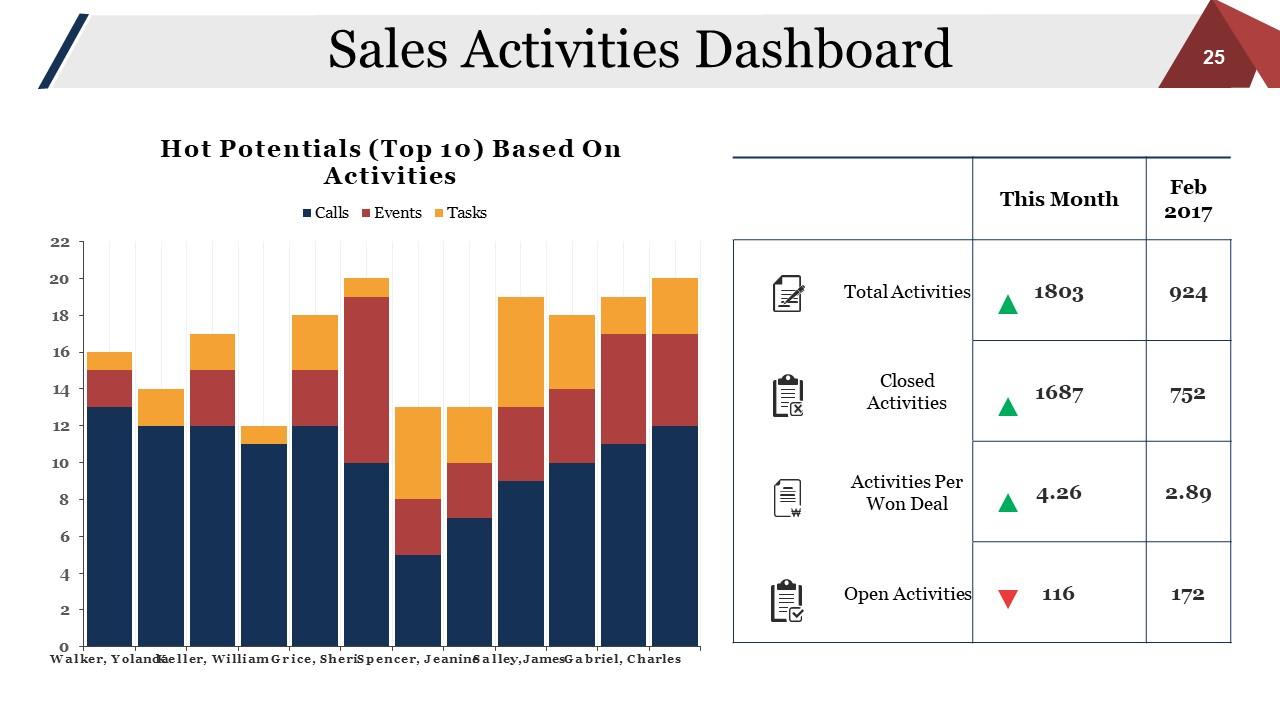
Slide 25: This slide showcases Sales Activities Dashboard in a garphical form.
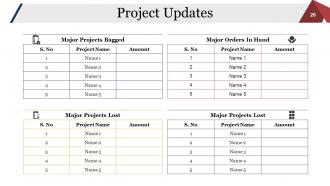
Slide 26: This slide showcases Project Updates in a tabular form.
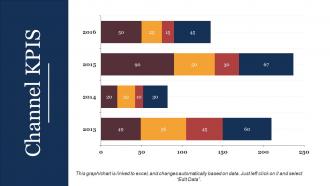
Slide 27: This slide presents Channel KPIS in a bar graph/ chart form.
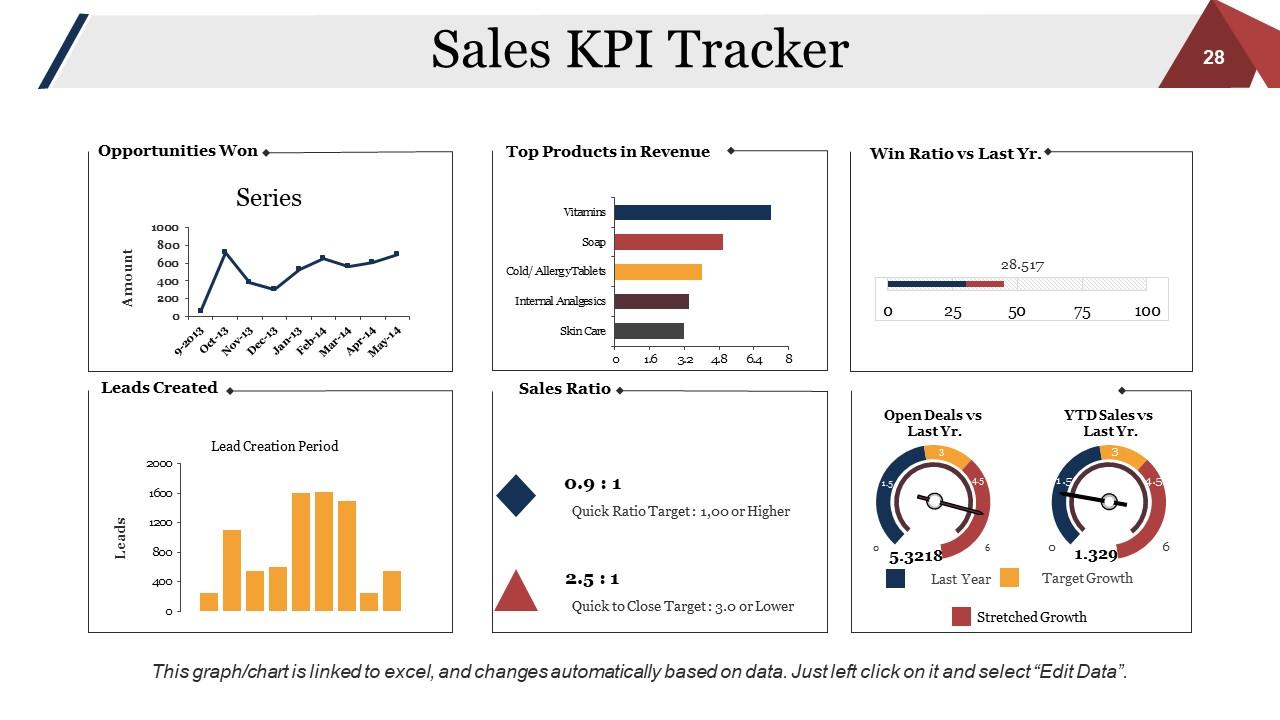
Slide 28: This slide showcases Sales KPI Tracker in charts and graphs.
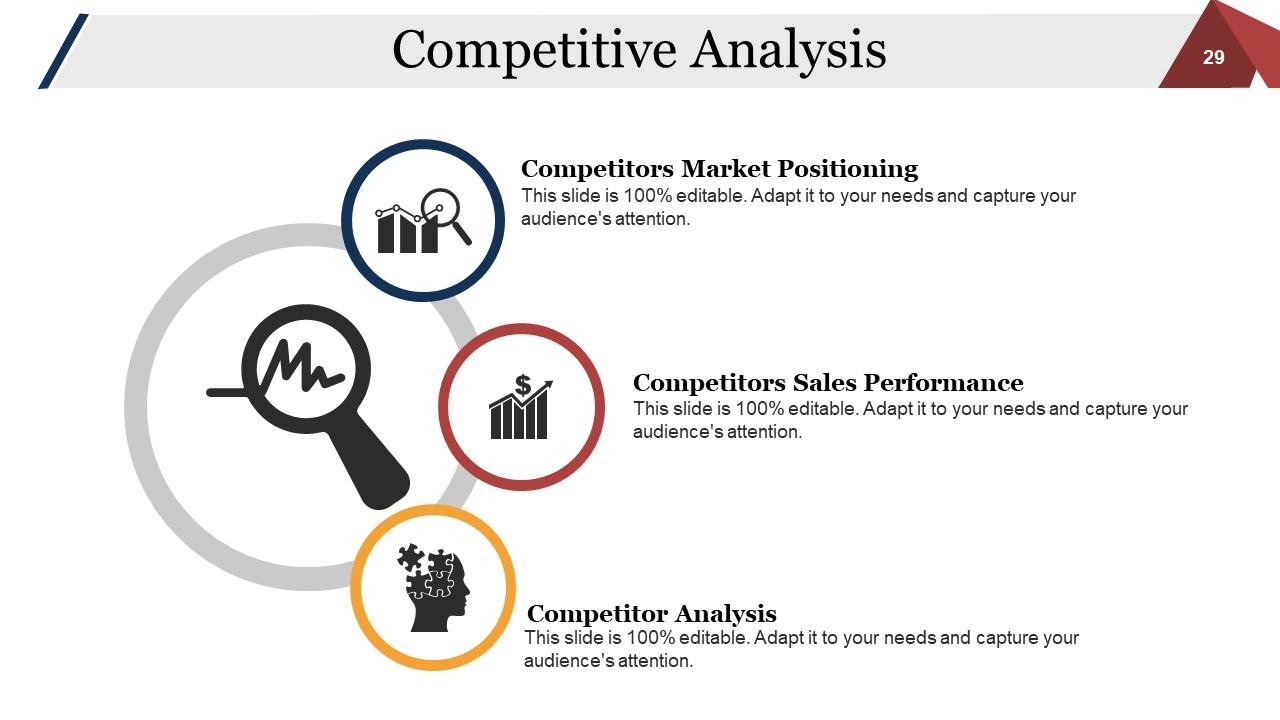
Slide 29: This slide presents Competitive Analysis showing- Competitors Market Positioning, Competitors Sales Performance, Competitor Analysis.
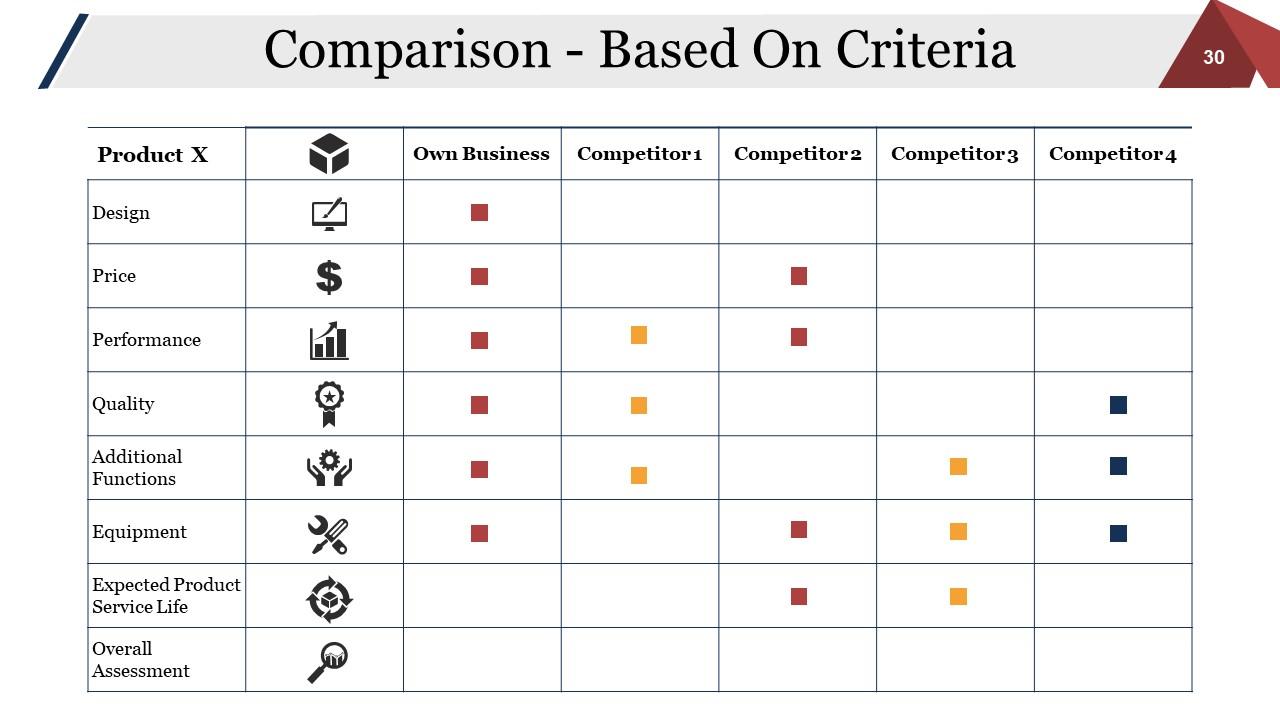
Slide 30: This is Comparison - Based On Criteria table slide. Use it for analysis, comparison etc.
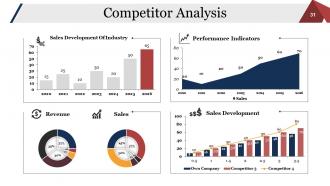
Slide 31: This is Competitor Analysis graph slide showing- Revenue, Sales, Performance Indicators, Sales Development, Sales Development Of Industry.
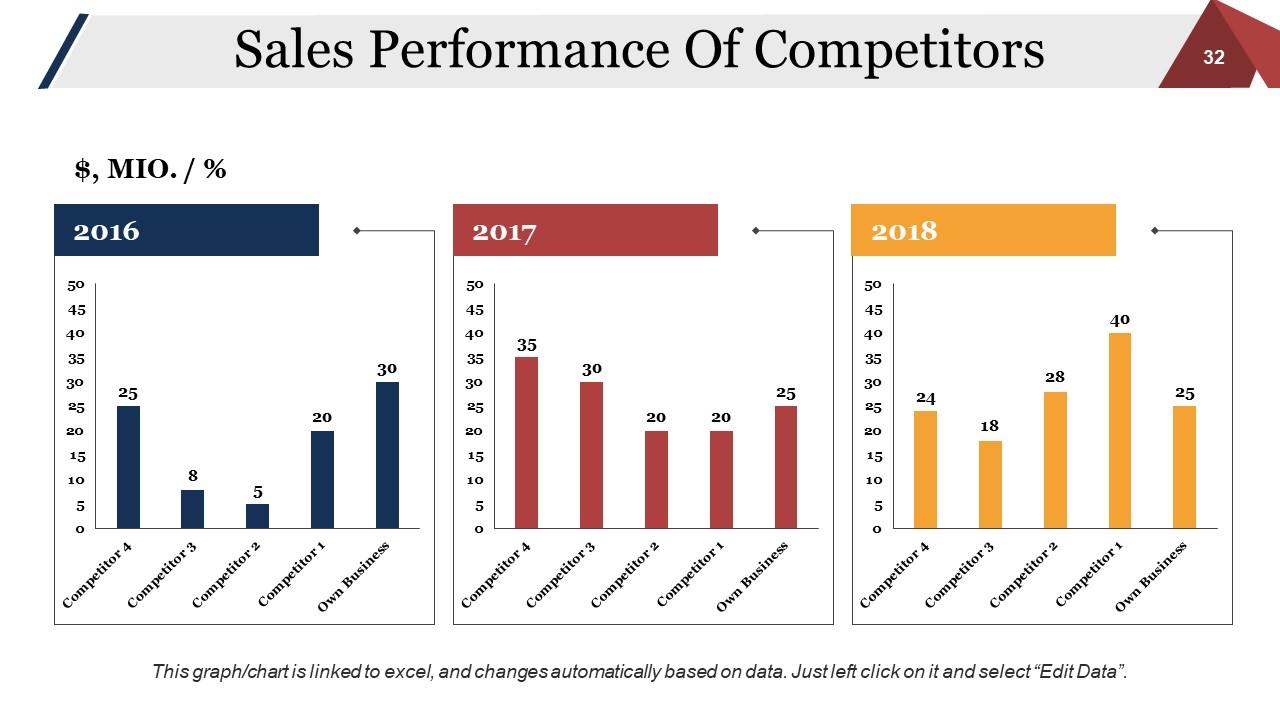
Slide 32: This slide showcases Sales Performance Of Competitors in a garphical form.
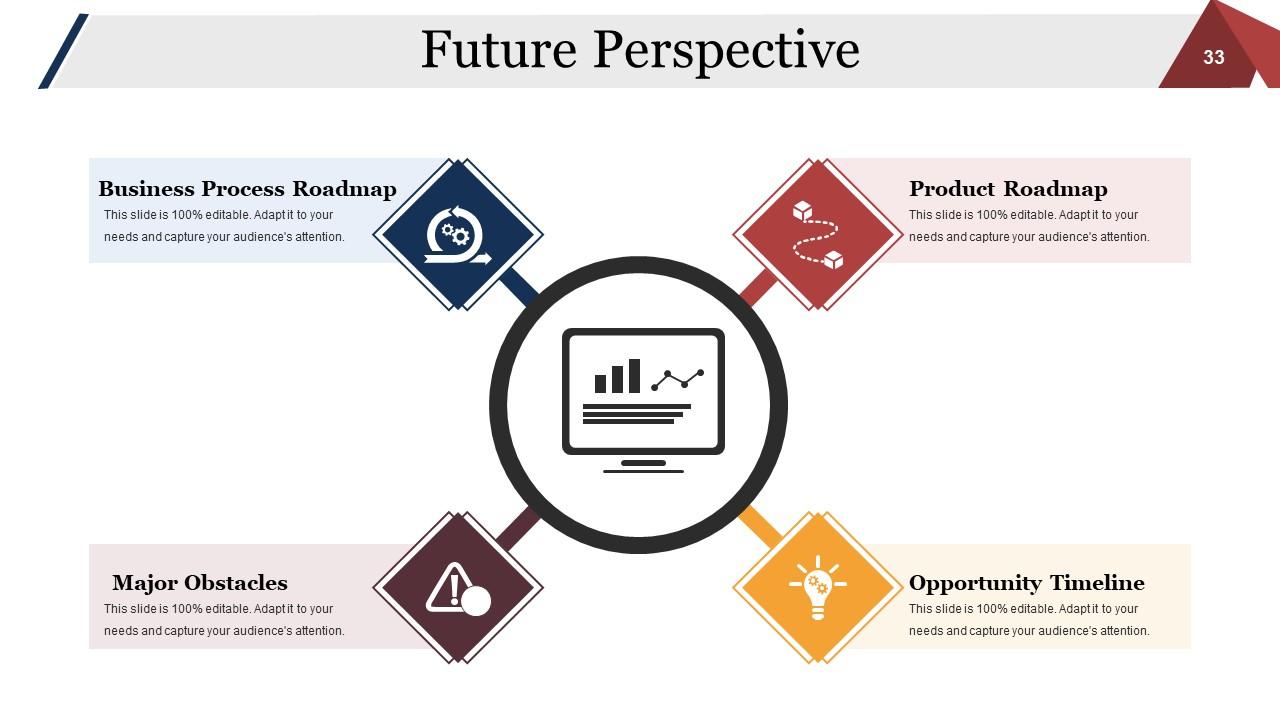
Slide 33: This is Future Perspective slide showing- Opportunity Timeline, Product Roadmap, Business Process Roadmap, Major Obstacles.
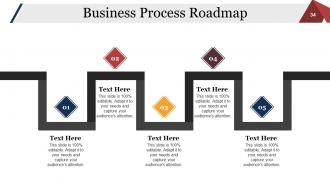
Slide 34: This slide showcases Business Process Roadmap to present business milestones, highlights etc.
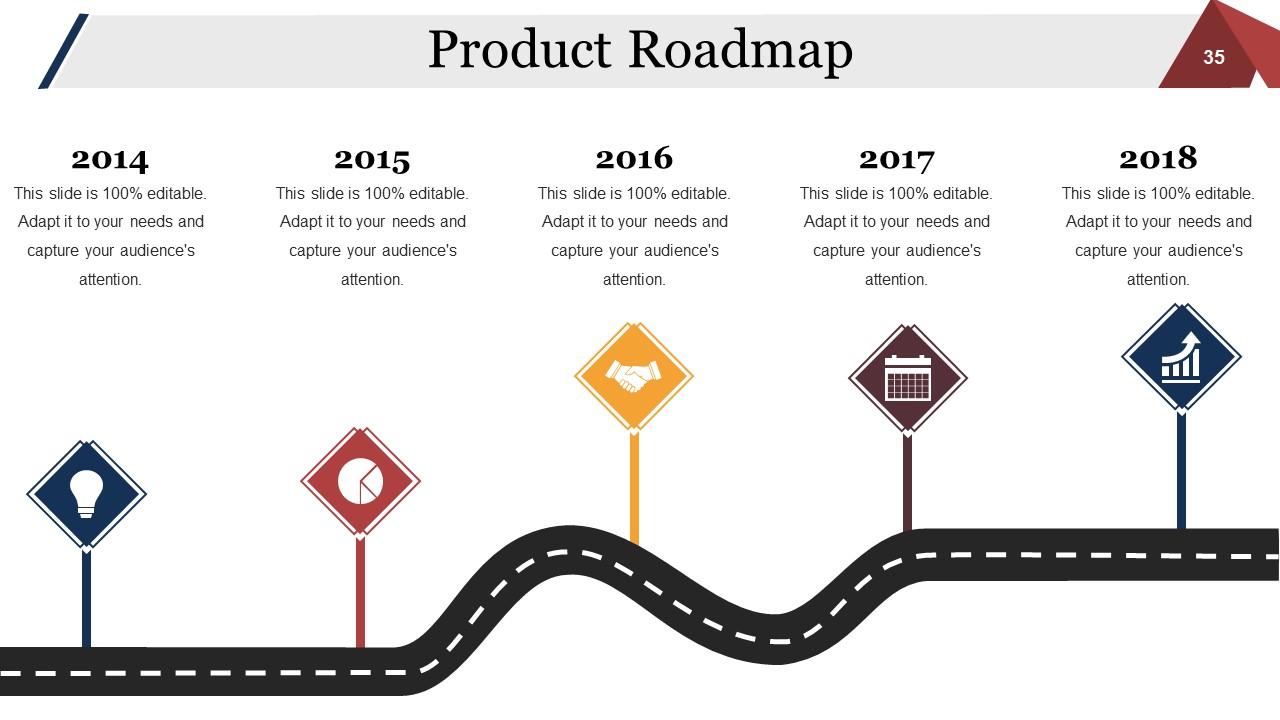
Slide 35: This slide showcases Product Roadmap to present milestones, highlights etc.
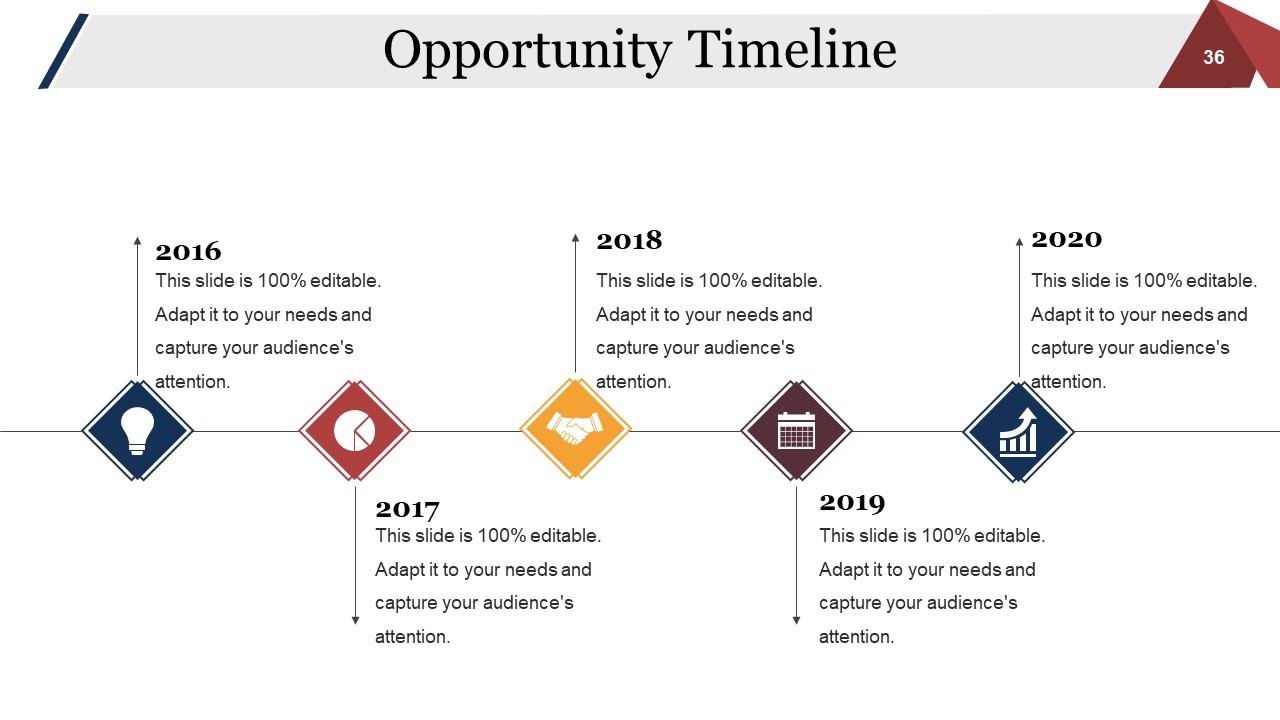
Slide 36: This slide showcases Opportunity Timeline to state milestones, growth factors, highlights etc.
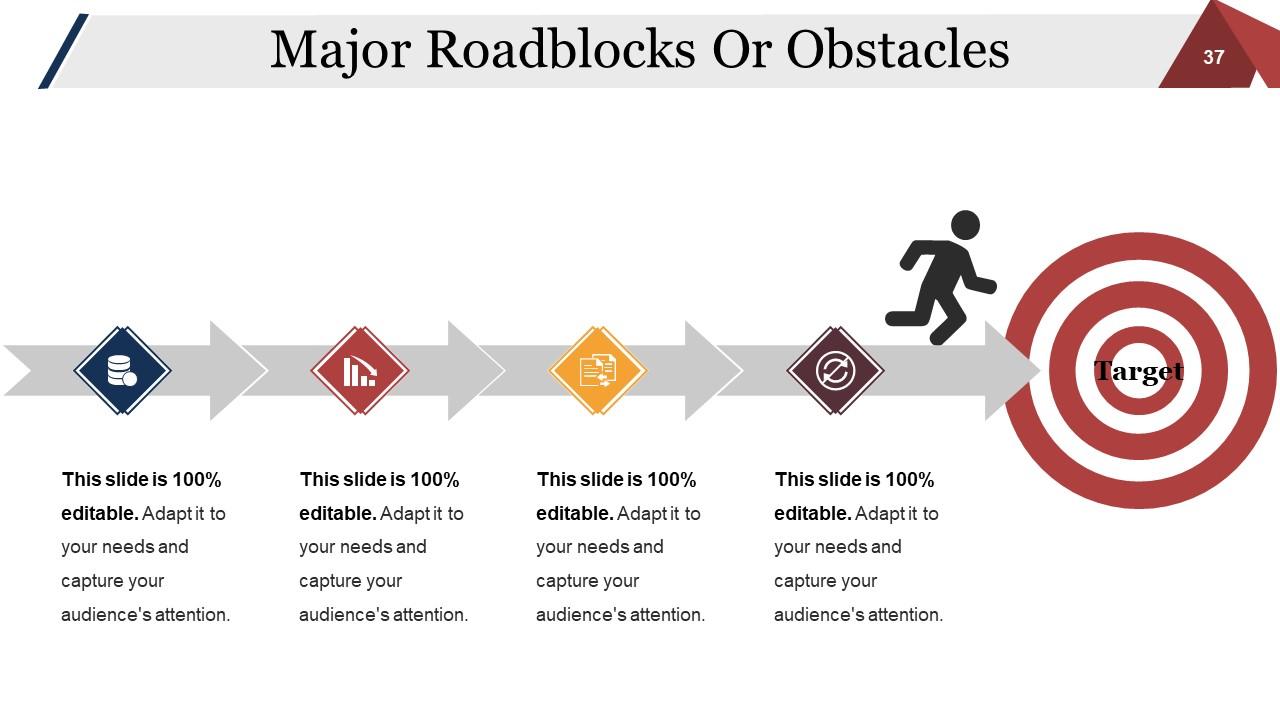
Slide 37: This is Major Roadblocks Or Obstacles slide. State them here.
Slide 38: This is a Coffee Break image slide. You can alter the contents as per need.
Slide 39: This is Sales Performance Review Icon Slide. Use/ add icons as per your requirement.
Slide 40: This is also Sales Performance Review Icon Slide. Use/ add icons as per your requirement.
Slide 41: This slide forwards to Charts & Graphs. You can alter the content as per need.
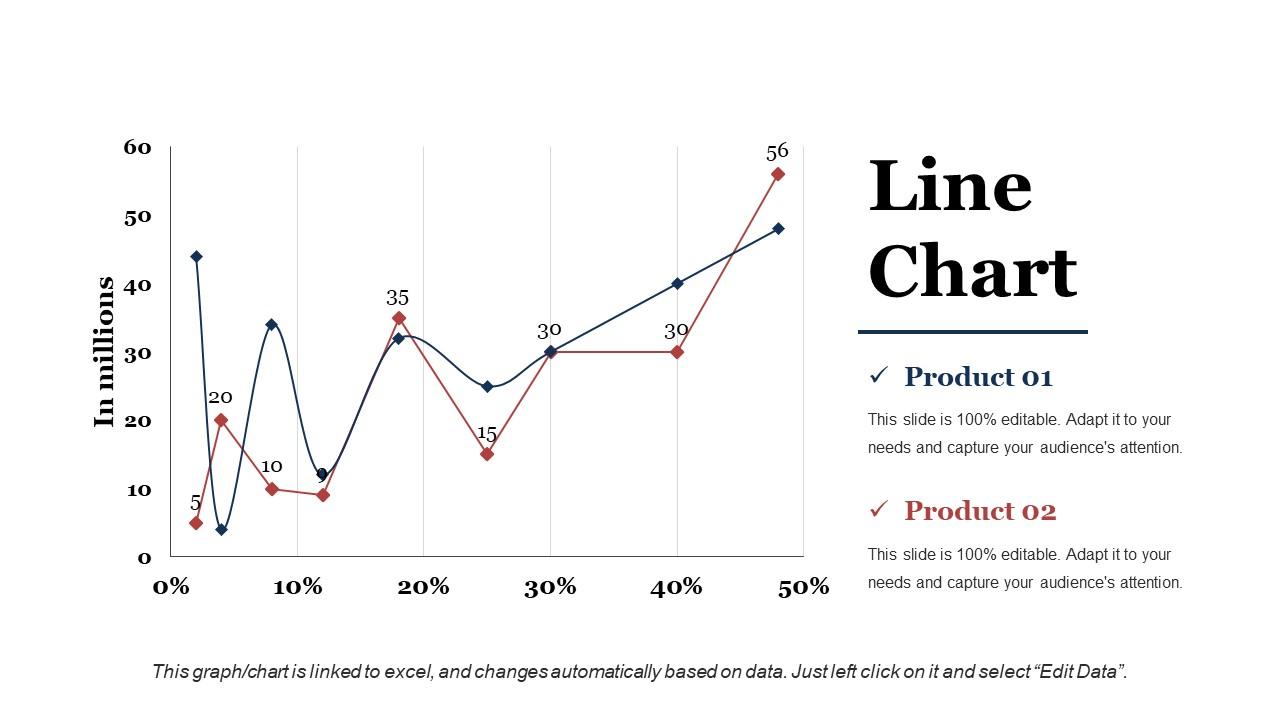
Slide 42: This slide presents a Line Chart for showcasing product/ company growth, comparison etc.
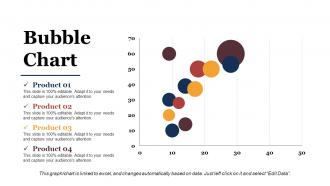
Slide 43: This slide presents a Bubble Chart for showcasing product/ company growth, comparison etc.
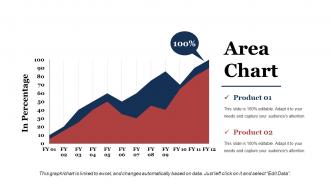
Slide 44: This is an Area Chart slide for product/ entity comparison.
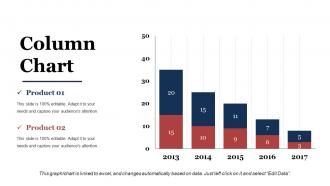
Slide 45: This is a Column Chart slide for product/ entity comparison.
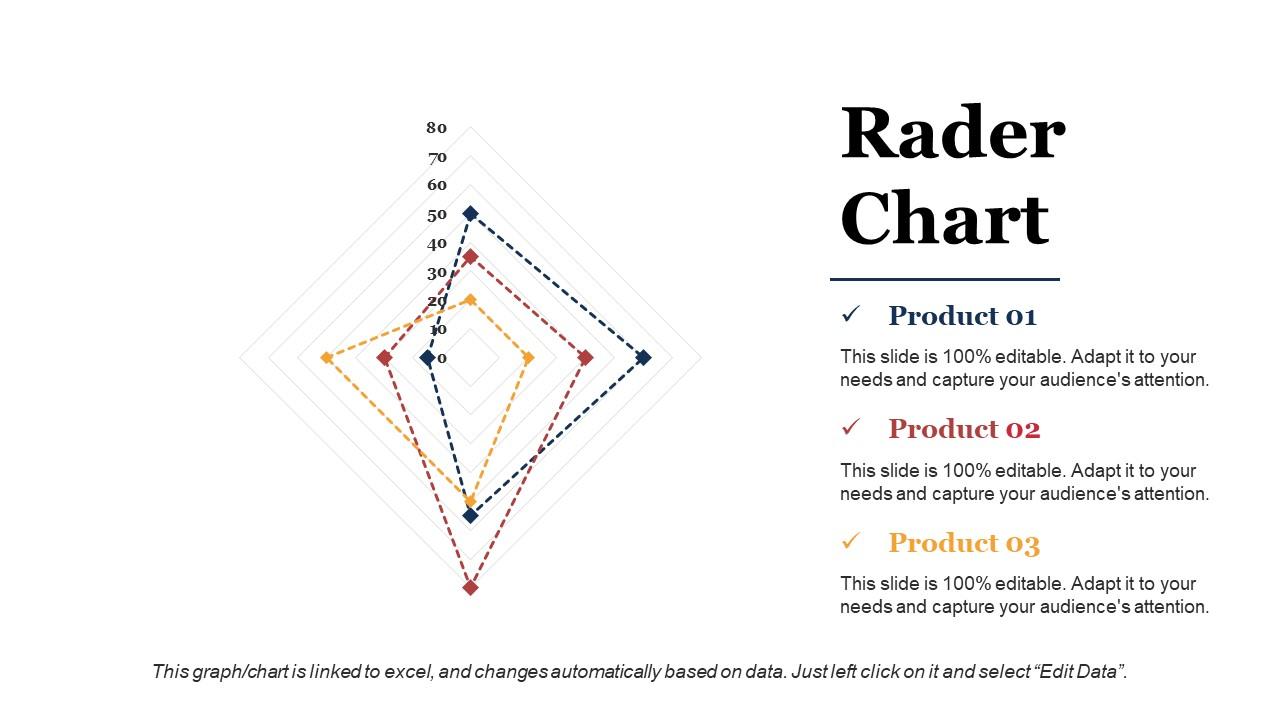
Slide 46: This is a Radar Chart slide for product/ entity comparison.
Slide 47: This slide is titled Additional Slides to move forward. You can alter the content as per need.
Slide 48: This is Our Mission slide. State company mission here.
Slide 49: This is an About Us slide. State team/ company specifications here.
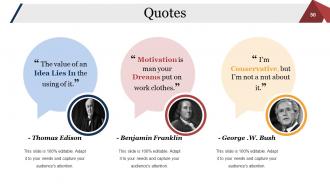
Slide 50: This is a Quotes slide to convey company messages, beliefs etc. You can change the slide contents as per need.
Slide 51: This is Our Goal slide. State your goals here.
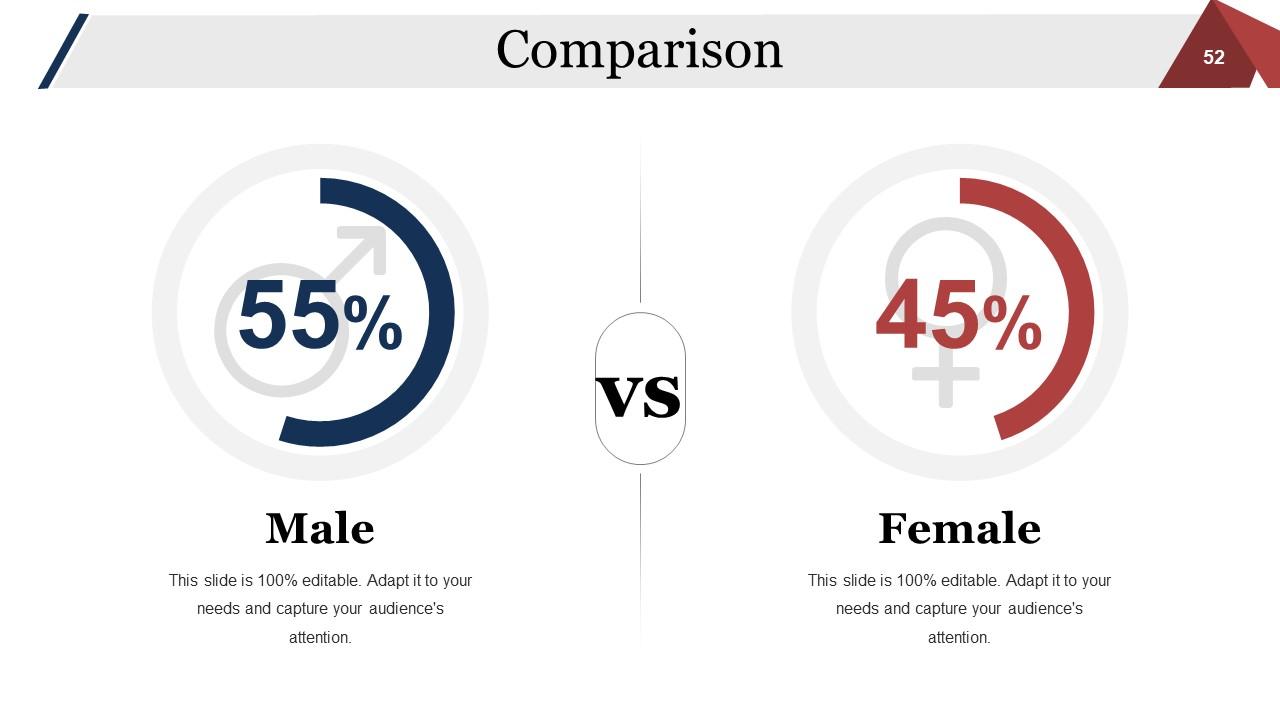
Slide 52: This is a Comparison slide. You can compare the male and female ratio in it.
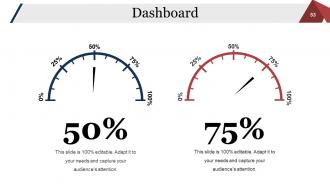
Slide 53: This is Dashboard slide to show information in percentages etc.
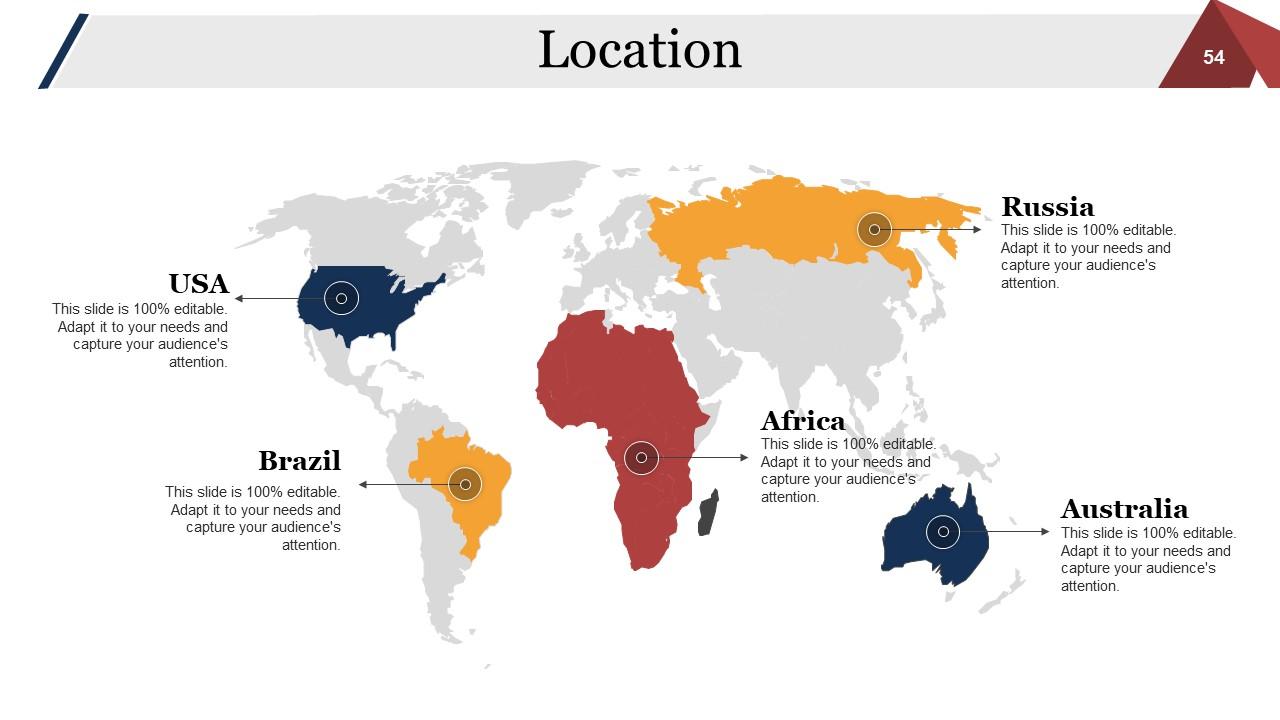
Slide 54: This is a Location slide to show global growth, presence etc. on a world map image.
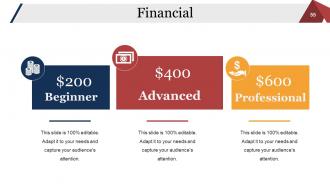
Slide 55: This is a Financial Score slide to showcase financial aspects.
Slide 56: This is a Puzzle pieces image slide to show information, specifications etc.
Slide 57: This is a Target image slide. State targets, etc. here.
Slide 58: This is a Circular image slide. State specifications, information here.
Slide 59: This is a LEGO slide with text boxes to show information.
Slide 60: This slide presents a Mind map imagery with text boxes.
Slide 61: This is Silhouettes slide to show people related information, specifications etc.
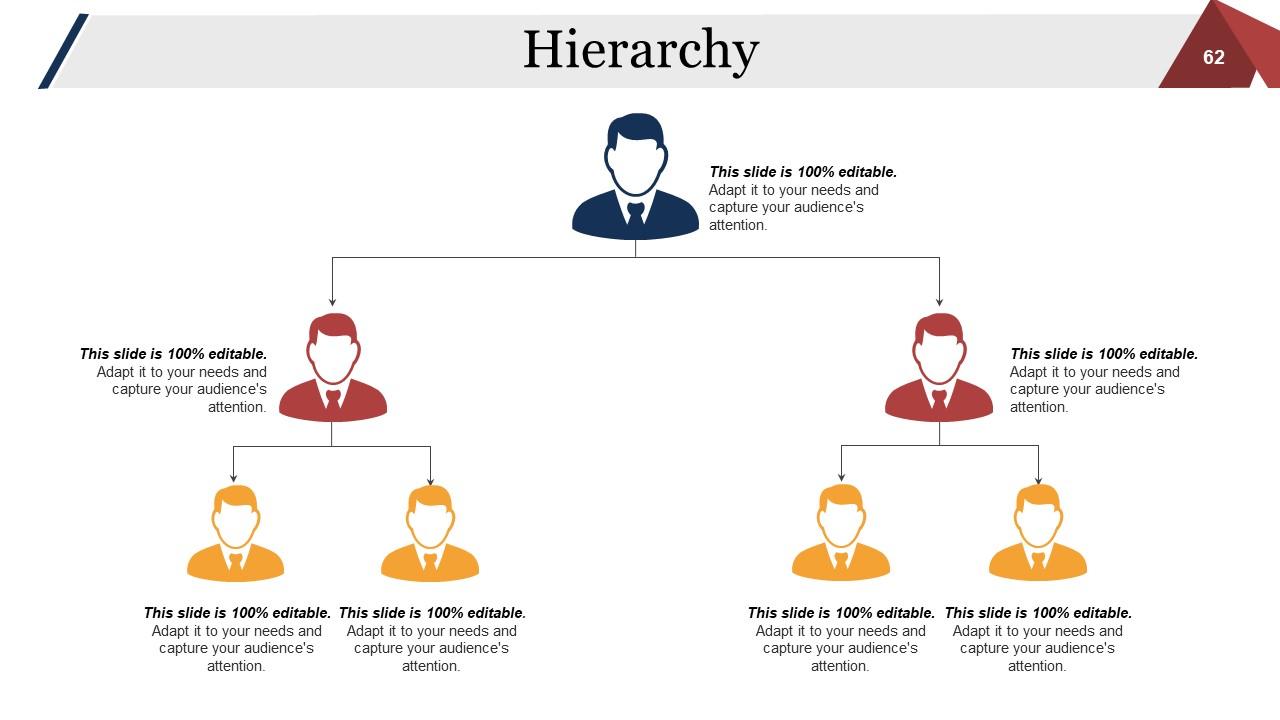
Slide 62: This is a Hierarchy slide to show information, organization structural specifications etc.
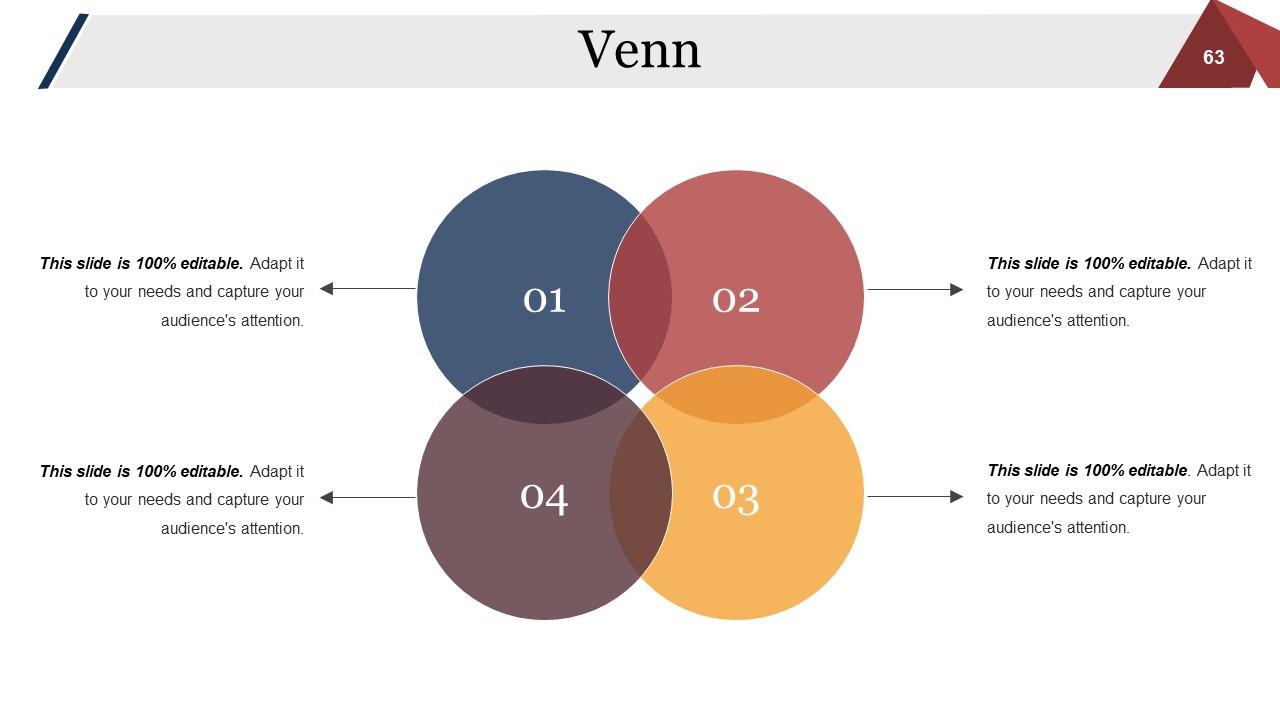
Slide 63: This is a Venn diagram image slide to show information, specifications etc.
Slide 64: This is a Magnifying glass image slide to show information, scoping aspects etc.
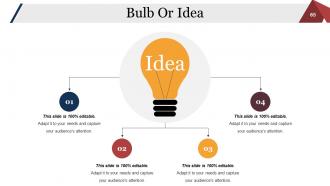
Slide 65: This is a Bulb Or Idea image slide to show information, innovative aspects etc.
Slide 66: This is a Thank You image slide with Address, Email and Contact number.
Sales Performance Review Powerpoint Presentation Slides with all 66 slides:
Instruct the group with our Sales Performance Review Powerpoint Presentation Slides. Give every individual a clear idea of their function.
-
Awesome use of colors and designs in product templates.
-
Best way of representation of the topic.


