Steps In Project Appraisal Process Powerpoint Presentation Slides
Do the job with our Steps In Project Appraisal Process Powerpoint Presentation Slides. Ensure completion from every angle.
- Google Slides is a new FREE Presentation software from Google.
- All our content is 100% compatible with Google Slides.
- Just download our designs, and upload them to Google Slides and they will work automatically.
- Amaze your audience with SlideTeam and Google Slides.
-
Want Changes to This PPT Slide? Check out our Presentation Design Services
- WideScreen Aspect ratio is becoming a very popular format. When you download this product, the downloaded ZIP will contain this product in both standard and widescreen format.
-

- Some older products that we have may only be in standard format, but they can easily be converted to widescreen.
- To do this, please open the SlideTeam product in Powerpoint, and go to
- Design ( On the top bar) -> Page Setup -> and select "On-screen Show (16:9)” in the drop down for "Slides Sized for".
- The slide or theme will change to widescreen, and all graphics will adjust automatically. You can similarly convert our content to any other desired screen aspect ratio.
Compatible With Google Slides

Get This In WideScreen
You must be logged in to download this presentation.
PowerPoint presentation slides
Presenting this set of slides with name - Steps In Project Appraisal Process Powerpoint Presentation Slides. The stages in this process are Steps In Project Appraisal Process, Project Assessment, Project Evaluation.
People who downloaded this PowerPoint presentation also viewed the following :
Content of this Powerpoint Presentation
Slide 1: This slide introduces Steps In Project Appraisal Process. State Your Company Name and begin.
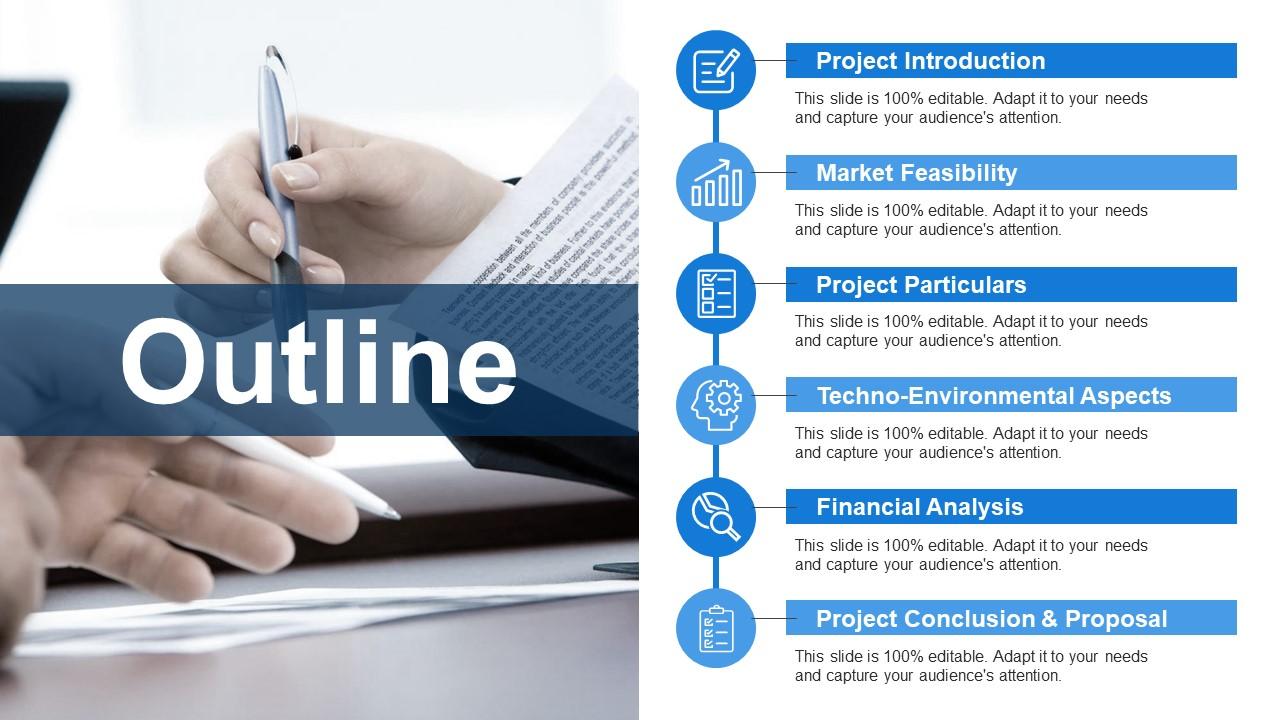
Slide 2: This slide showcases Outline representing- Project Introduction, Market Feasibility, Project Particulars, Techno-Environmental Aspects, Financial Analysis, Project Conclusion & Proposal.
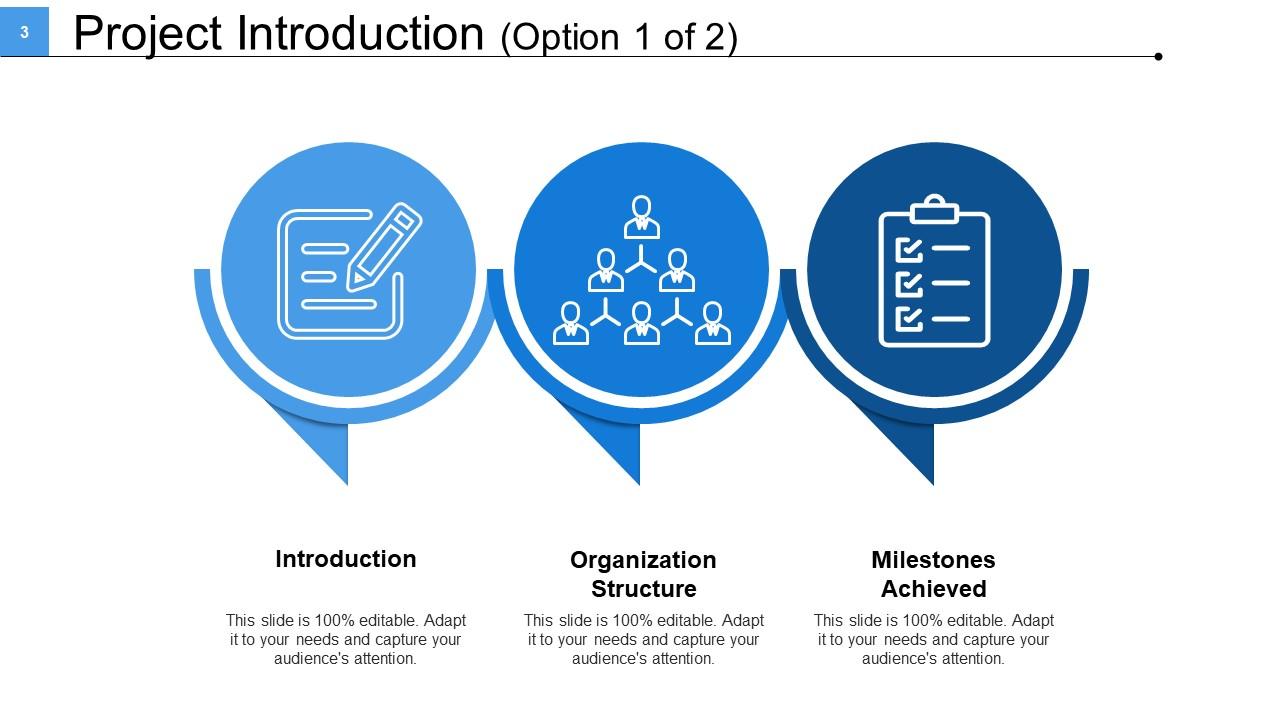
Slide 3: This slide showcases Project Introduction displaying-(Option 1 of 2) Introduction, Milestones Achieved, Organization Structure.
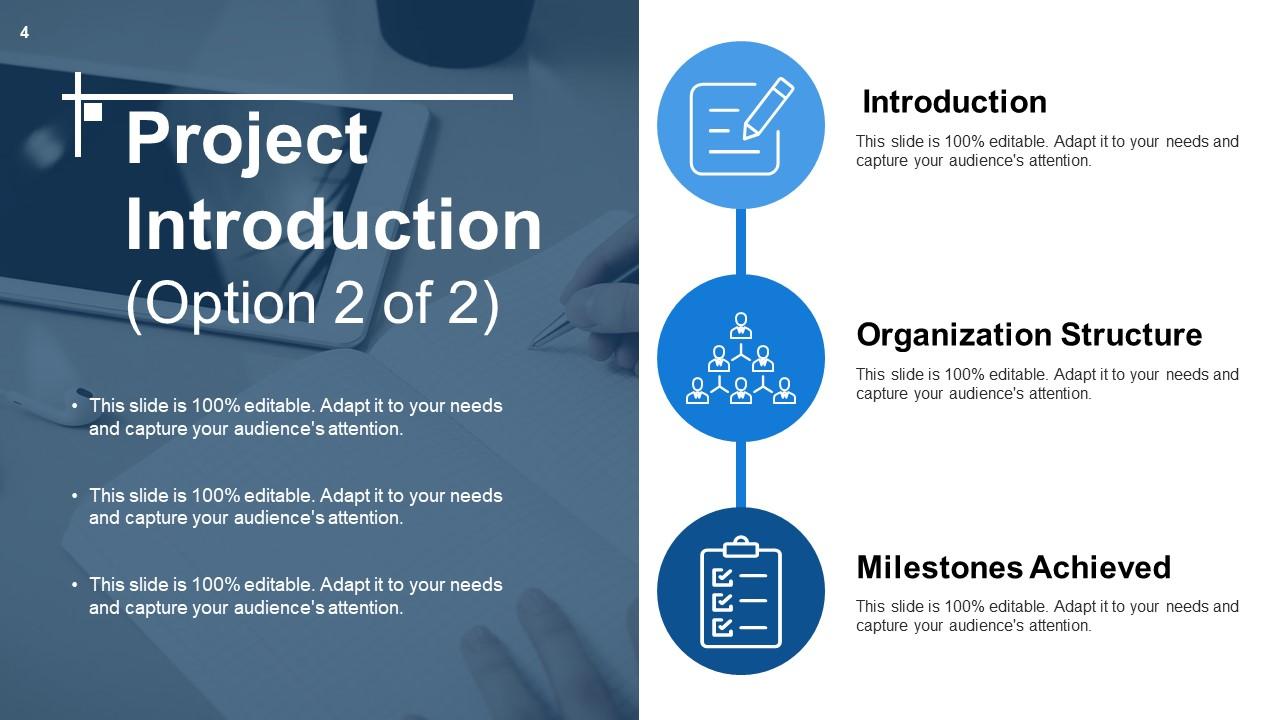
Slide 4: This slide presents Project Introduction displaying- Introduction, Organization Structure, Milestones Achieved.
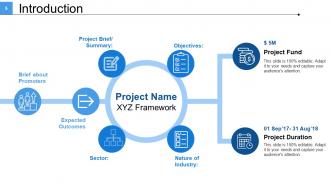
Slide 5: This slide shows Introduction with- Project Brief/ Summary, Sector, Nature of Industry, Objectives, Brief about Promoters, Expected Outcomes, Project Fund, Project Name.
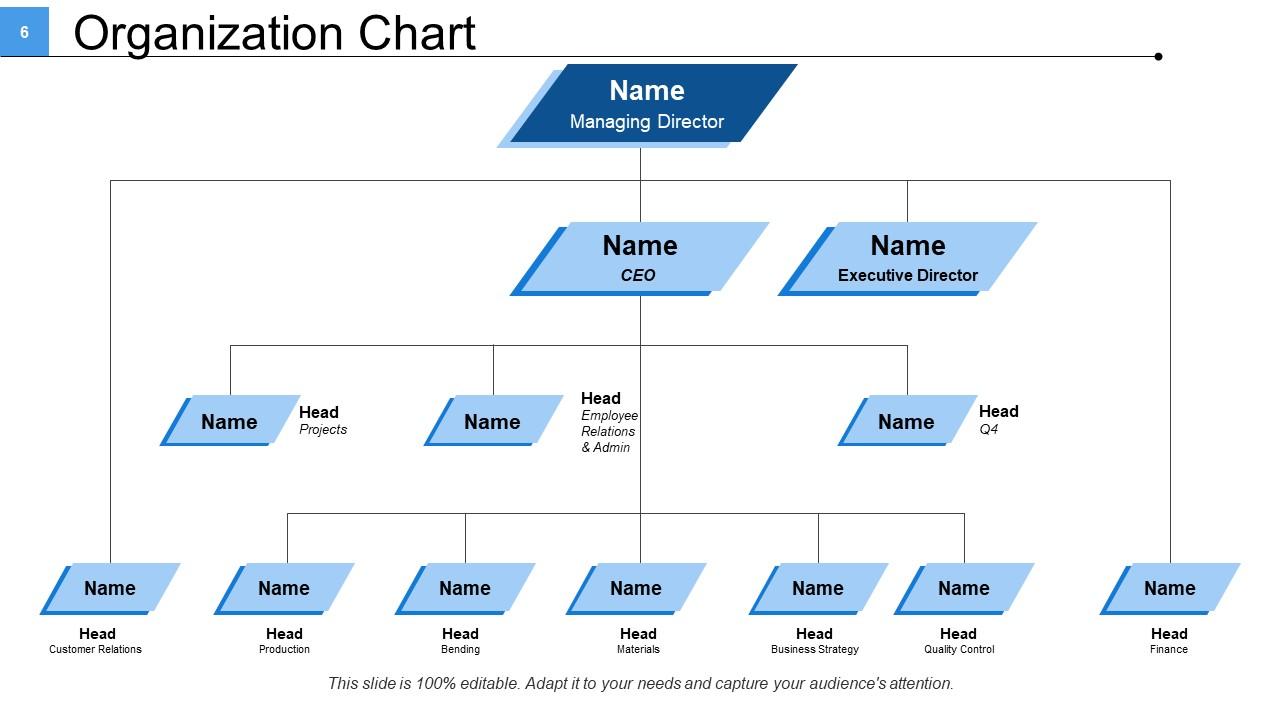
Slide 6: This slide presents an Organization Chart to display organization/team structure etc.
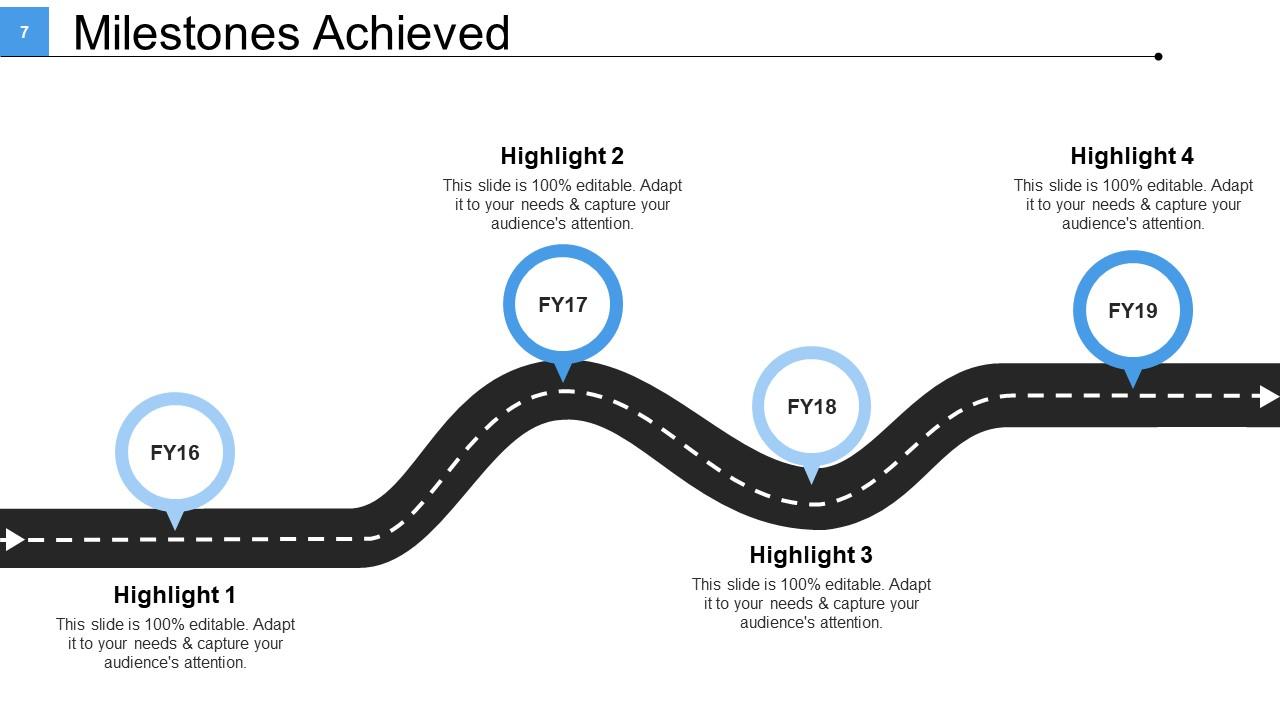
Slide 7: This slide displays Milestones Achieved by the Project.
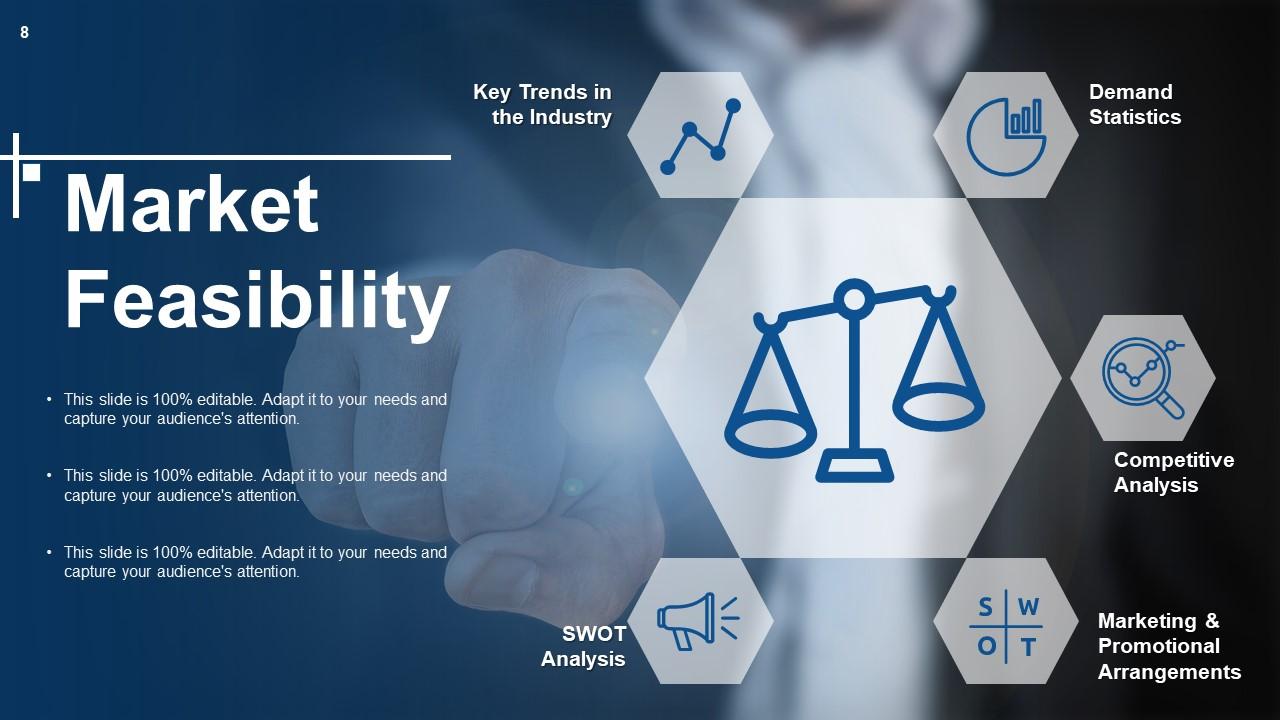
Slide 8: This slide showcases Market Feasibility displaying- Key Trends in the Industry, Demand Statistics, Competitive Analysis, SWOT Analysis, Marketing & Promotional Arrangements.
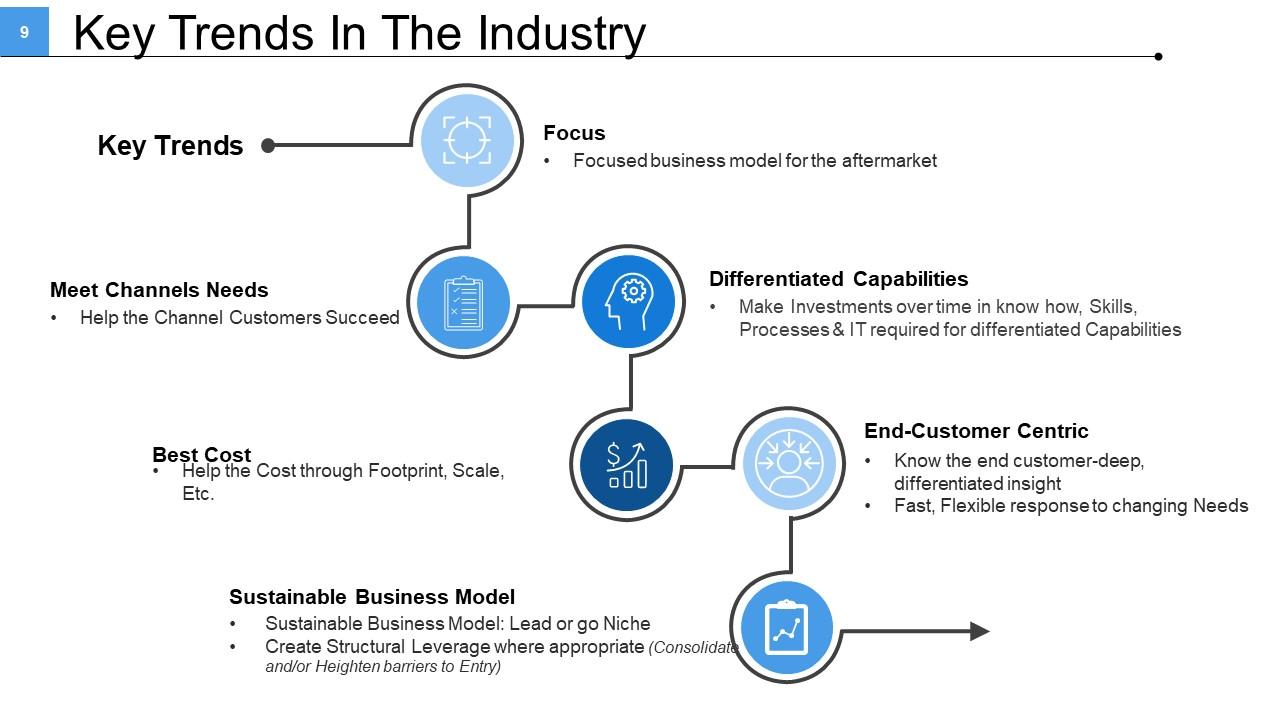
Slide 9: This slide showcases Key Trends In The Industry displaying- Focus, Meet Channels Needs, Best Cost, Sustainable Business Model: Lead or go Niche, Sustainable Business Model, Key Trends.
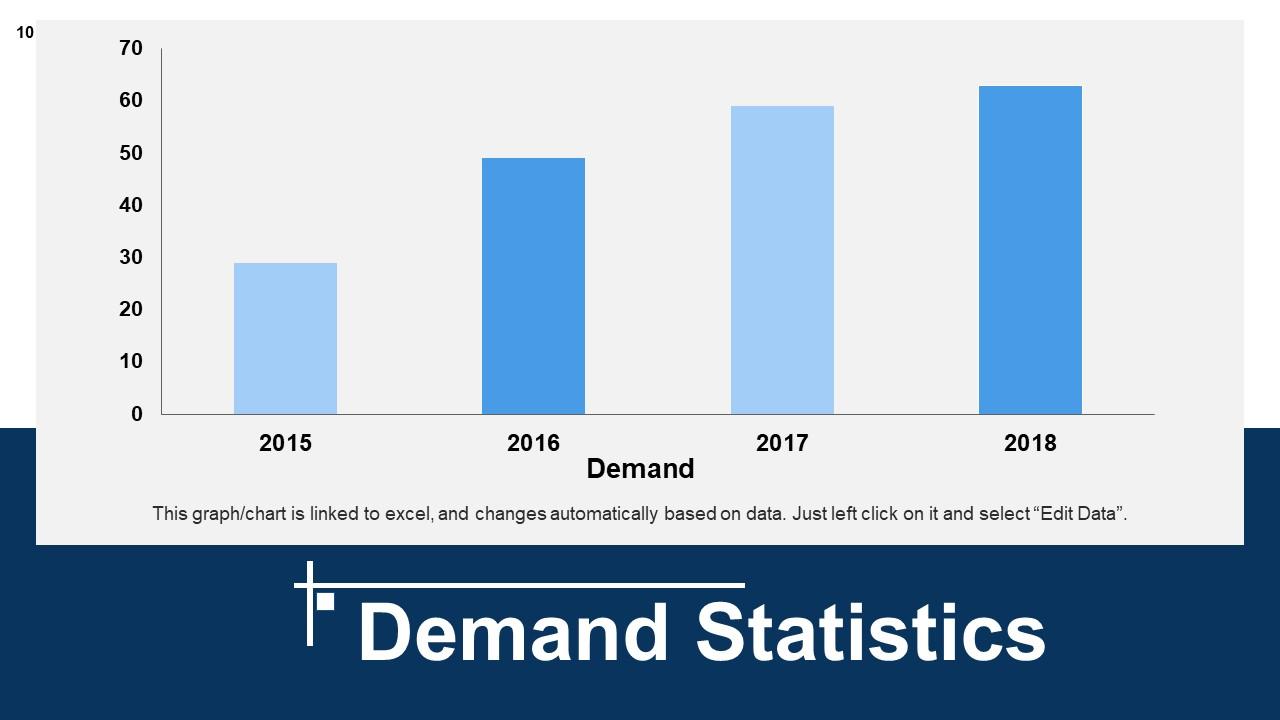
Slide 10: This is a Demand Statistics bar graph.
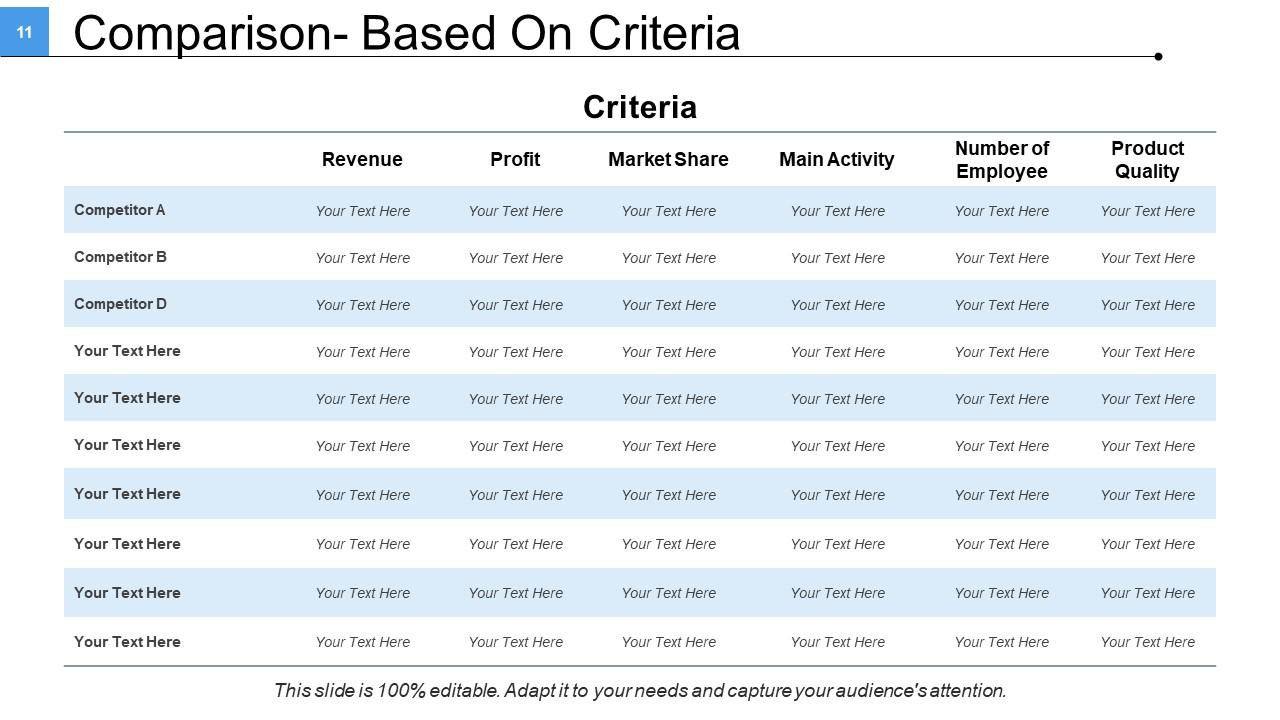
Slide 11: This is a Comparison- Based On Criteria slide in tabular form.
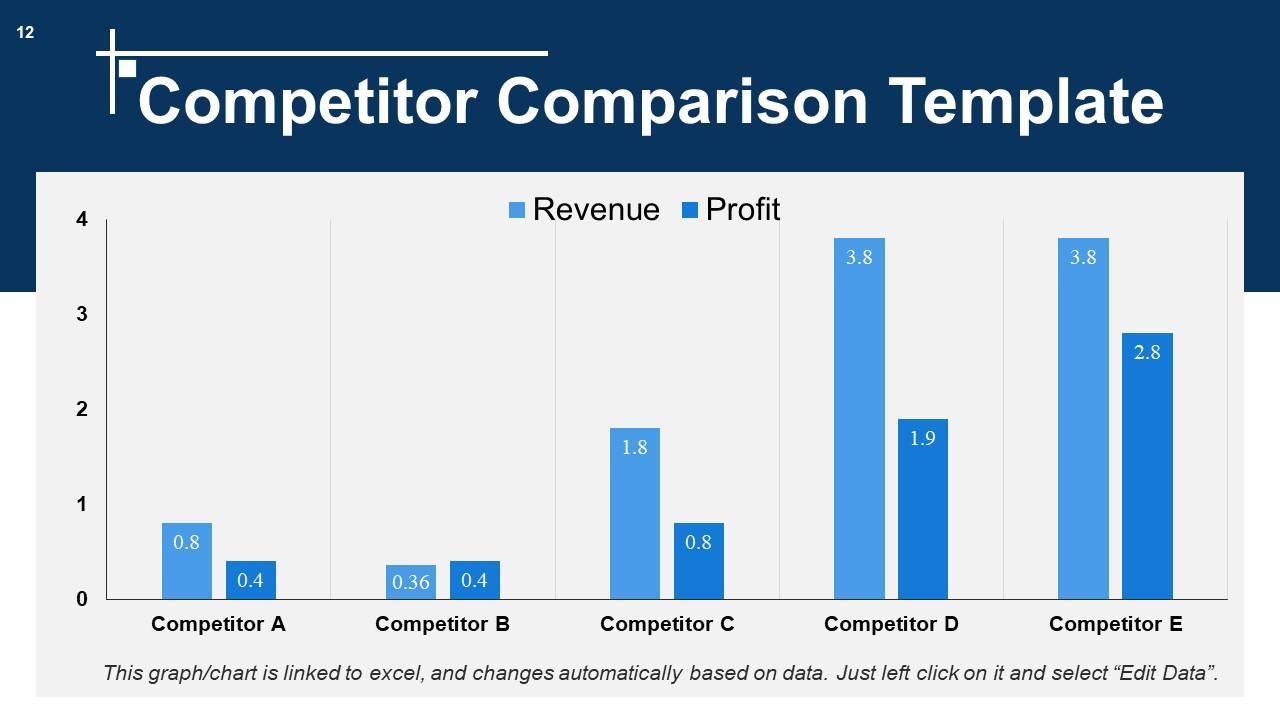
Slide 12: This is a Competitor Comparison Template in graph form.
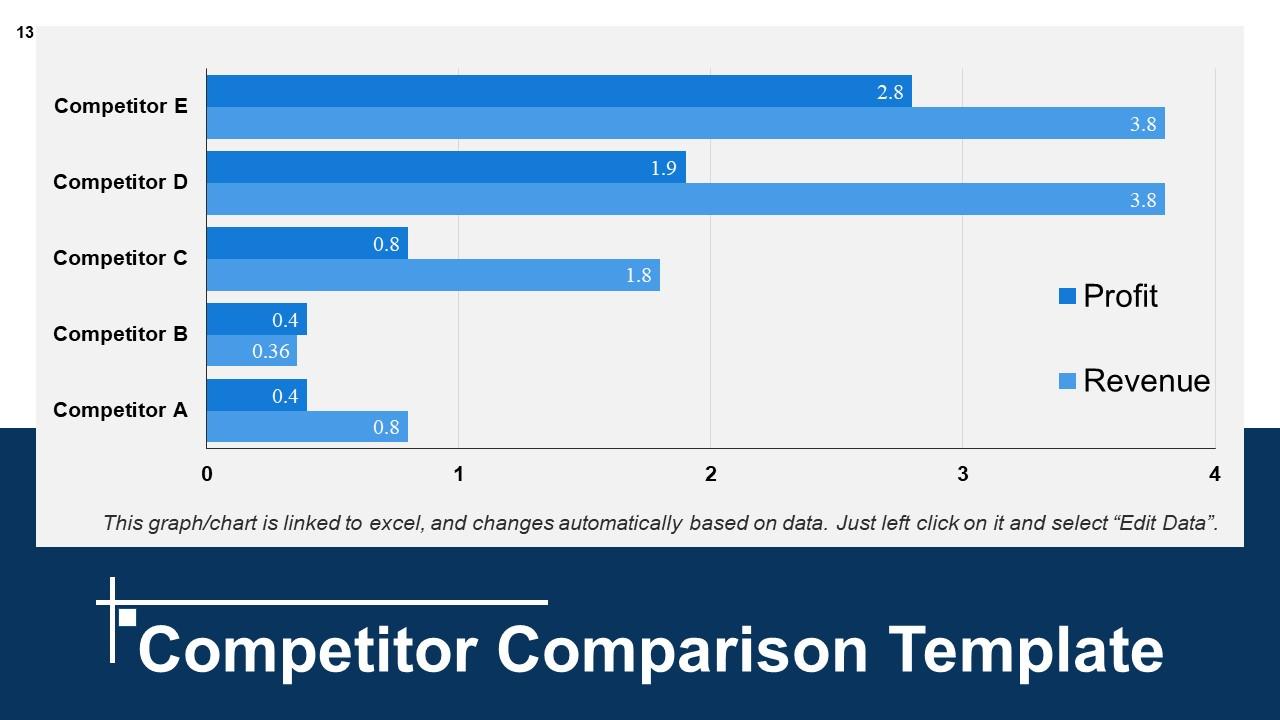
Slide 13: This slide showcases Competitor Comparison Template in graph form.
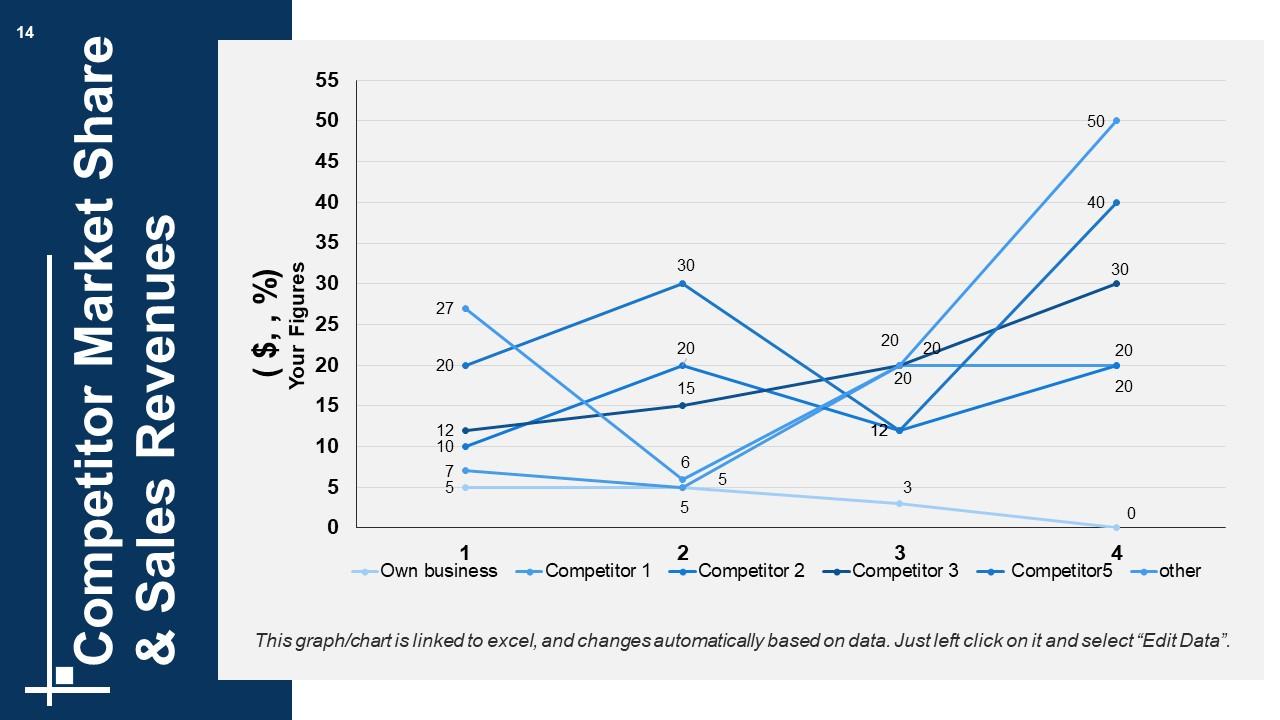
Slide 14: This is Competitor Market Share & Sales Revenues graph slide.
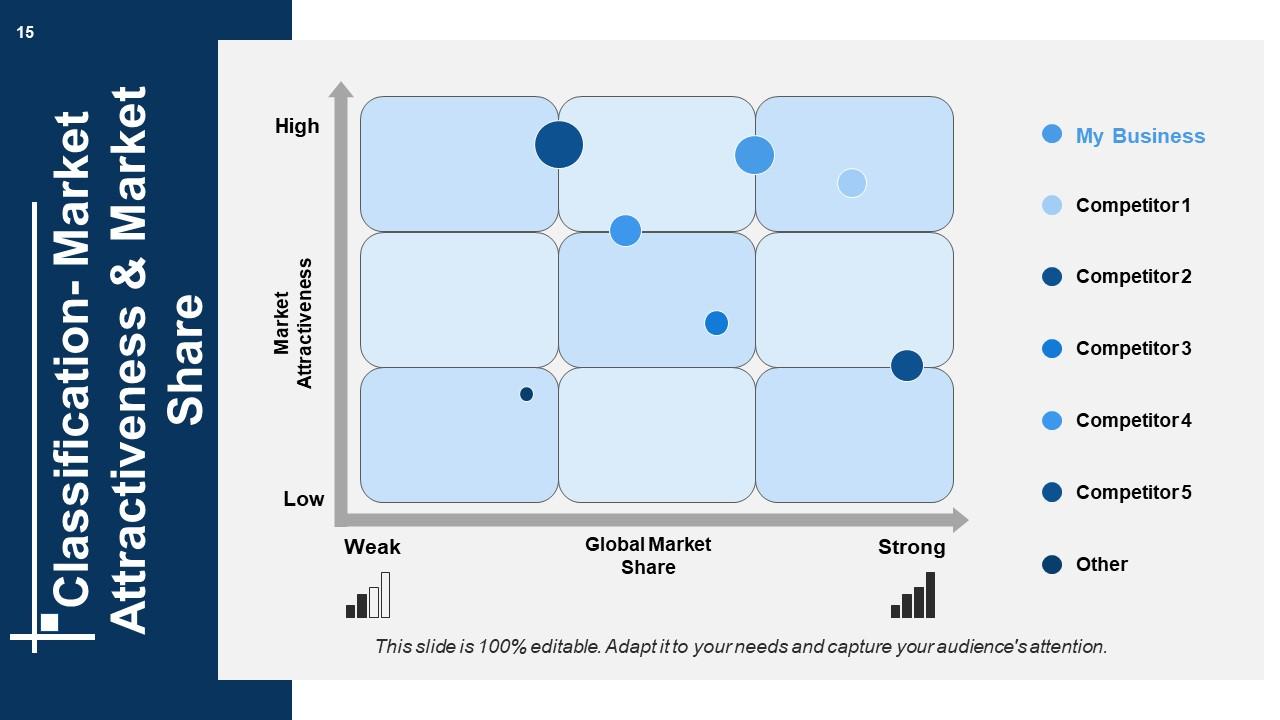
Slide 15: This is Classification- Market Attractiveness & Market Share matrix slide displaying- Market Attractiveness, Global Market Share, My Business, Competitor, Other.
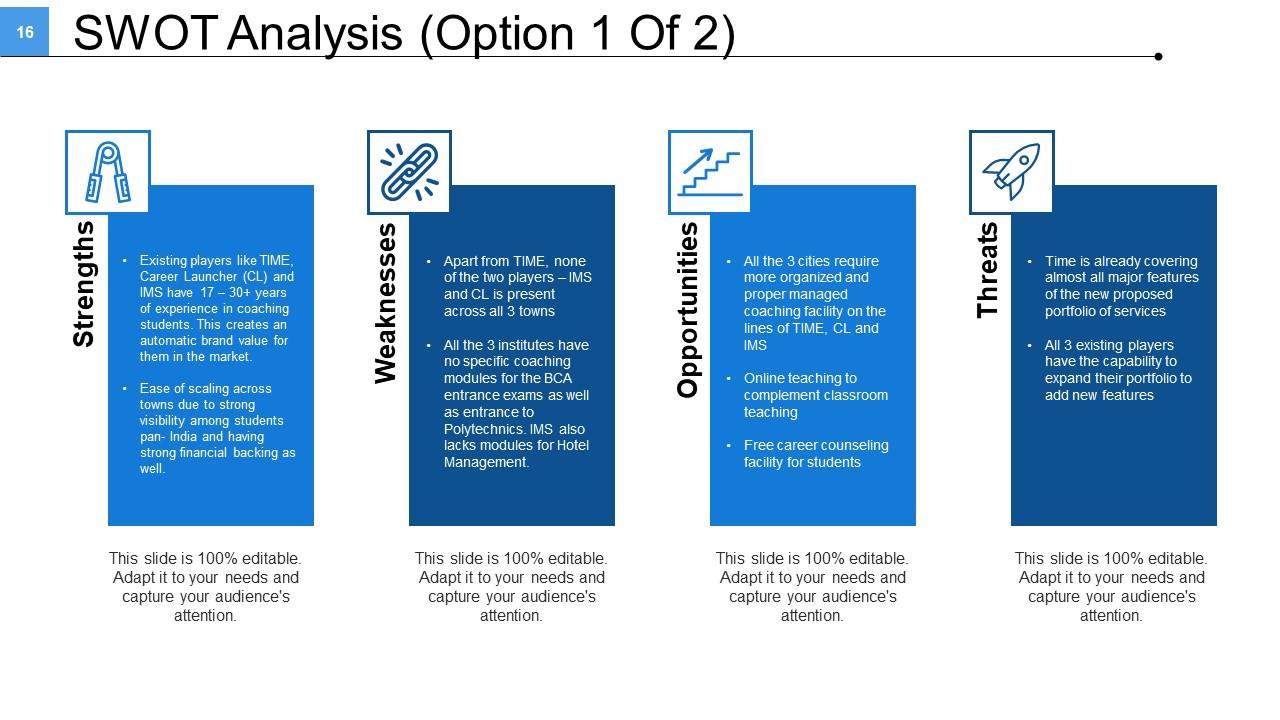
Slide 16: This is a SWOT Analysis table slide.
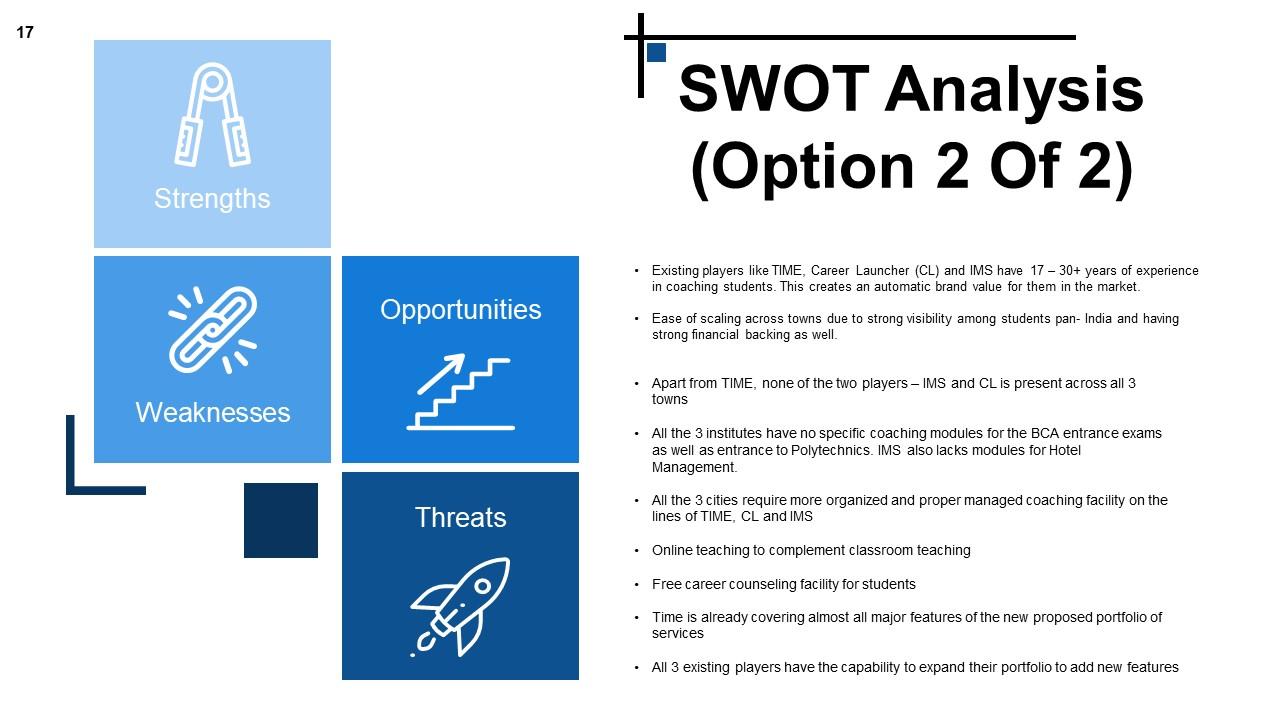
Slide 17: This is a SWOT Analysis as tabular box slide.
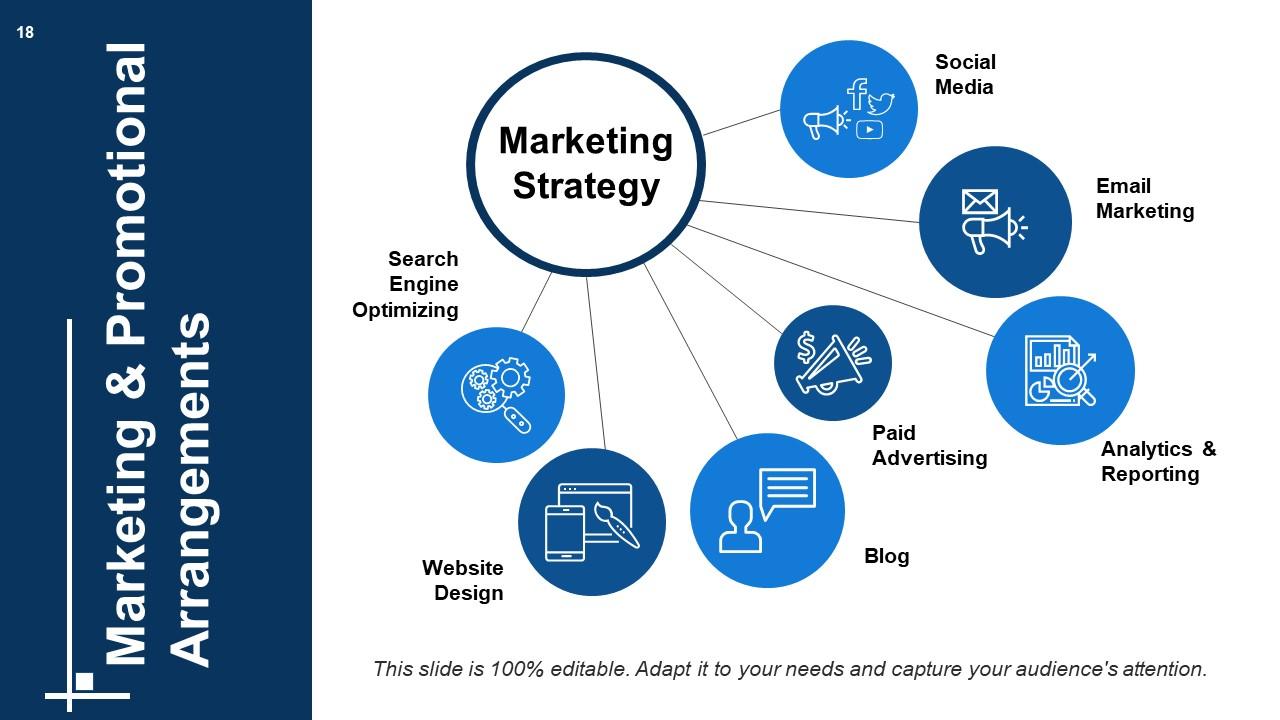
Slide 18: This slide displays Marketing Strategy as Marketing & Promotional Arrangements showcasing- Social Media, Email Marketing, Analytics & Reporting, Paid Advertising, Blog, Website Design, Search Engine Optimizing.
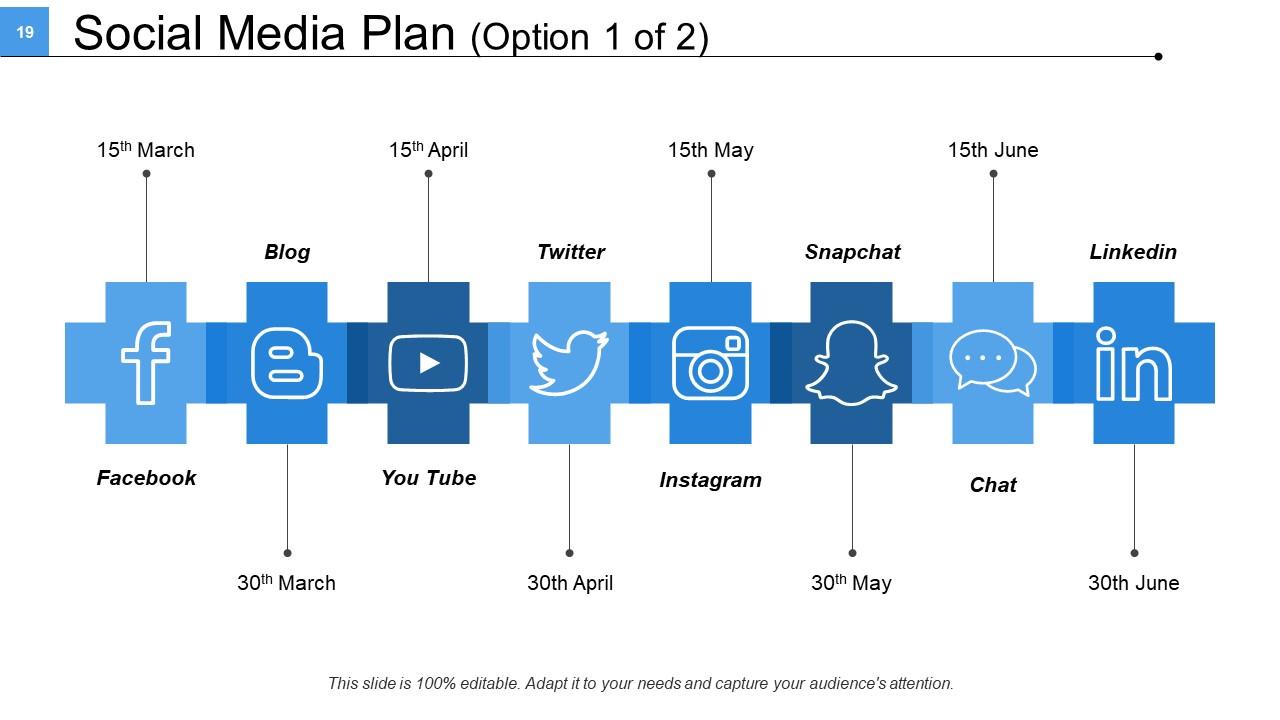
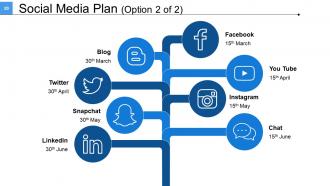
Slide 19: This slide presents a Social Media Plan for different platforms.
Slide 20: This slide also presents a Social Media Plan for different platforms.
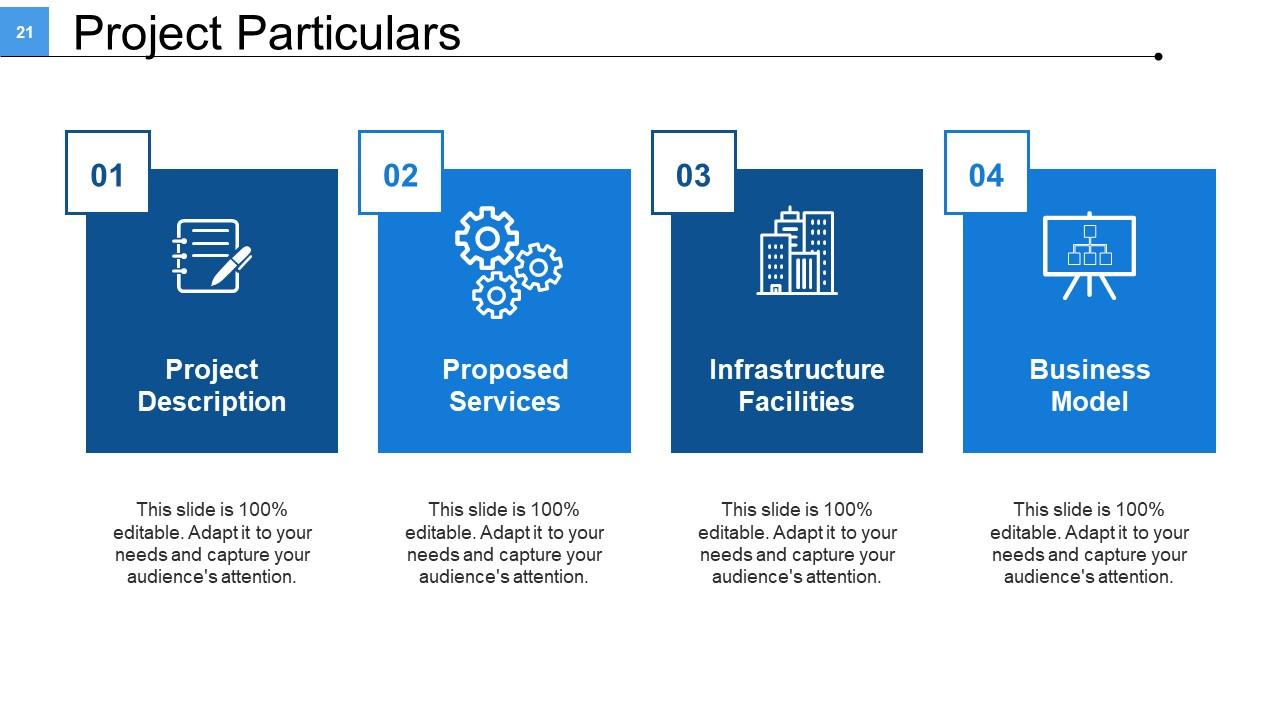
Slide 21: This slide shows Project Particulars with- Project Description, Proposed Services, Infrastructure Facilities.
Slide 22: This is a Project Description slide to elaboarte the project in detail.
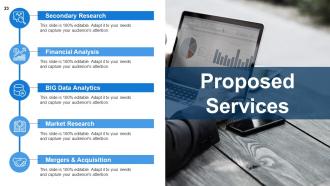
Slide 23: This slide presents Proposed Services with- Secondary Research, Financial Analysis, BIG Data Analytics, Market Research.
Slide 24: This slide showcases Infrastructure Facilities to be presented.
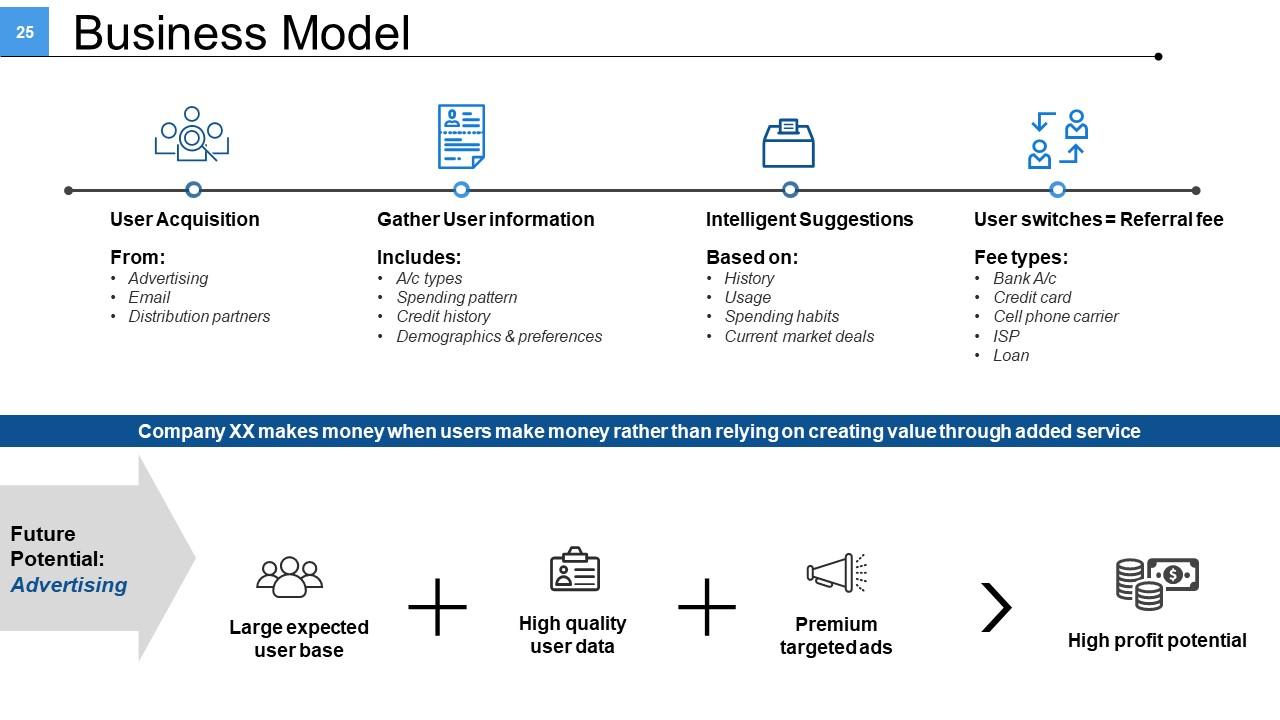
Slide 25: This is a Business Model slide showcasing- Gather User information, User Acquisition, Intelligent Suggestions, User switches = Referral fee, Large expected user base, High quality user data, Premium targeted ads, High profit potential.
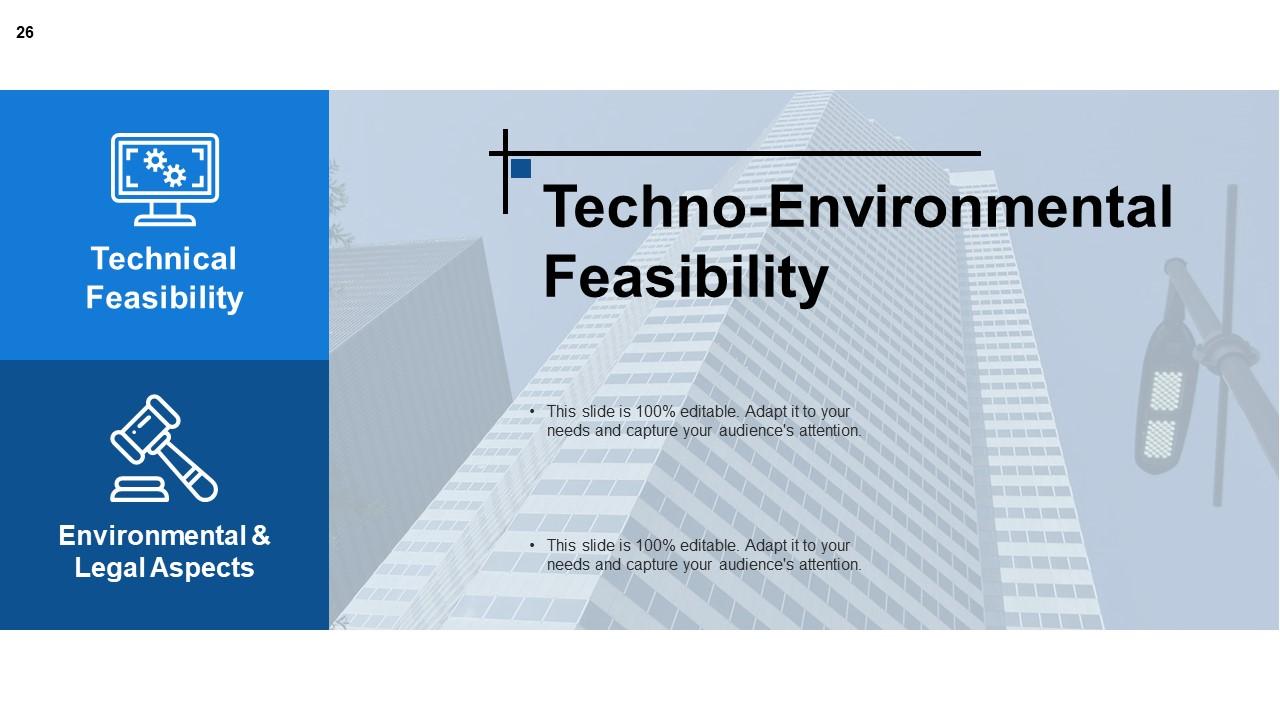
Slide 26: This slide showcases Techno-Environmental Feasibility with- Technical Feasibility, Environmental & Legal Aspects.
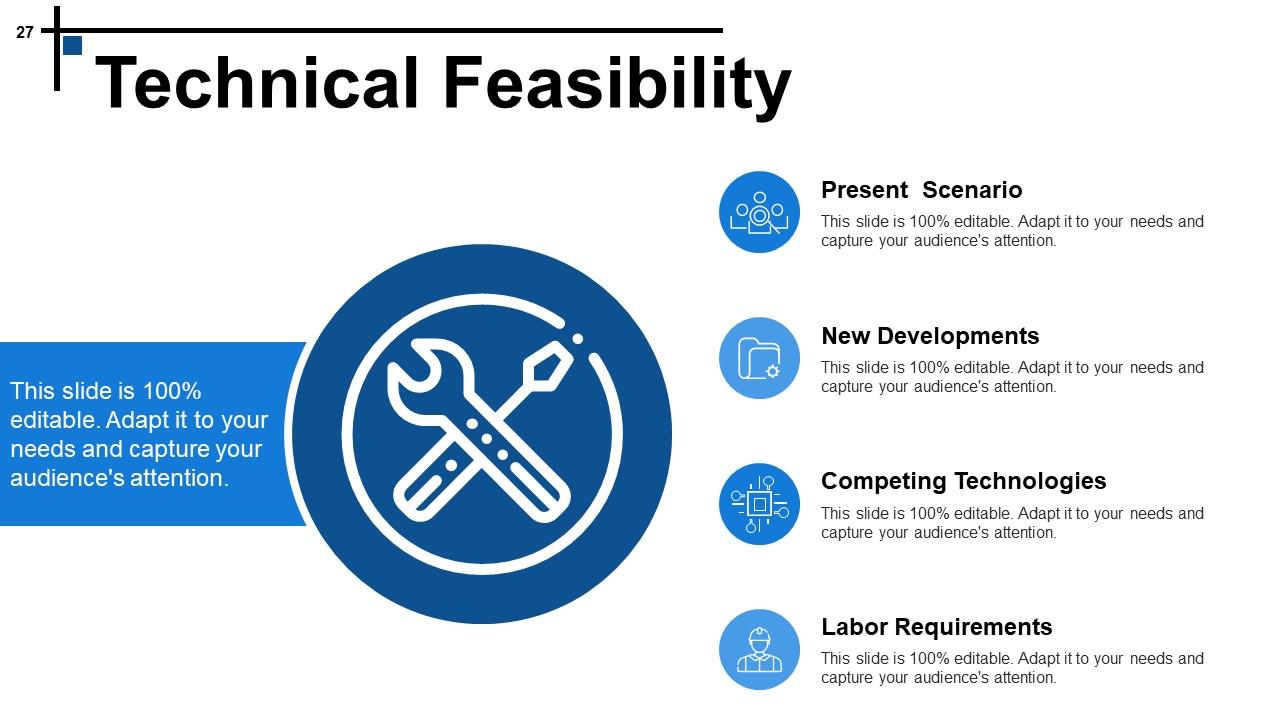
Slide 27: This slide showcases Technical Feasibility with- Competing Technologies, Present Scenario, New Developments, and Labor Requirements as factors to be discussed.
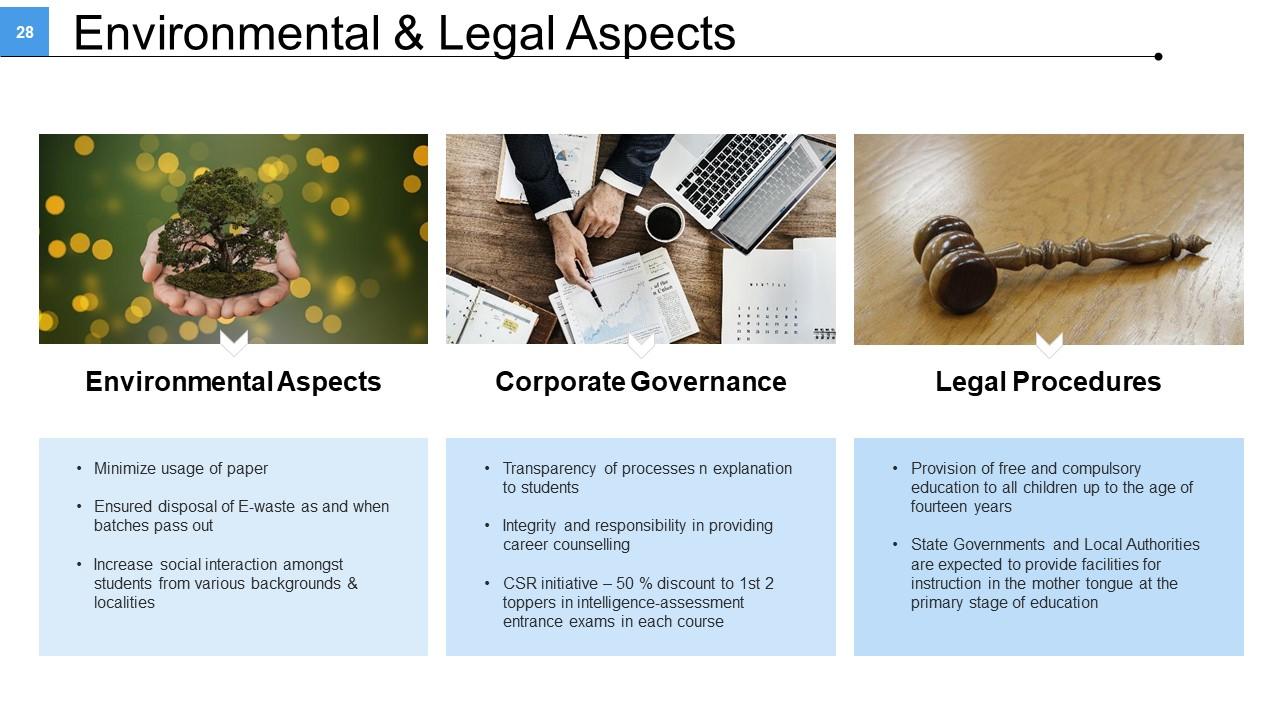
Slide 28: This slide showcases Environmental & Legal Aspects showing- Environmental Aspects, Corporate Governance, and Legal Procedures as the main subheadings.
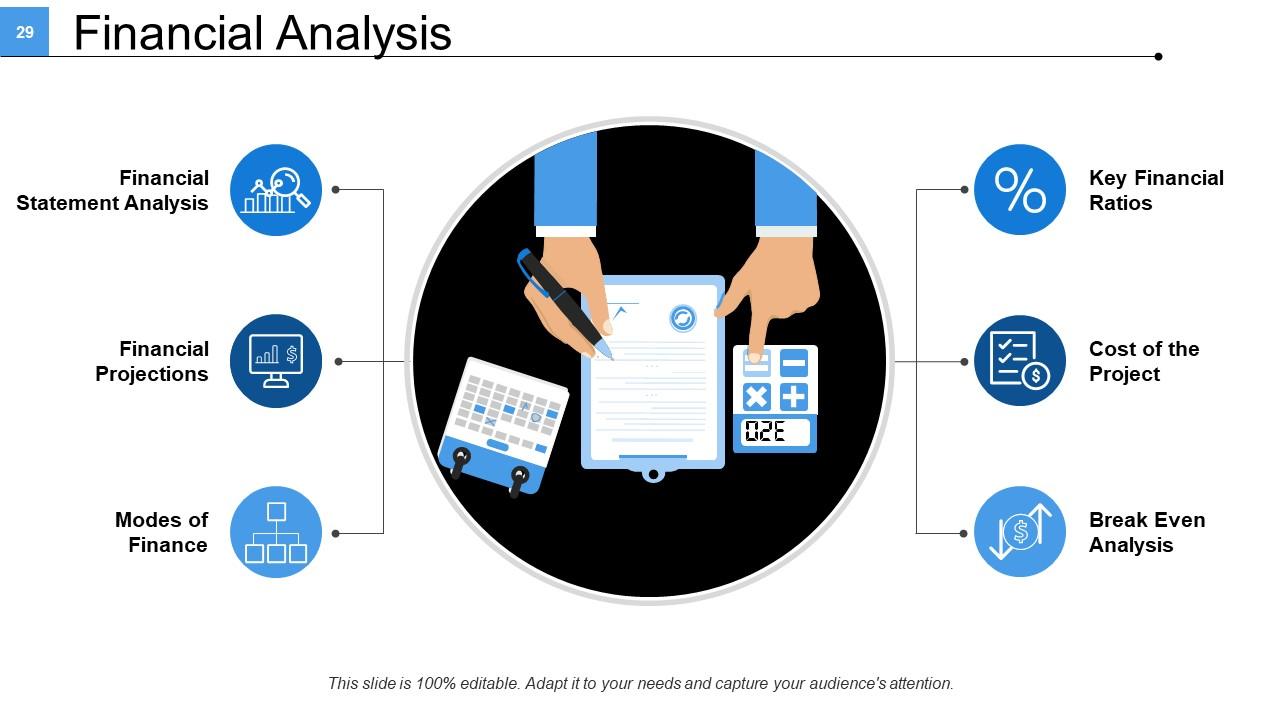
Slide 29: This is a Financial Analysis slide showing- Break Even Analysis, Key Financial Ratios, Cost of the Project, Financial Projections, Financial Statement Analysis, Modes of Finance.
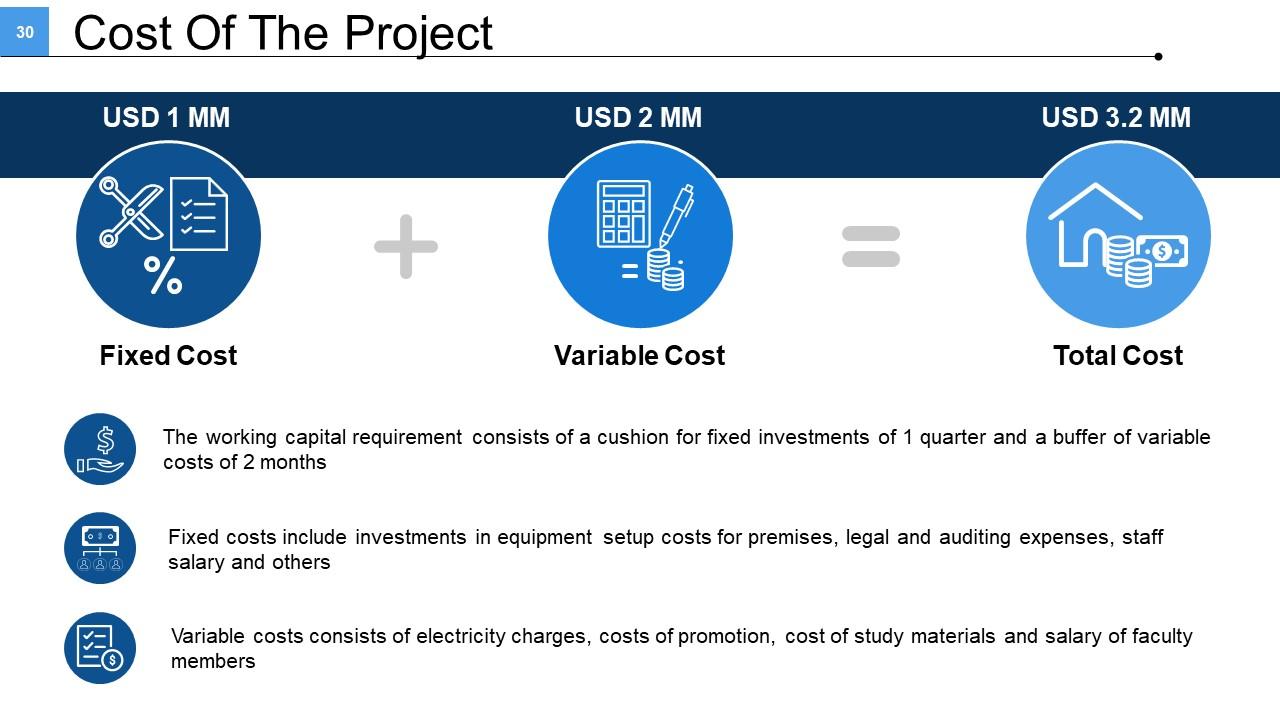
Slide 30: This slide showcases Cost Of The Project displaying- Fixed, Variable and Total cost.
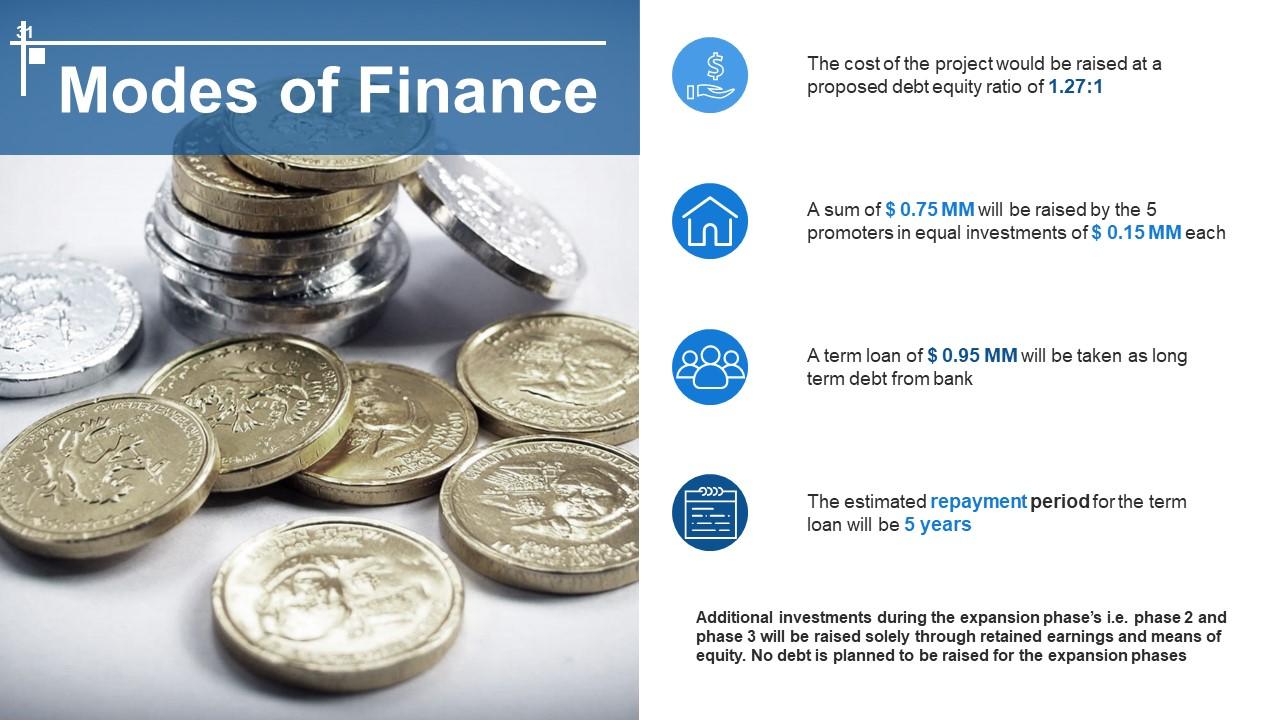
Slide 31: This slide showcases Modes of Finance. Additional investments during the expansion phase’s i.e. phase 2 and phase 3 will be raised solely through retained earnings and means of equity. No debt is planned to be raised for the expansion phases.
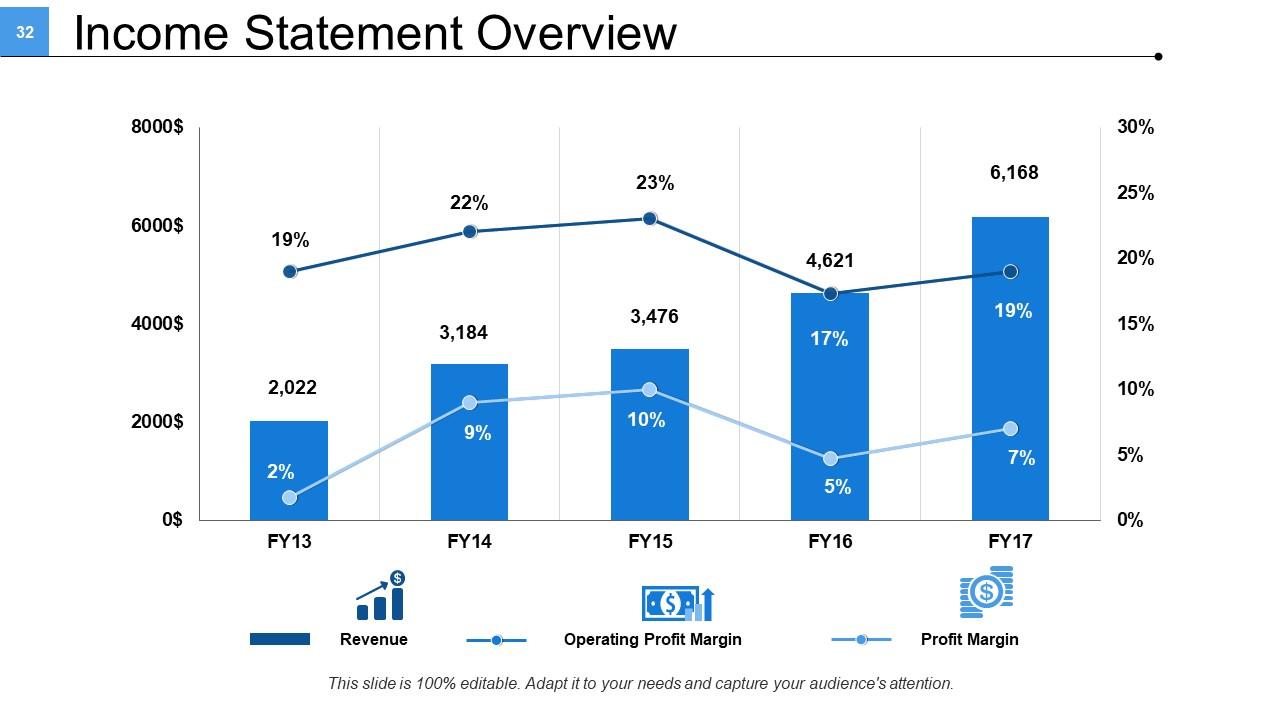
Slide 32: This slide presents Income Statement Overview in graph form displaying- Profit Margin, Revenue, Operating Profit Margin.
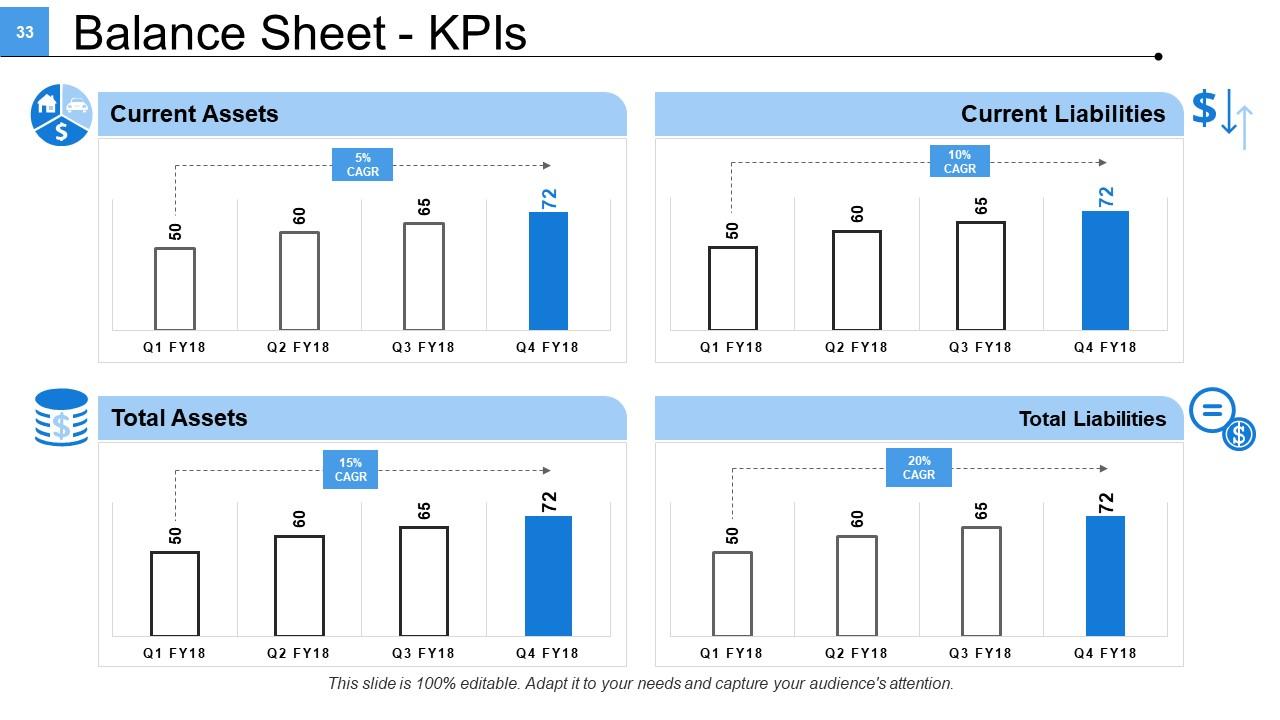
Slide 33: This slide presents Balance Sheet - KPIs CAGR of- Total Assets, Current Assets, Current Liabilities, Total Liabilities.
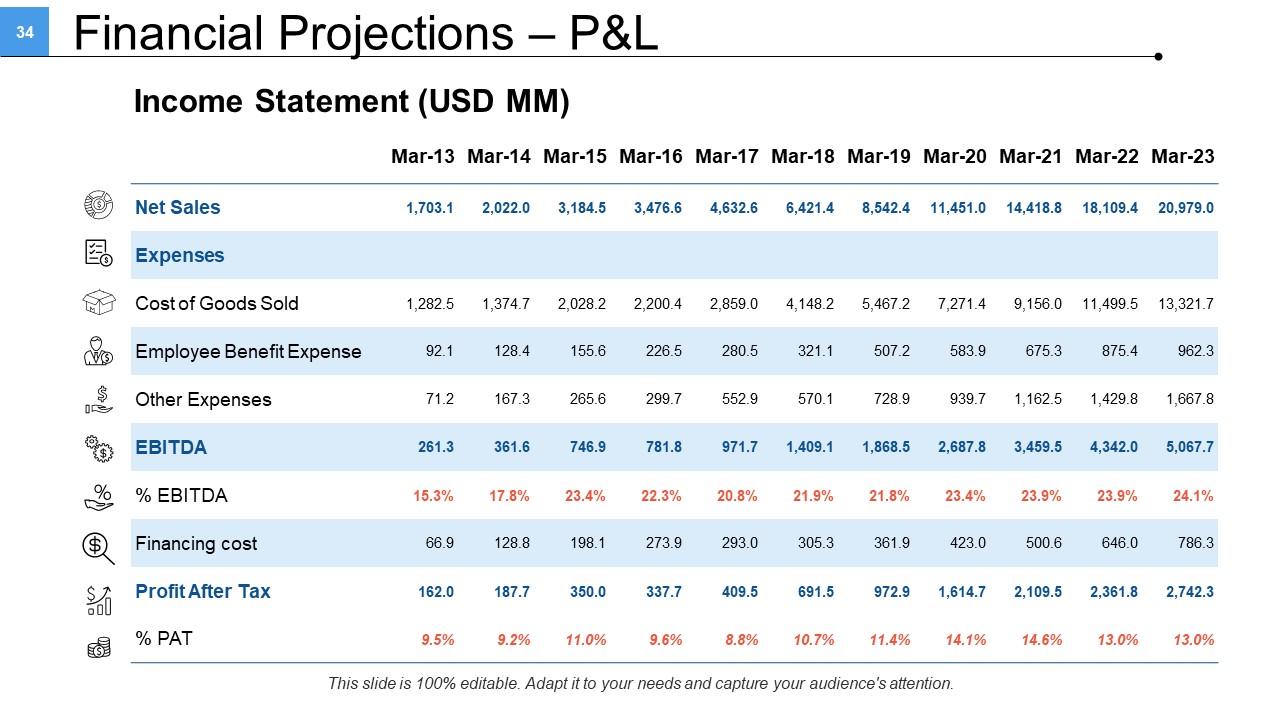
Slide 34: This slide shows Financial Projections – P&L Income Statement (USD MM) in tabular form.
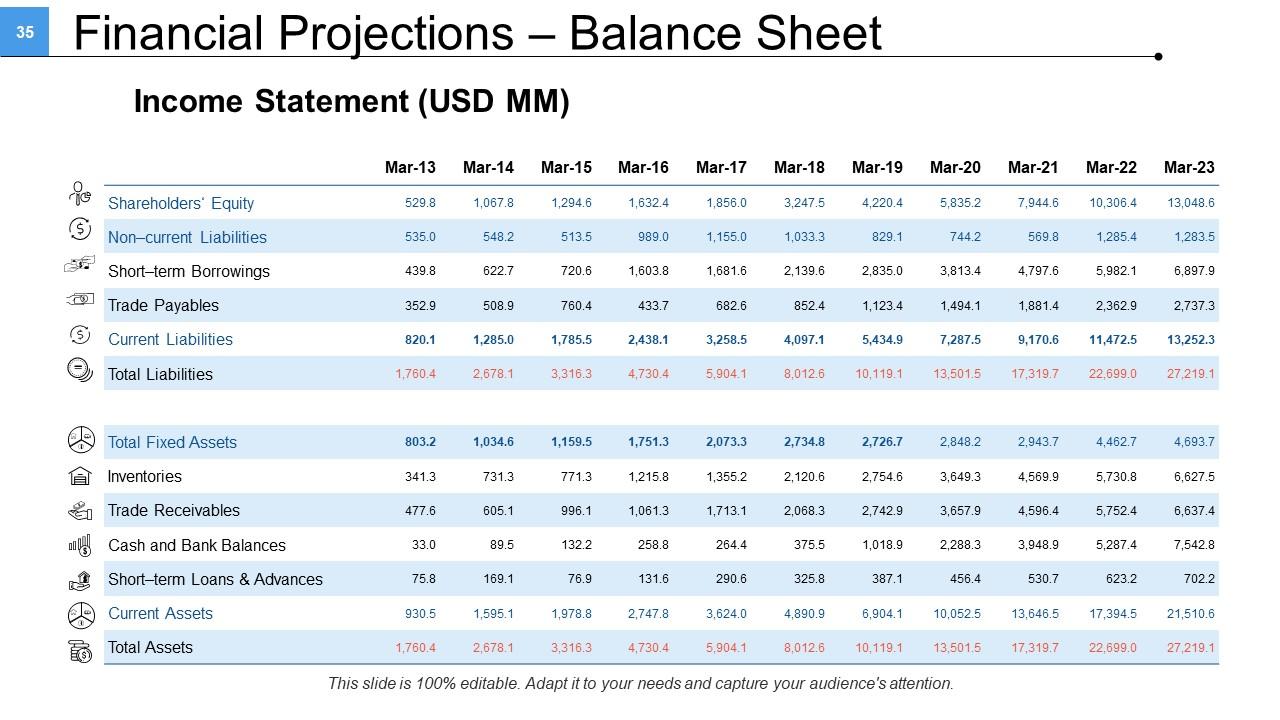
Slide 35: This slide displays Financial Projections – Balance Sheet Income Statement (USD MM)in tabular form.
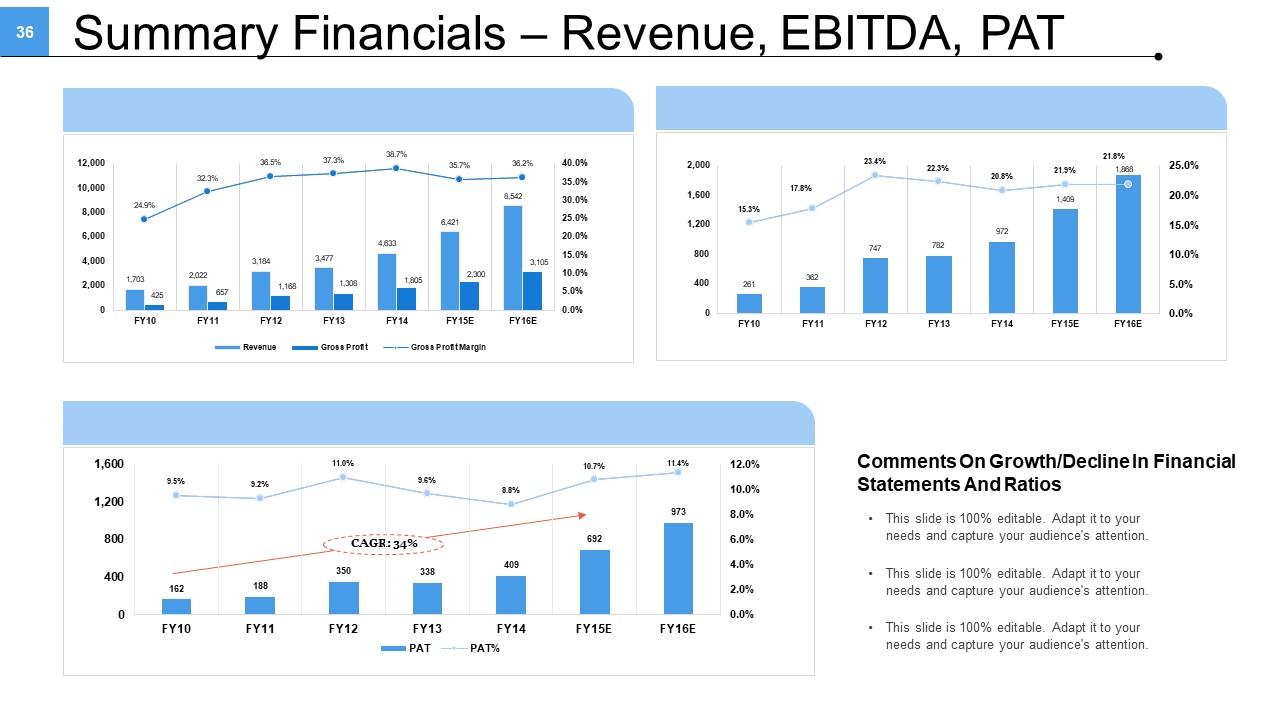
Slide 36: This slide displays Summary Financials – Revenue, EBITDA, PAT in graph form.
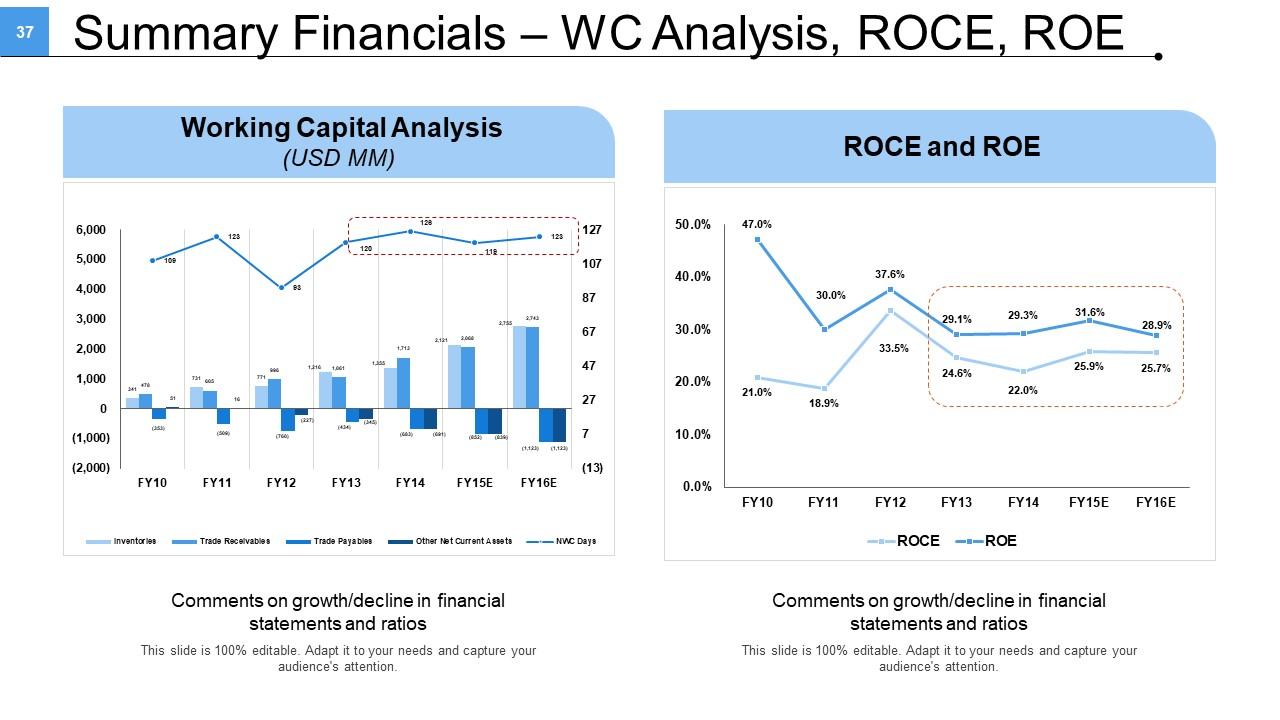
Slide 37: This slide displays Summary Financials WC Analysis, ROCE, ROE in graph form.
Slide 38: This is a Coffee Break slide to halt. You may change the slide content as per need.
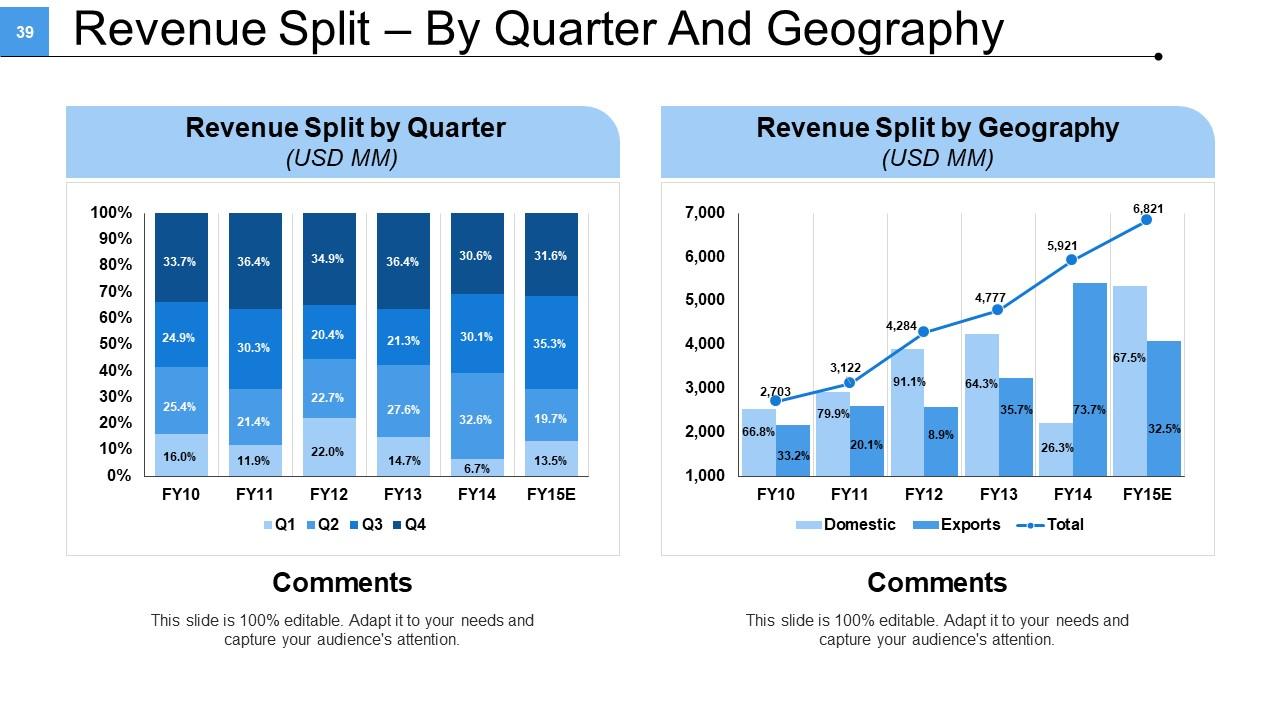
Slide 39: This slide showcases Revenue Split – By Quarter And Geography.
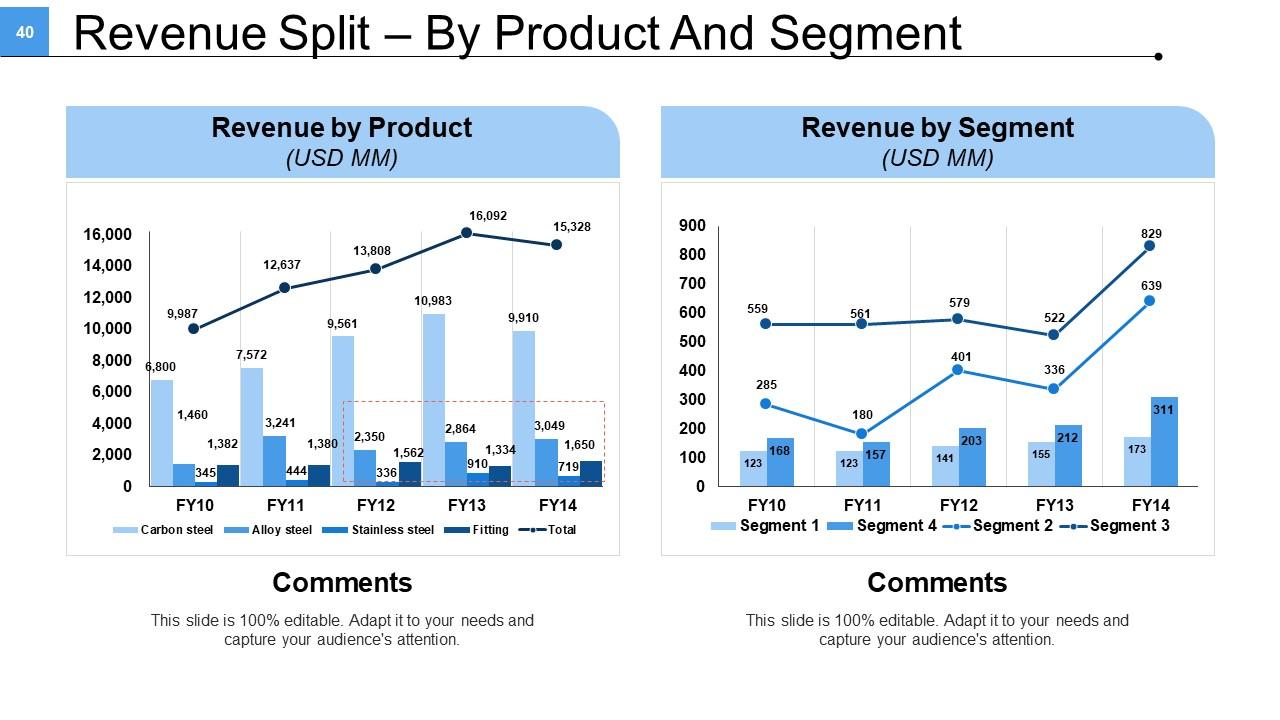
Slide 40: This slide showcases Revenue Split – By Product And Segment.
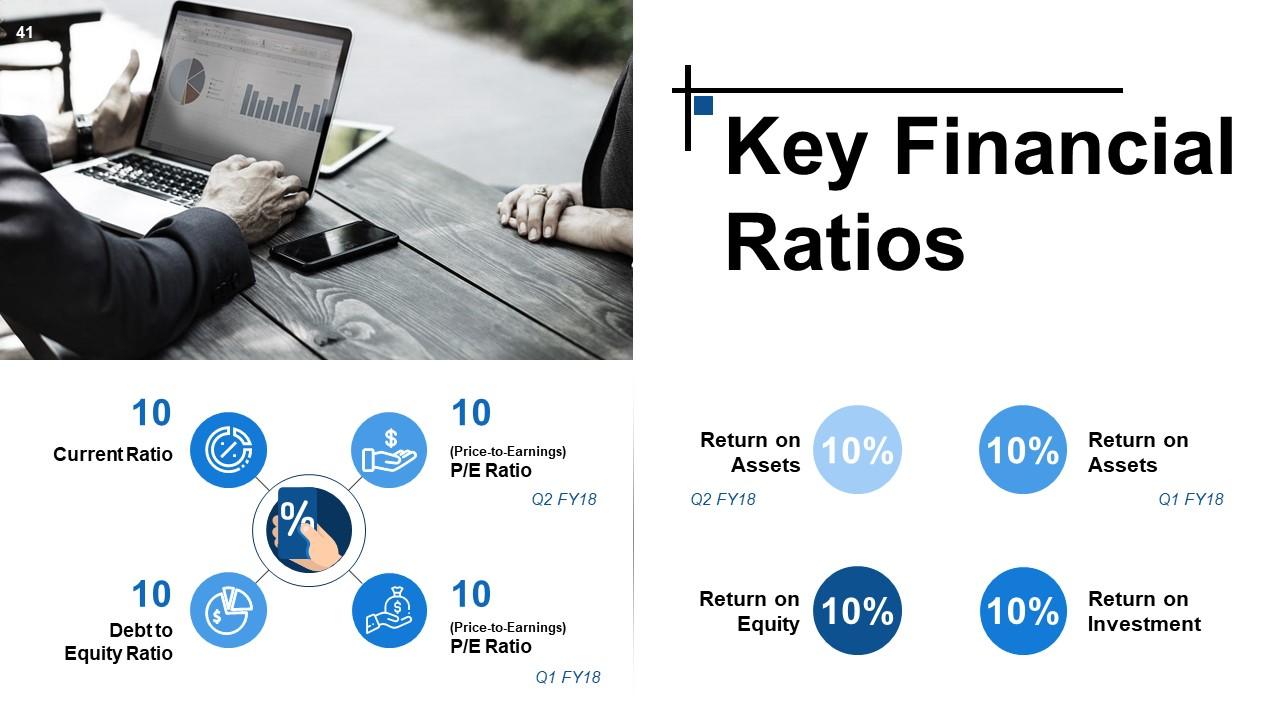
Slide 41: This slide presents Key Financial Ratios such as- P/E Ratio, Debt to Equity Ratio, Current Ratio, Return on Assets, Return on Equity, Return on Investment.
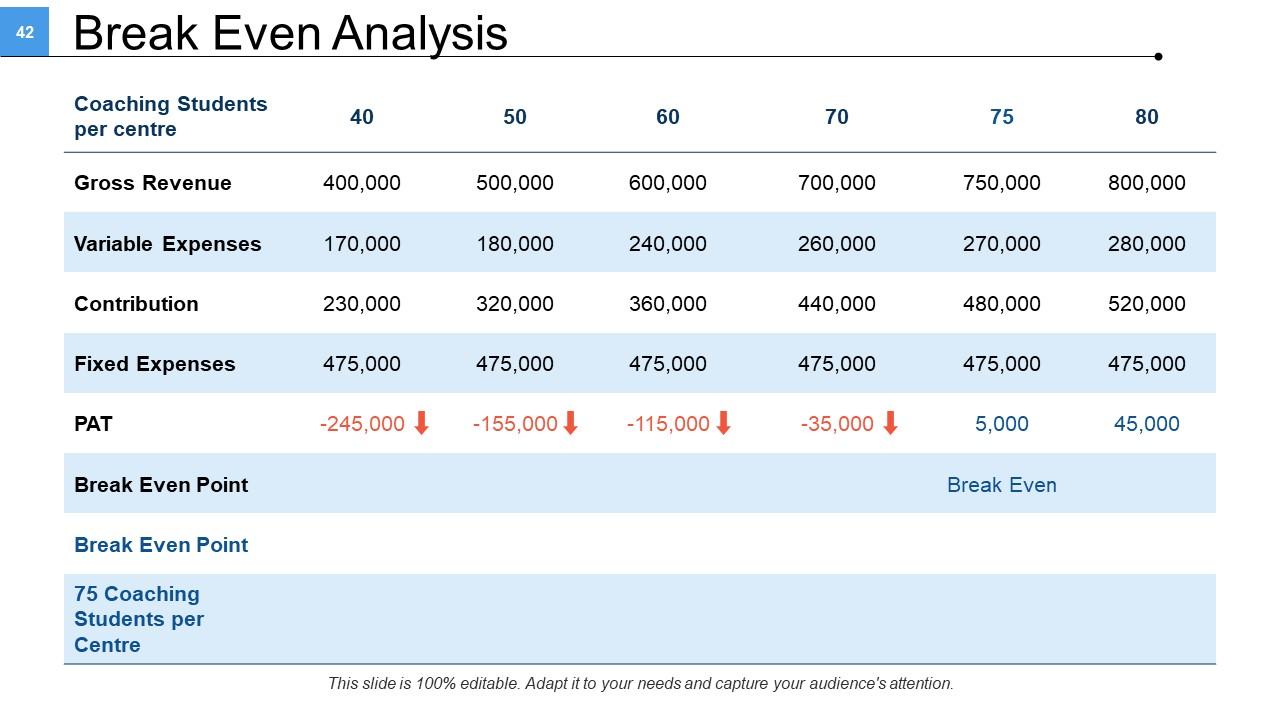
Slide 42: This is a Break Even Analysis tabular slide.
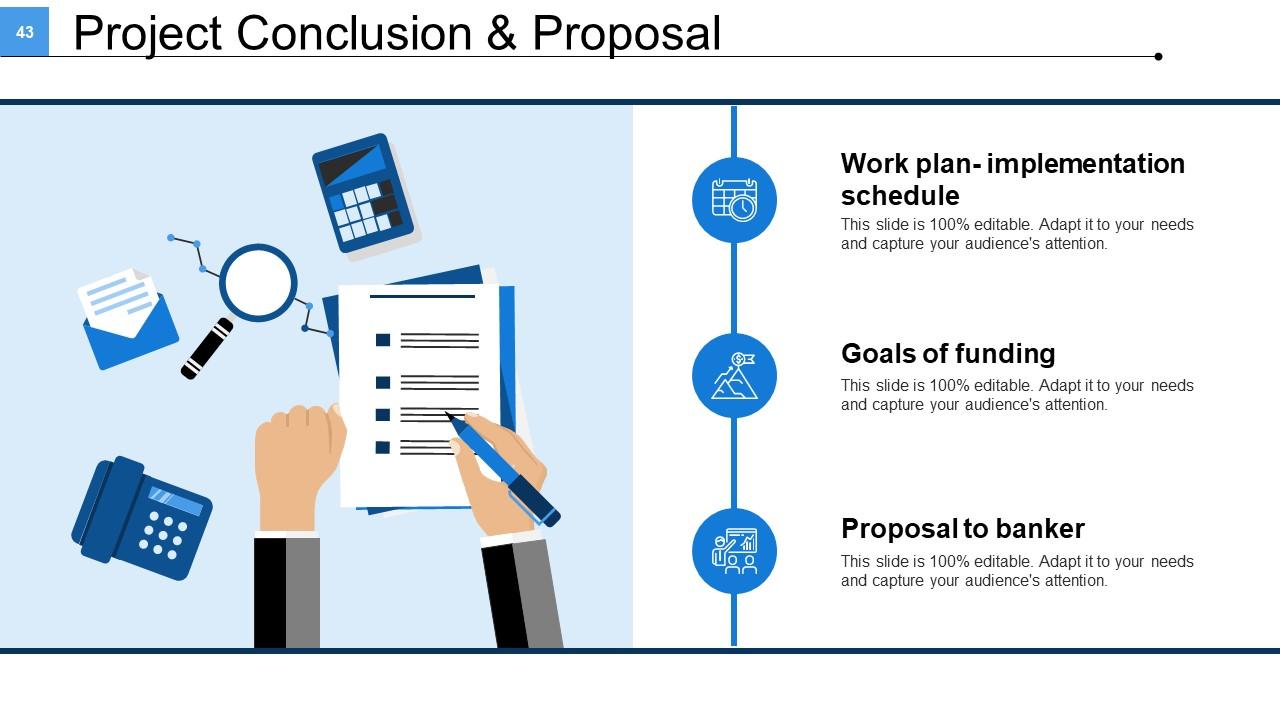
Slide 43: This slide showcases Project Conclusion & Proposal displaying- Work plan- implementation schedule, Goals of funding, Proposal to banker.
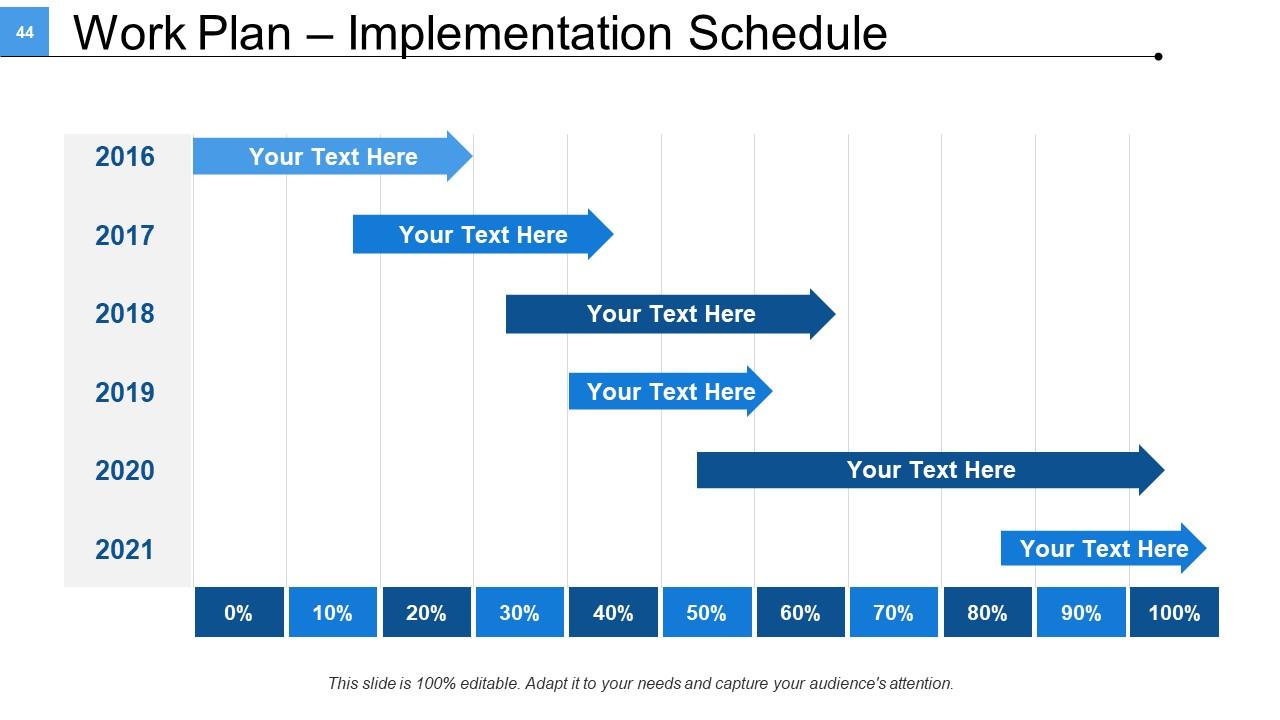
Slide 44: This slide displays Work Plan – Implementation Schedule in gantt chart form.
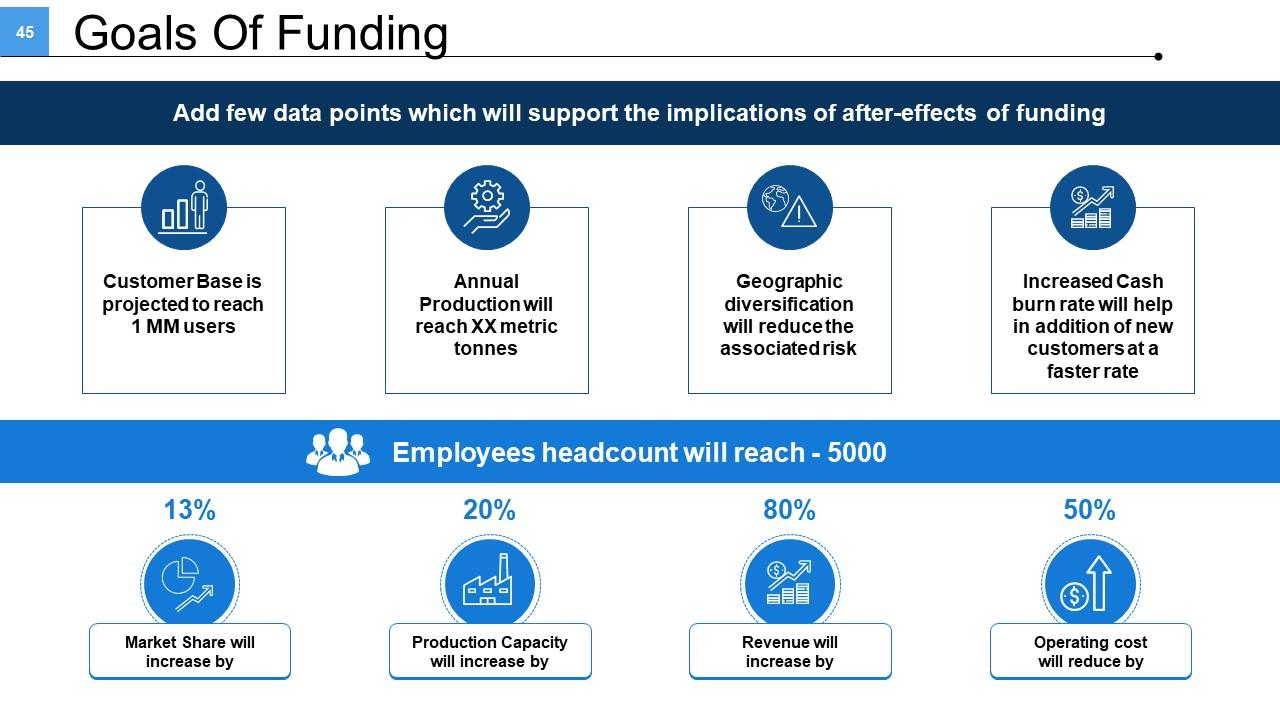
Slide 45: This slide presents Goals Of Funding to be showcased.
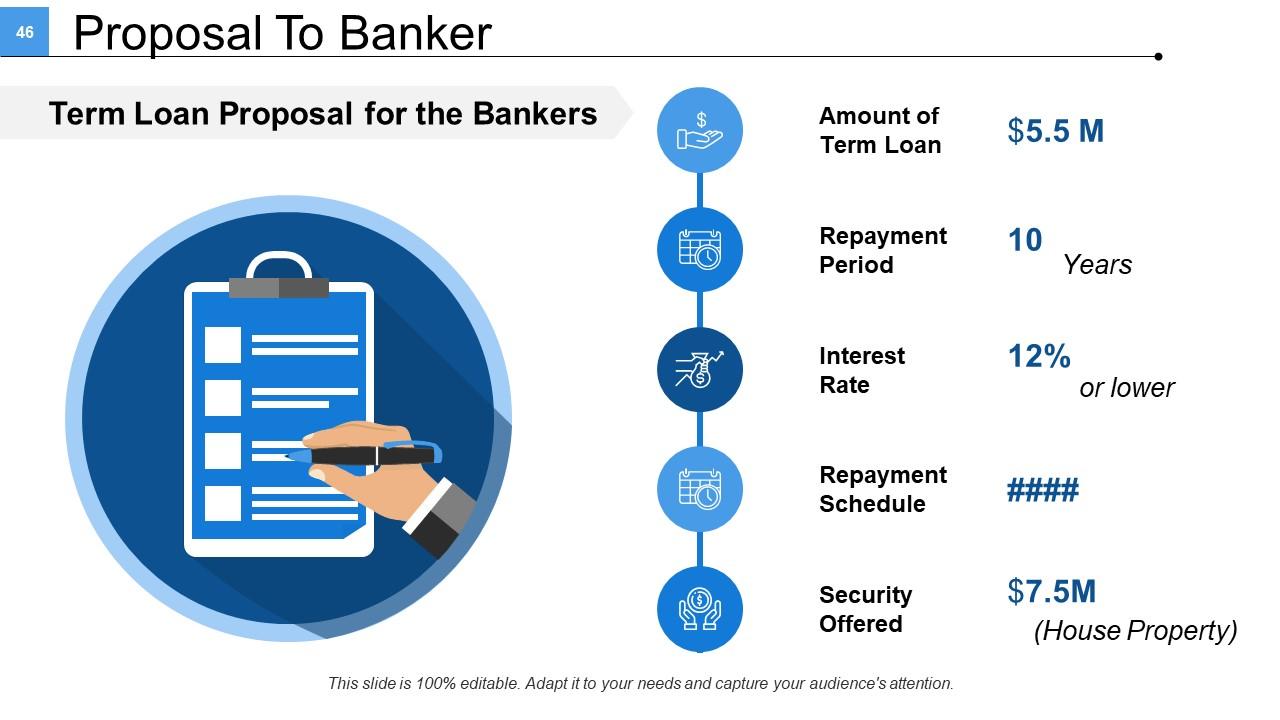
Slide 46: This slide presents Proposal To Banker displaying- Amount of Term Loan, Interest Rate, Repayment Period, Repayment Schedule, Security Offered.
Slide 47: This slide is titled Charts and Graphs. You may alter/change the slide content as per need.
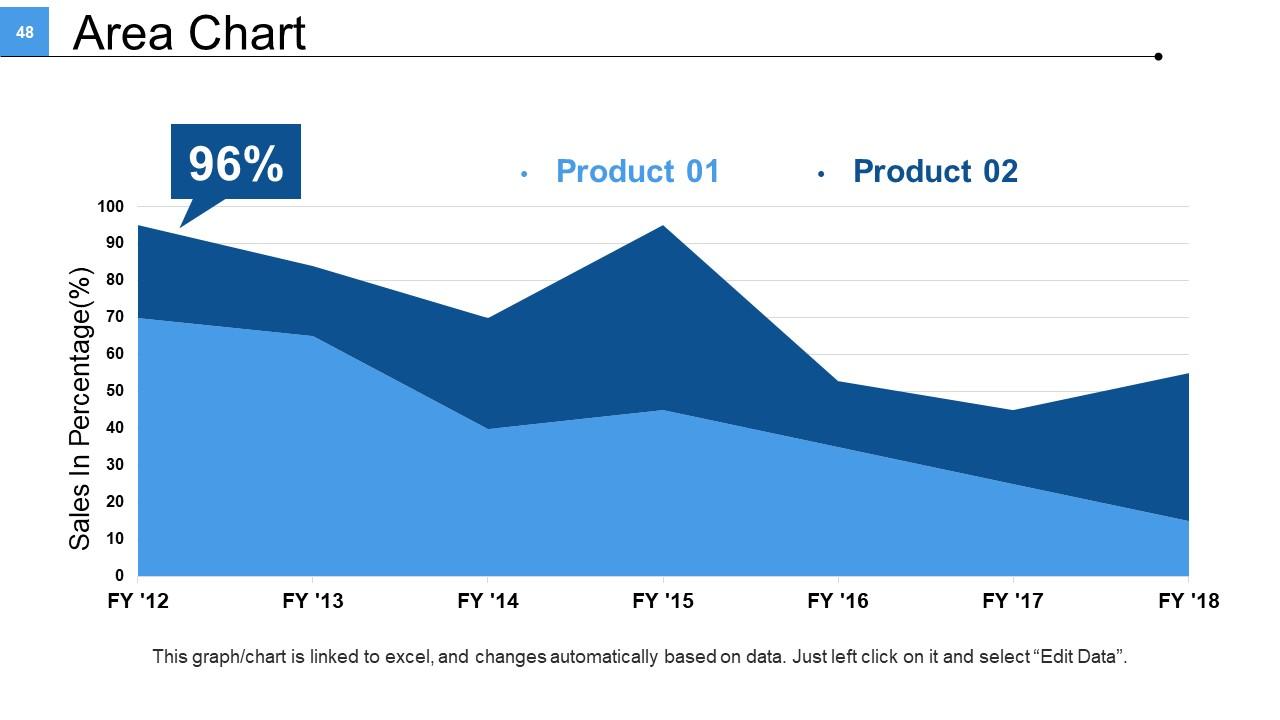
Slide 48: This slide displays an Area Chart for two product/entity comparison, information, specifications etc.
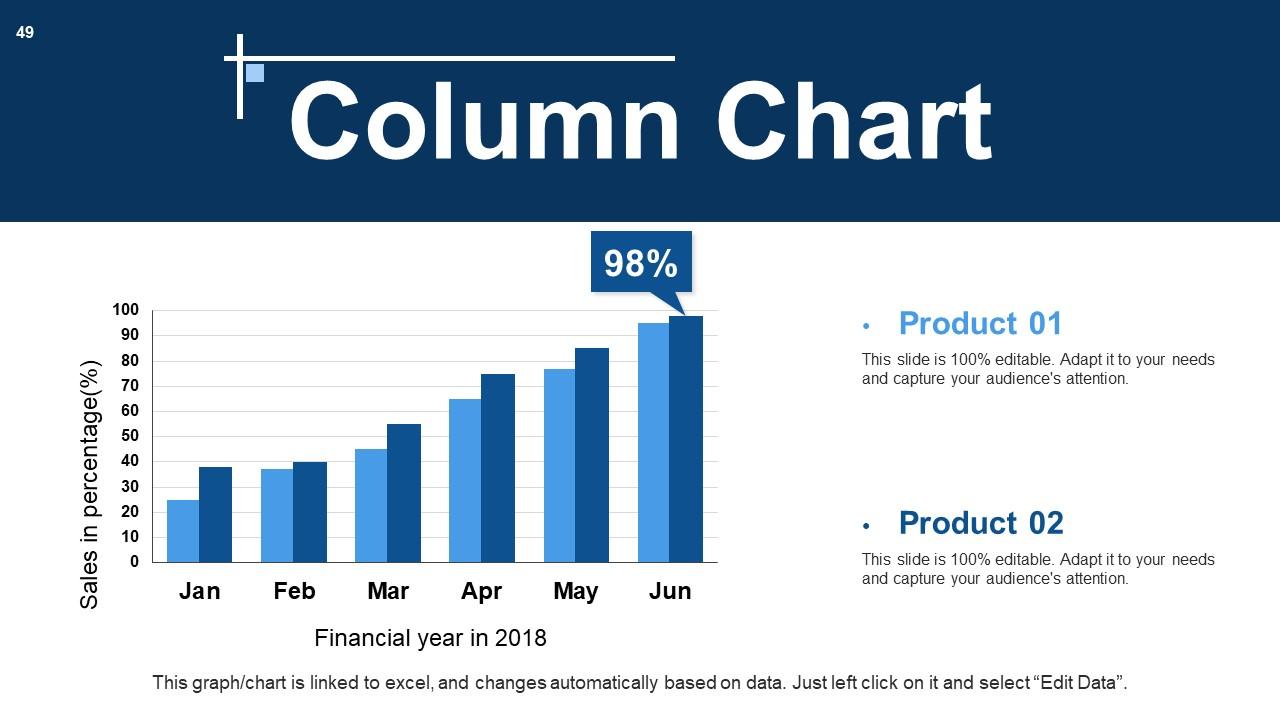
Slide 49: This slide presents a Column Chart for two product/entity comparison, information, specifications etc.
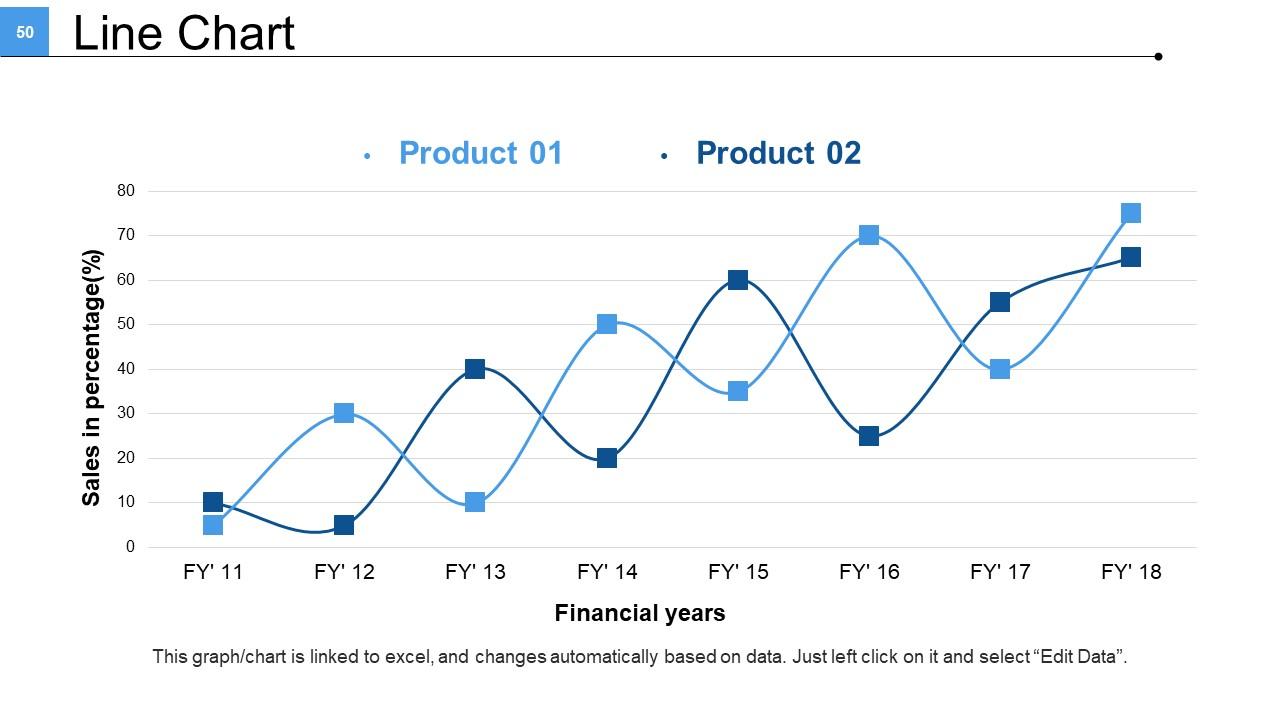
Slide 50: This slide showcases a Line Chart for two product/entity comparison, information, specifications etc.
Slide 51: This slide is titled Additional Slides. You may change the slide content as desired.
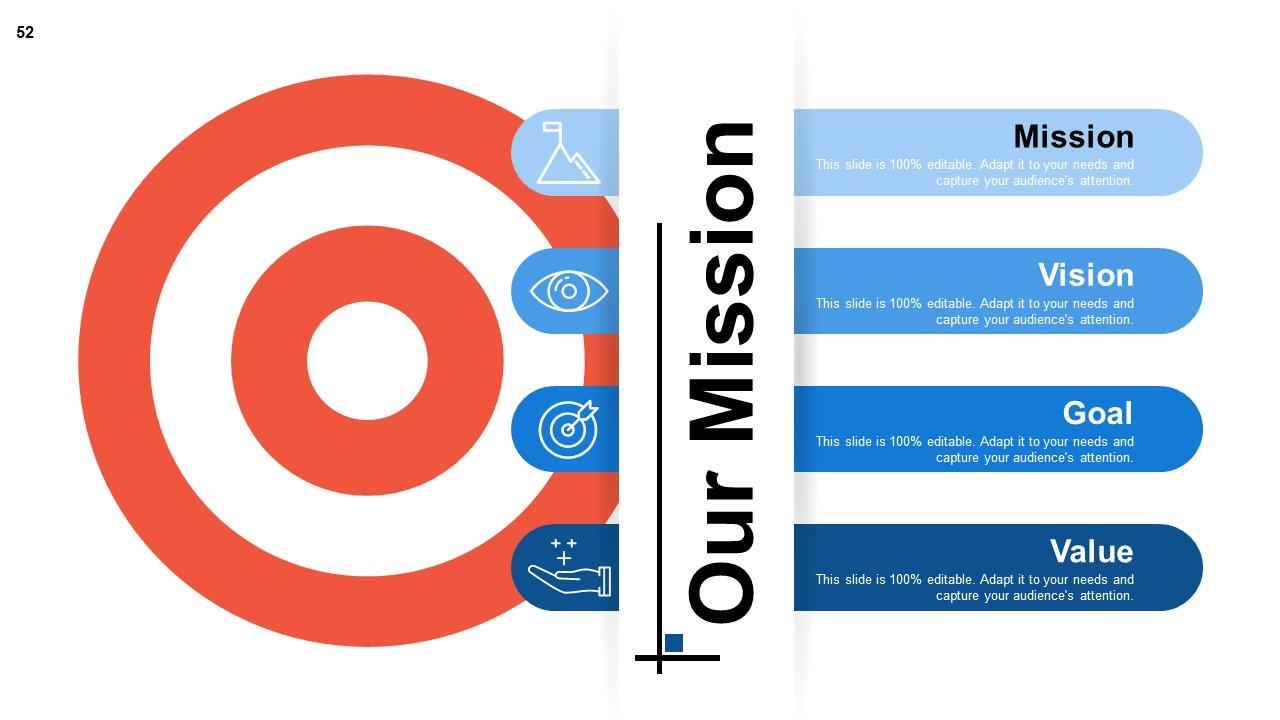
Slide 52: This is Our Mission slide with Vision, Goal and Value slide with icons. State all these aspects here.
Slide 53: This is an Awesome Team slide with name, image & text boxes to put the required information.
Slide 54: his is an About Us slide. State team/company specifications here.
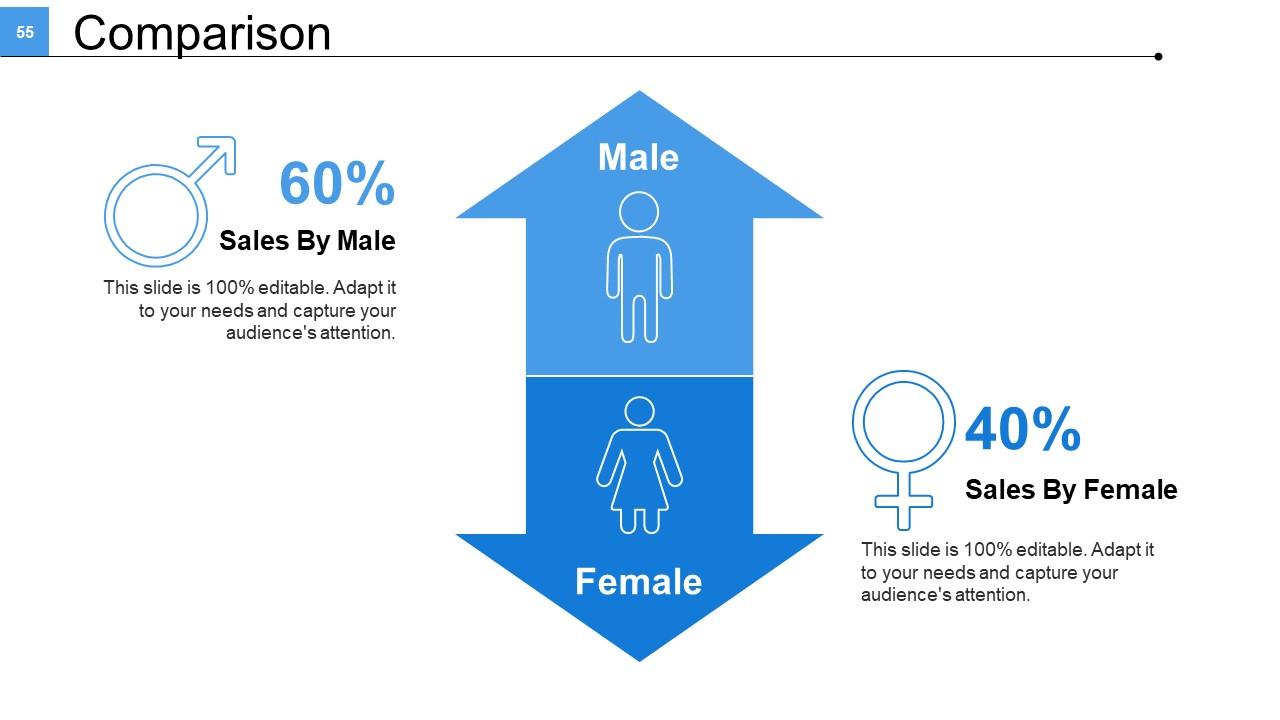
Slide 55: This is a Comparison slide for comparing entities/products etc. here.
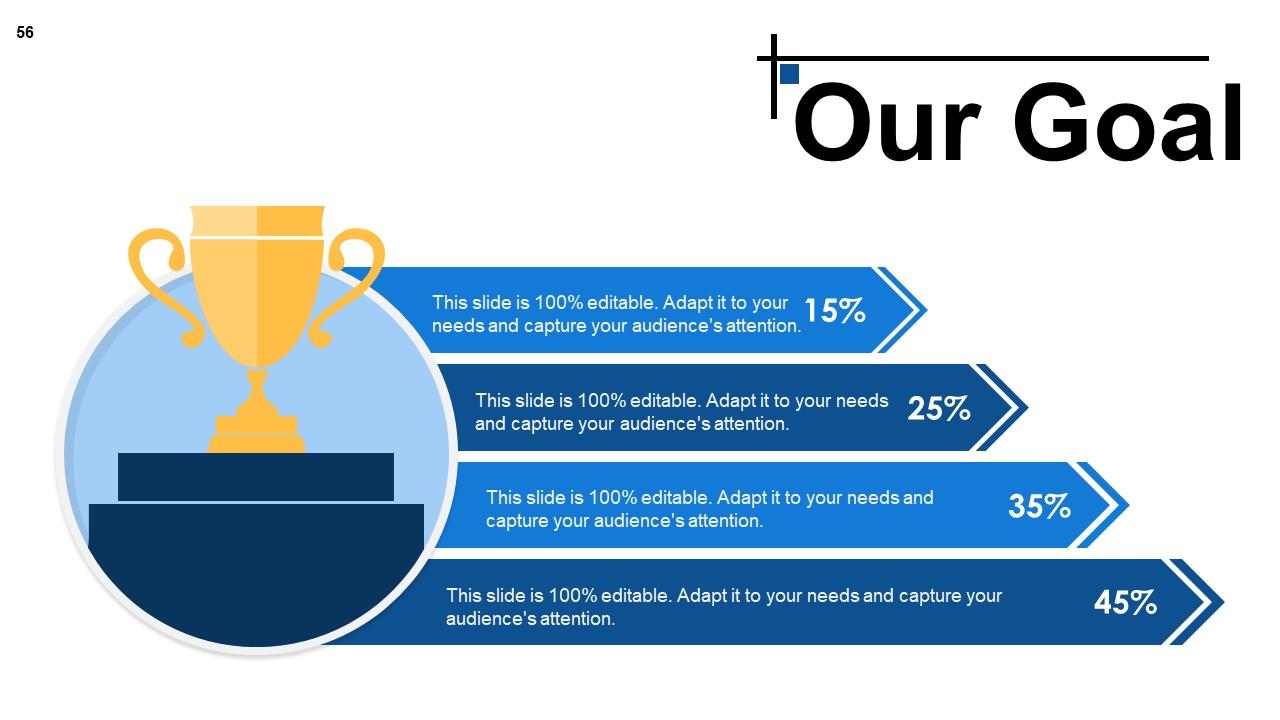
Slide 56: This Our Goal slide. State goals etc. here.
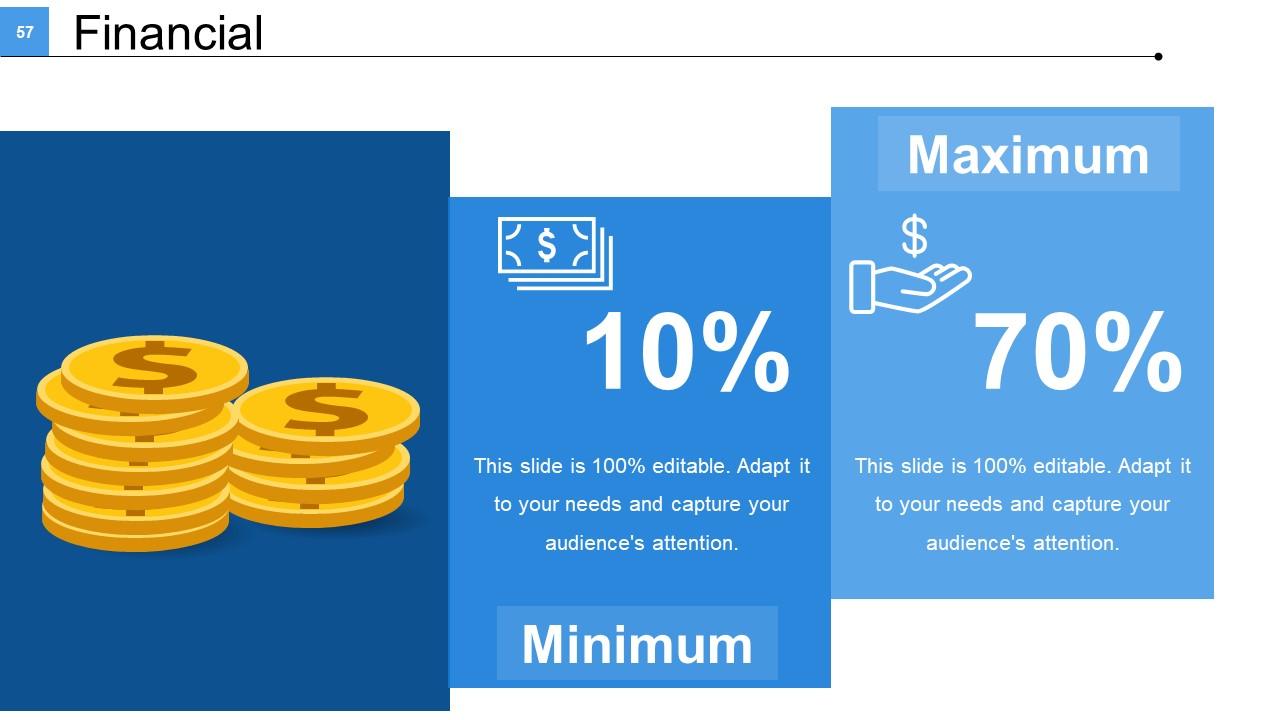
Slide 57: This is a Financial score slide. State financial aspects etc. here.
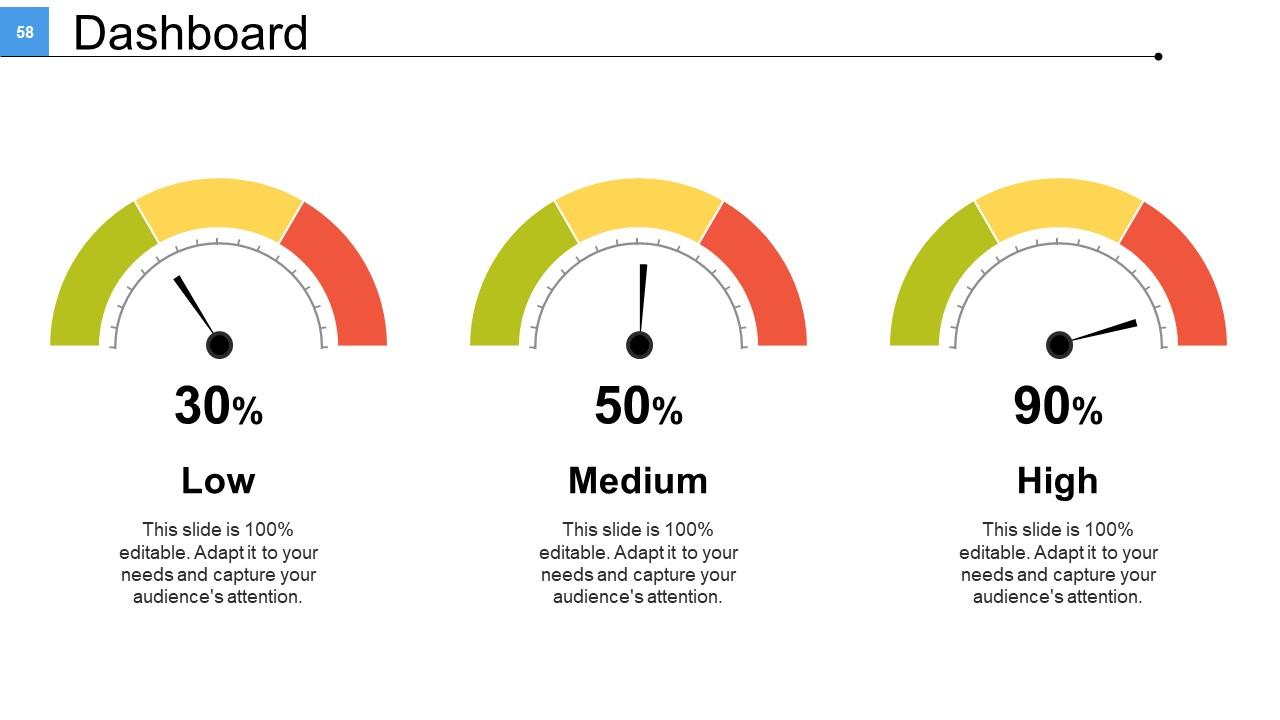
Slide 58: This is a Dashboard slide to state metrics, kpis etc.
Slide 59: This is a Quotes slide to convey company messages, beliefs etc. You can change the slide contents as per need.
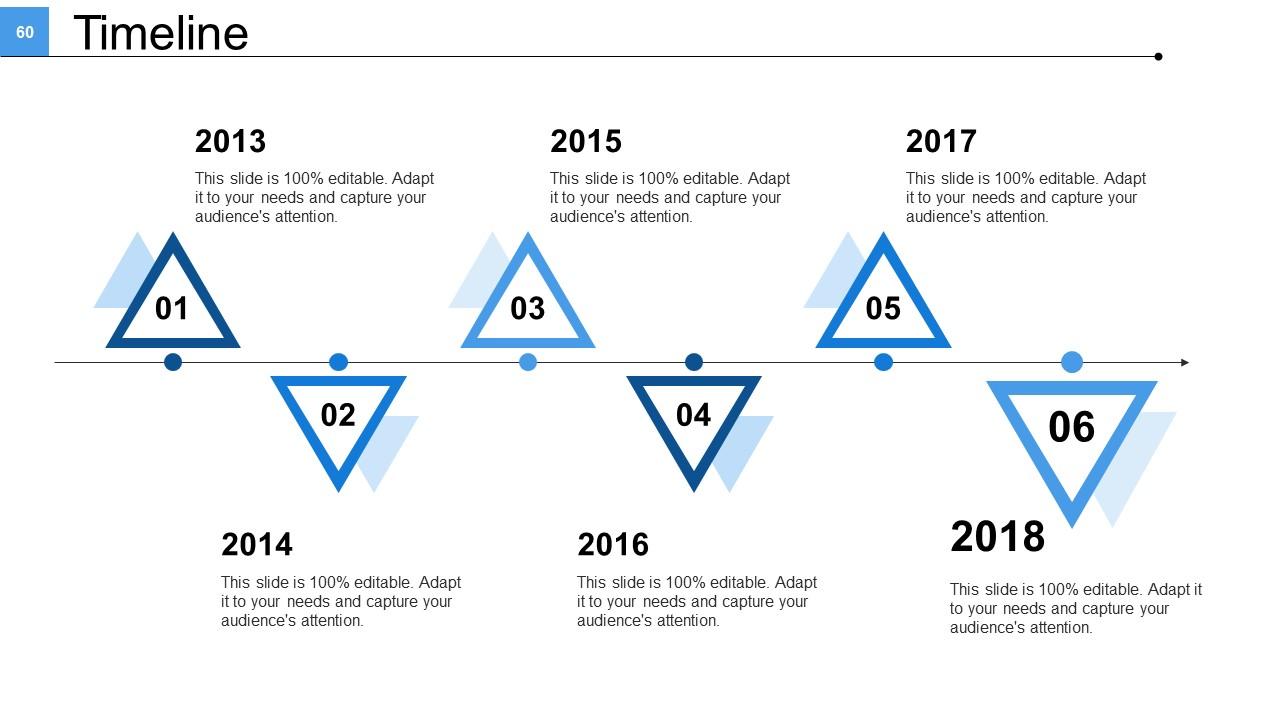
Slide 60: This is a Timeline slide to show evolution, growth, milestones etc.
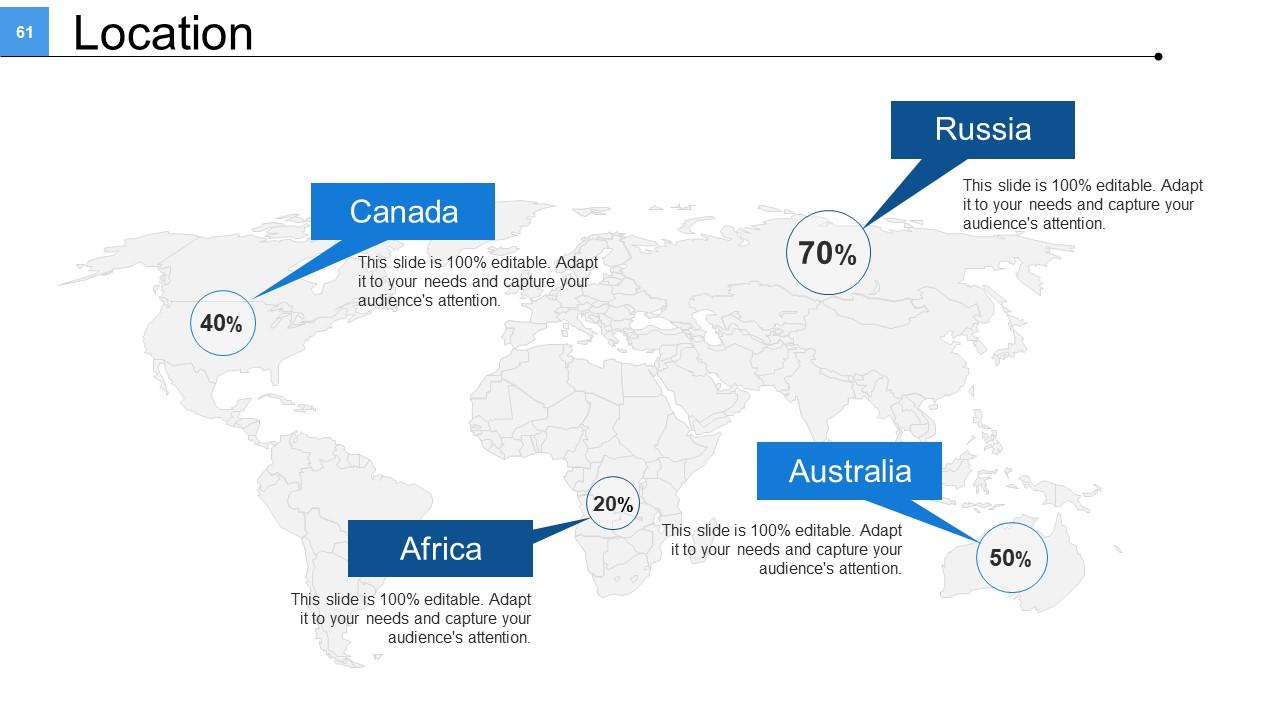
Slide 61: This is a Location slide of world map image to show global presence, growth etc.
Slide 62: This is Our Target slide to show targets, plans etc.
Slide 63: This is a Mind map image slide to show information, specifications etc.
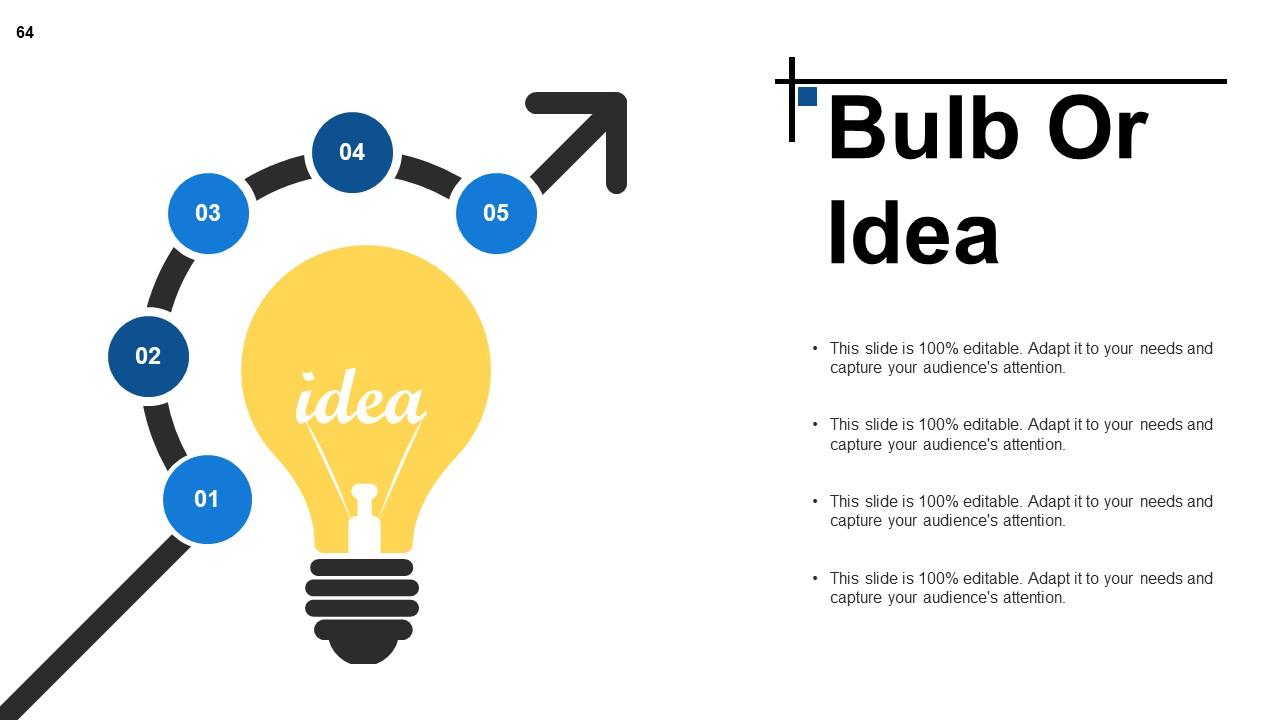
Slide 64: This is a Bulb or Idea image slide to show information, specifications, innovative aspects etc.
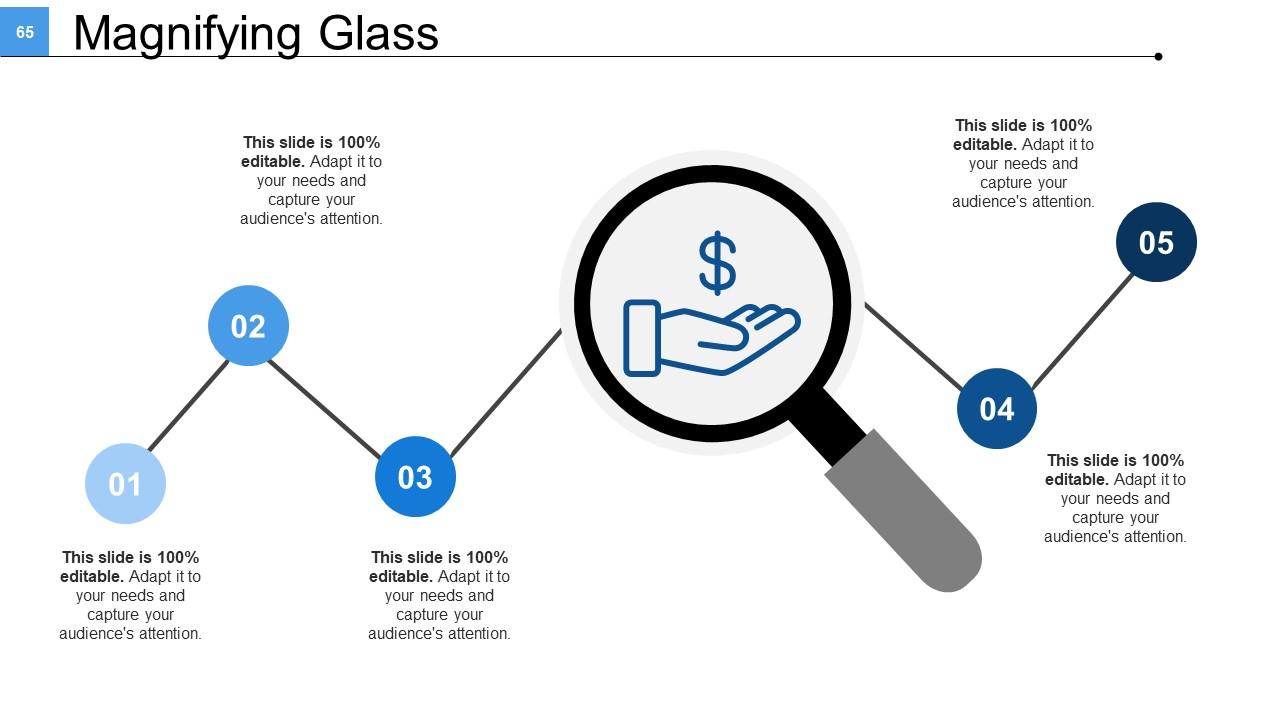
Slide 65: This slide shows a Magnifying glass image with text boxes. State information, specifications etc. here.
Slide 66: This is a Thank You slide with Address# street number, city, state, Contact Numbers, Email Address.
Steps In Project Appraisal Process Powerpoint Presentation Slides with all 66 slides:
Give folks an avenue to increase income with our Steps In Project Appraisal Process Powerpoint Presentation Slides. Introduce folks to better jobs.
-
The content is very helpful from business point of view.
-
Very unique, user-friendly presentation interface.


