


Customer acquisition cost powerpoint presentation with slides
Not sure from where to start next customer acquisition cost complete PowerPoint slide deck? We can help with our readymade presentation deck designed to thoroughly illustrate cost of customer acquisition. Well you can apply our PPT example to lay emphasis on the average customer acquisition cost that company spends to retain a customer. Besides this with help of our customer acquisition PowerPoint show you can underline the efforts as well as tips required to turn a prospective customer into a loyal customer. Going further, our PPT model prove handy to illustrate customer acquisition strategy and customer acquisition cost formula for better comprehension of the topic. Apart from this, you can make a effective visual communication casting spotlight on financial allocations given to sales and marketing teams for acquiring additional customers. There is more that you can accomplish with this pictorial show as we have included exclusive PPT templates like target group segment, customer acquisition channels, acquisition strategy plan, demand creation strategy and many more. So, whats holding you back from getting started? Get it before everybody else! Our Customer Acquisition Cost Complete Powerpoint Deck With Slides are as good as a crystal ball. They enable you to gaze at the future.











-

- Google Slides is a new FREE Presentation software from Google.
- All our content is 100% compatible with Google Slides.
- Just download our designs, and upload them to Google Slides and they will work automatically.
- Amaze your audience with SlideTeam and Google Slides.
-

Want Changes to This PPT Slide? Check out our Presentation Design Services
-

- WideScreen Aspect ratio is becoming a very popular format. When you download this product, the downloaded ZIP will contain this product in both standard and widescreen format.
-

- Some older products that we have may only be in standard format, but they can easily be converted to widescreen.
- To do this, please open the SlideTeam product in Powerpoint, and go to
- Design ( On the top bar) -> Page Setup -> and select "On-screen Show (16:9)” in the drop down for "Slides Sized for".
- The slide or theme will change to widescreen, and all graphics will adjust automatically. You can similarly convert our content to any other desired screen aspect ratio.
Compatible With Google Slides

Get This In WideScreen
You must be logged in to download this presentation.


Do you want to remove this product from your favourites?
PowerPoint presentation slides
A ready to use cpa set comprising 61 template designs. Ideal PPT presentation for sales, marketing, acquisition manager and customer service managers. High resolution comparison tables and graphs for better comprehension. Manual editing process as simple as ABC. No limited space to insert text, titles, sub titles, logo, trademark, animation etc. Goes well with Google slides. Can be easily converted into PDF or JPG formats. The stages in this process are customer retention, business intelligence, lead management, customer value, customer engagement, business acquisition, customer acquisition cost.

People who downloaded this PowerPoint presentation also viewed the following :
Content of this Powerpoint Presentation
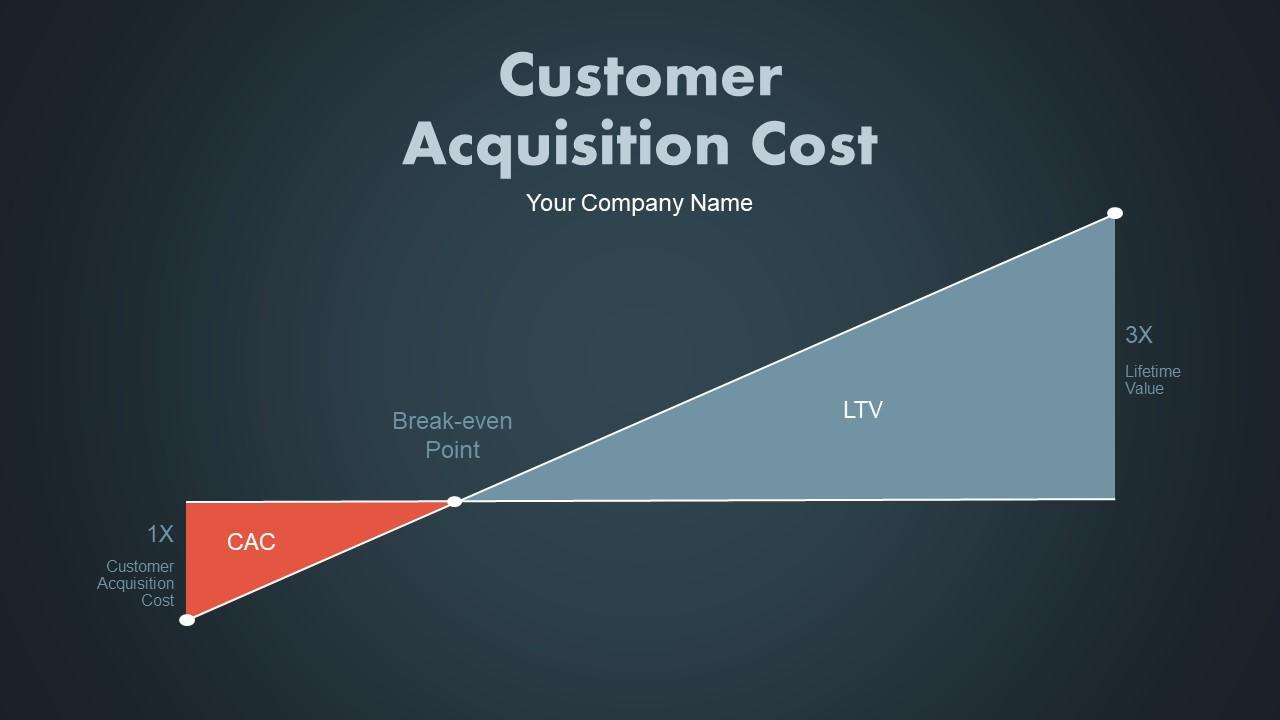
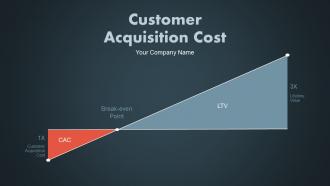
Slide 1: This slide shows Customer Acquisition Cost of your company. State your company name and begin.
Slide 2: This is an Agenda slide. State your agendas here.
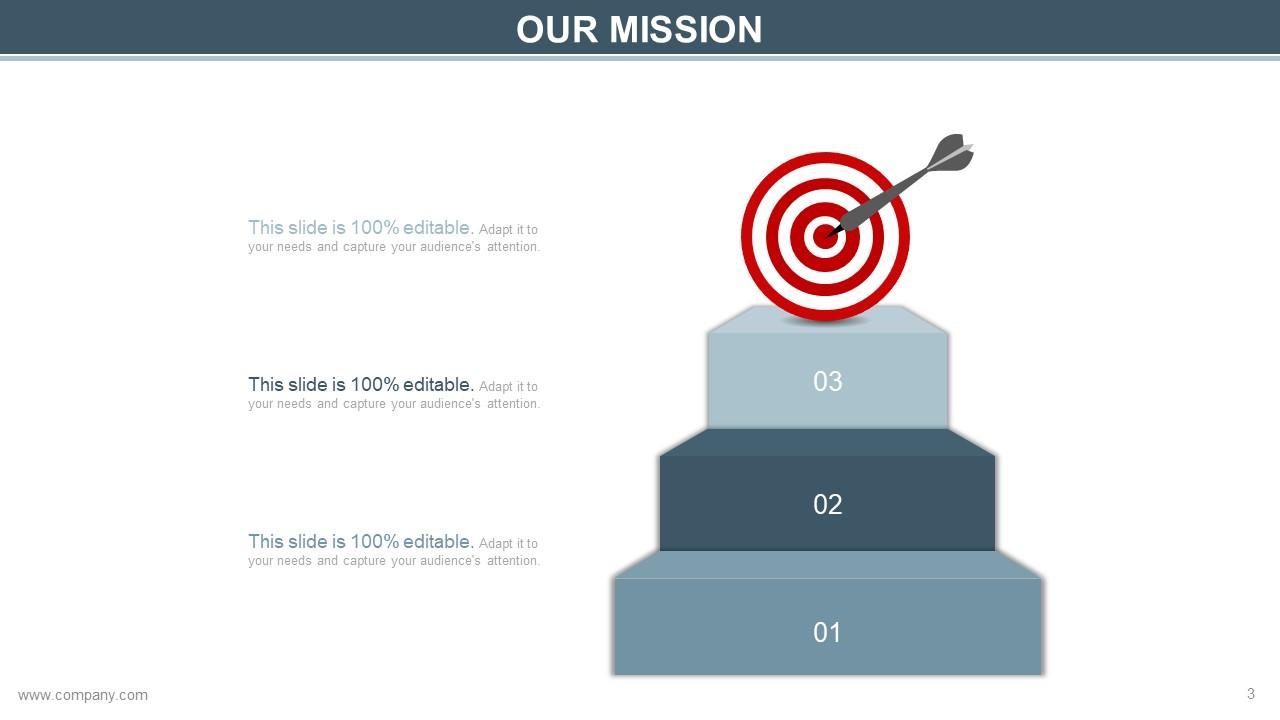
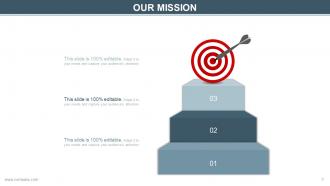
Slide 3: This is OUR MISSION slide with arrow and a target imagery. State your company's mission here.
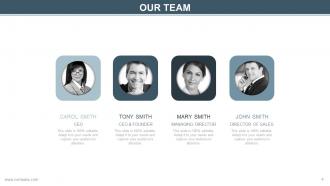
Slide 4: This slide helps depict Our Team with text boxes to fill in the name and designation.
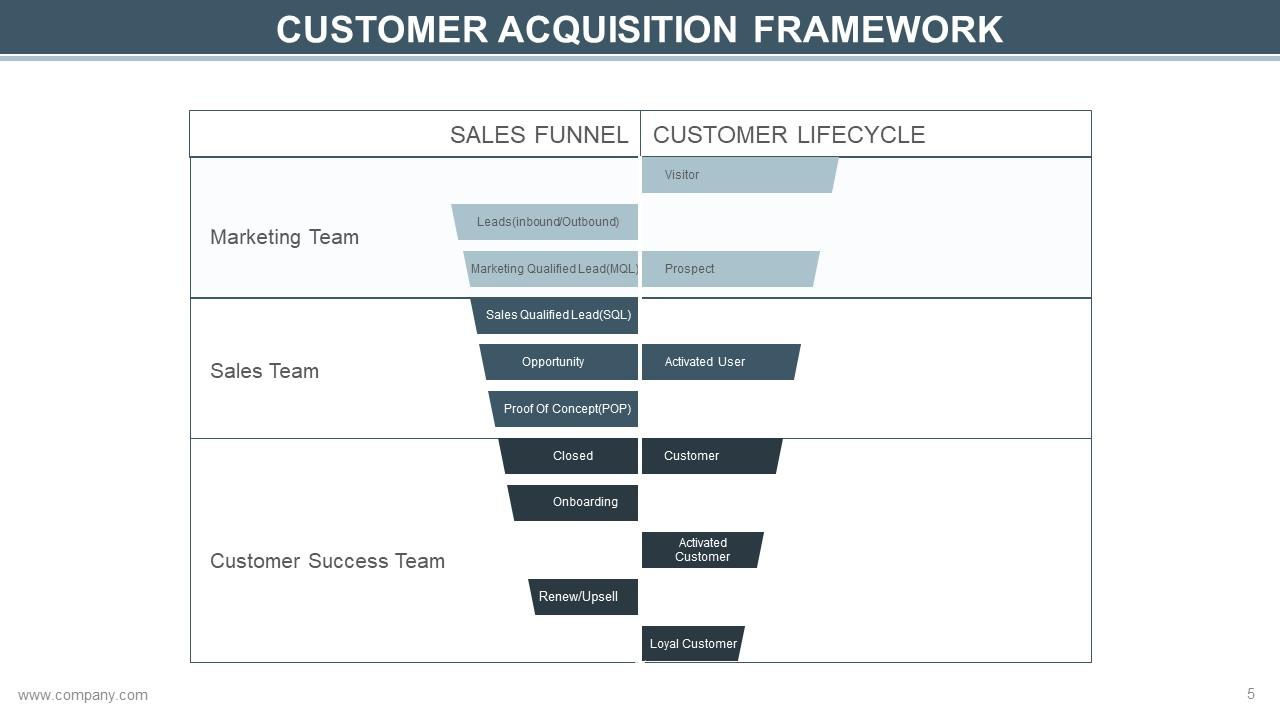
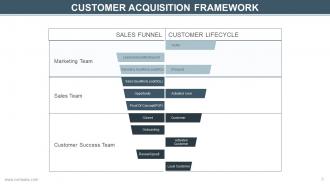
Slide 5: This slide presents Customer Acquisition Framework in a funnel form showing- Marketing Team, Sales Team, Customer Success Team, Customer Lifecycle, Sales Funnel, Visitor, Prospect, Activated User, Customer, Loyal Customer, Activated Customer, Leads(inbound/Outbound), Marketing Qualified Lead(MQL), Sales Qualified Lead(SQL), Opportunity, Proof Of Concept(POP), Closed, Onboarding, Renew/Upsell.
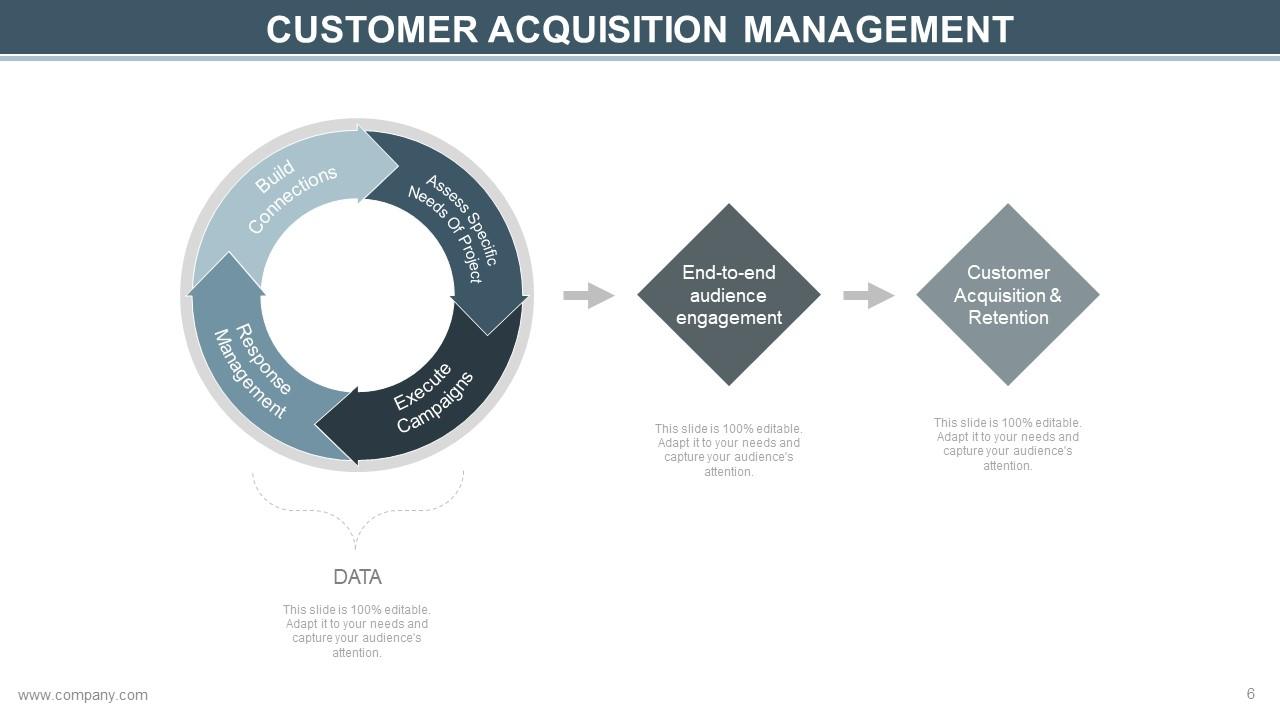
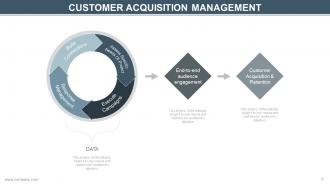
Slide 6: This slide showcases Customer Acquisition Management with the main heading DATA consisiting of- Customer Acquisition & Retention, End-to-end audience engagement, Response management, Execute campaigns, Assess specific needs of project, Build connections.
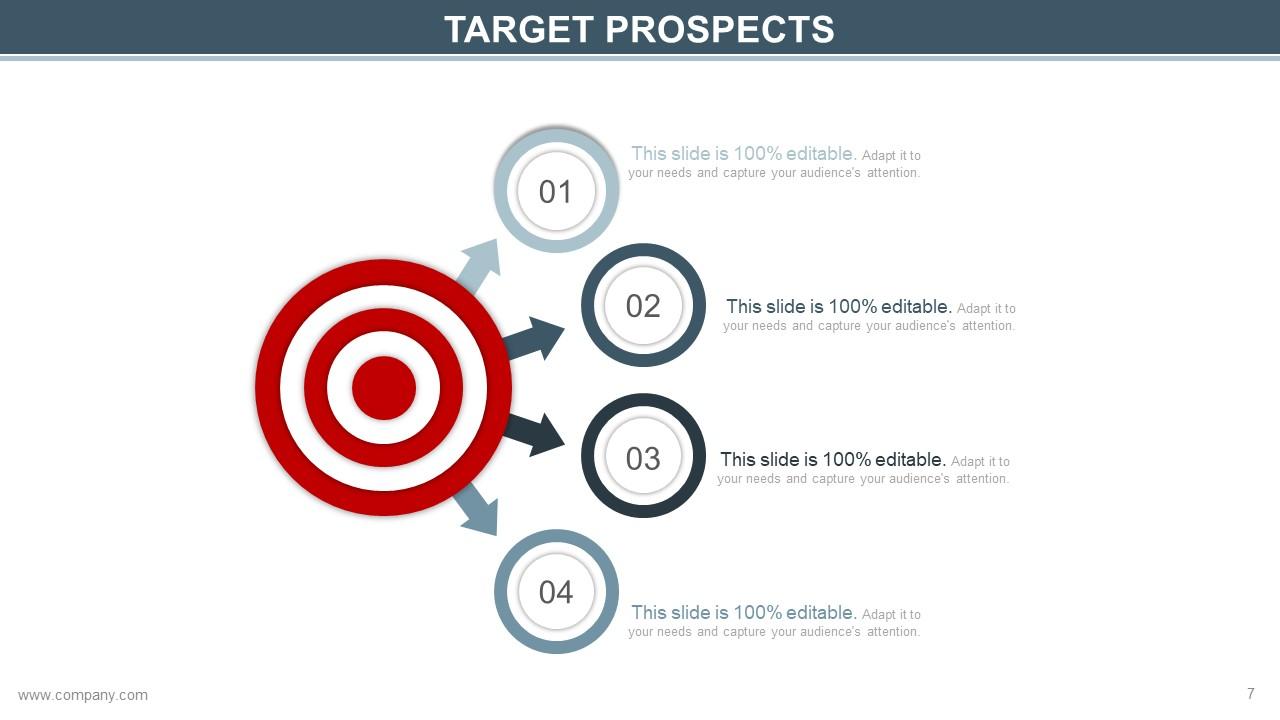
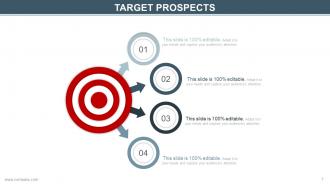
Slide 7: This slide displays Target Prospects. State briefly about them here.
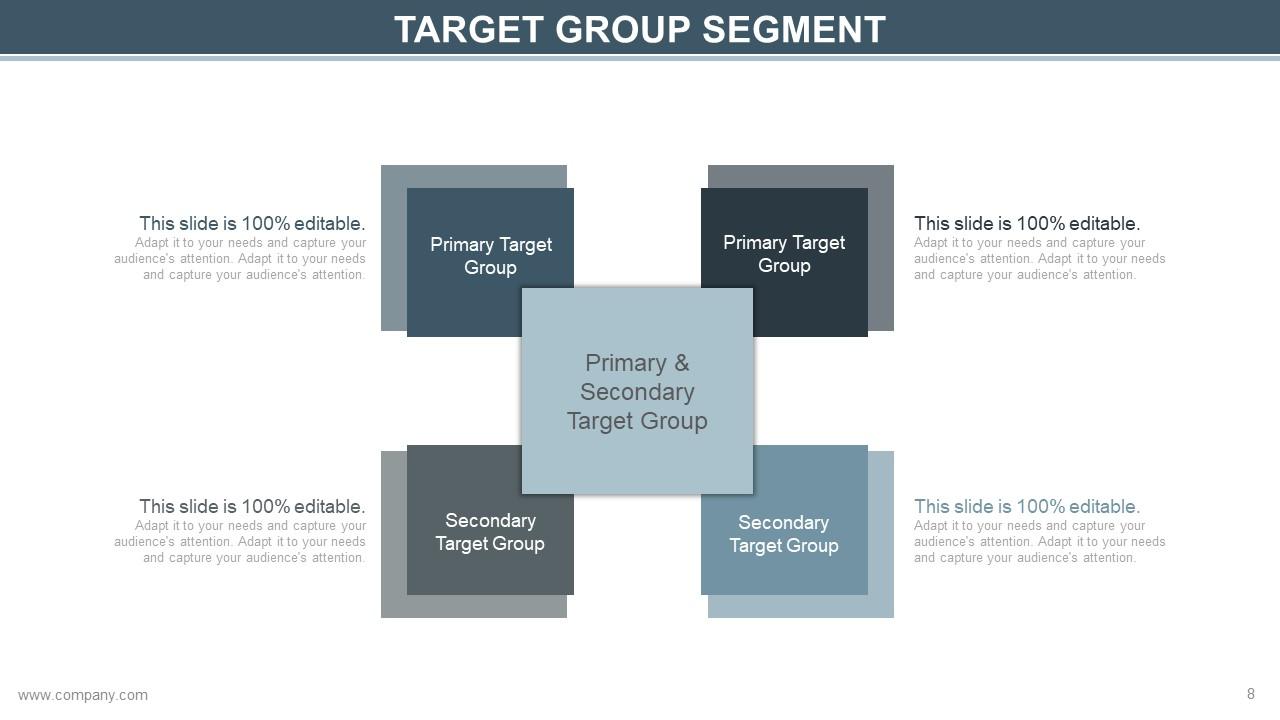
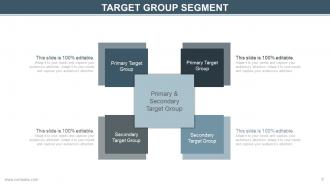
Slide 8: This slide shows Target Group Segment consisting of- Primary Target Group, Secondary Target Group.
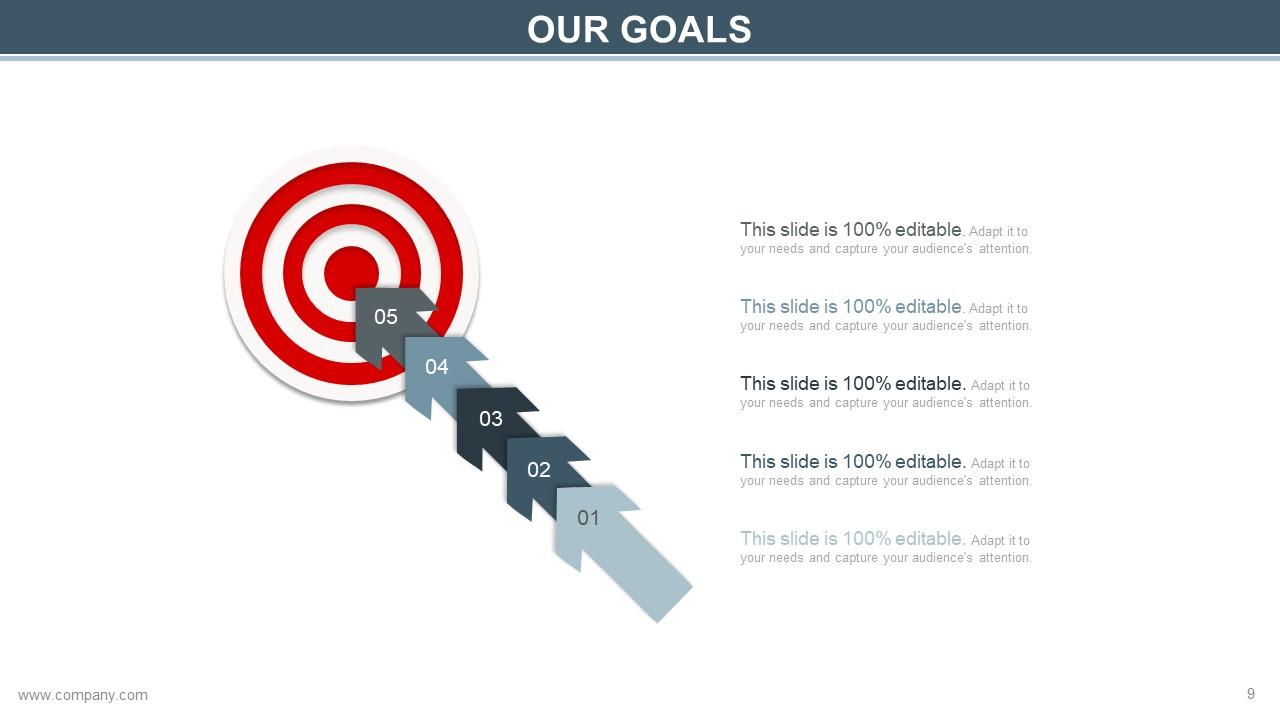
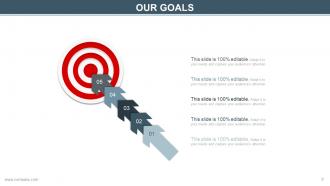
Slide 9: This is Our Goal slide. State your goals, aspirations here.
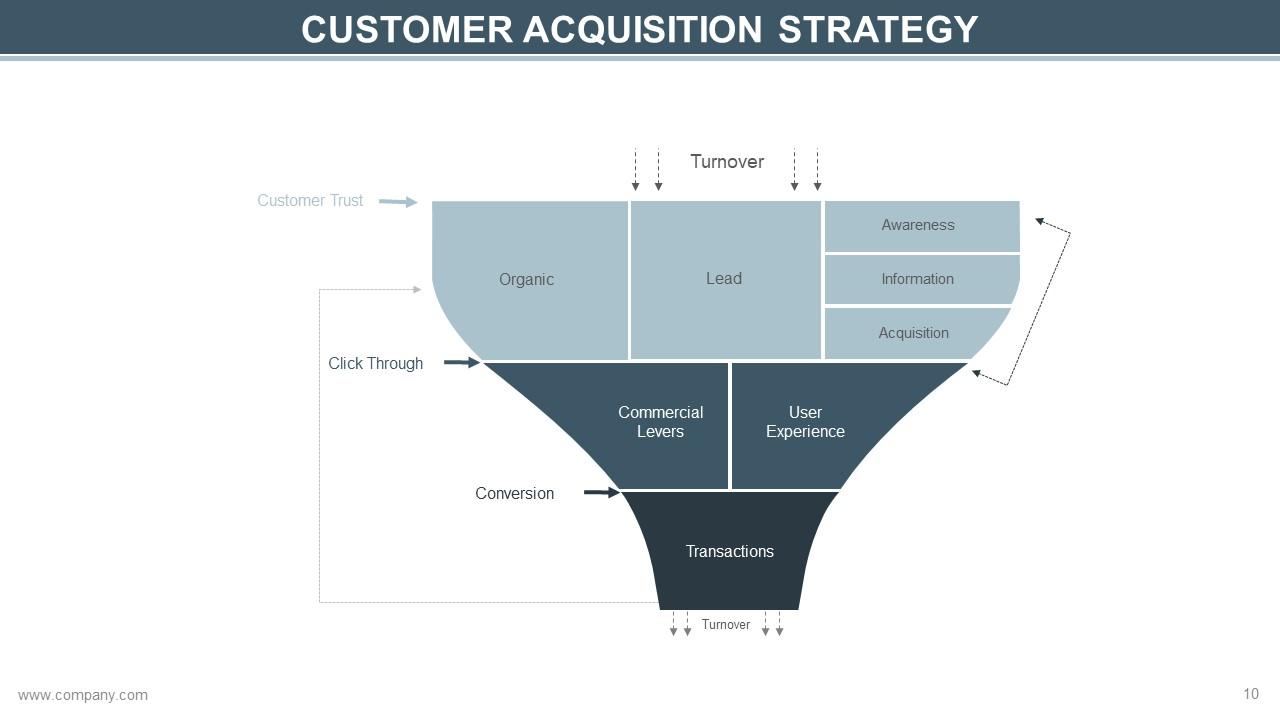
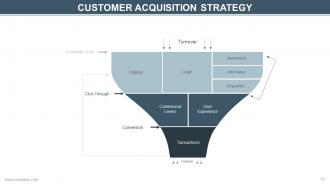
Slide 10: This slide shows Customer Acquisition Strategy funnel which consists of- Customer Trust, Click Through, Conversion, Organic, Lead, Awareness, Information, Acquisition, Commercial Levers, Transactions, User Experience, Turnover.
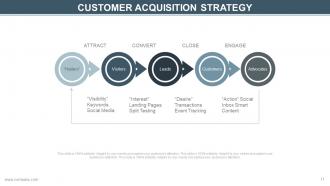
Slide 11: This slide also shows Customer Acquisition Strategy.
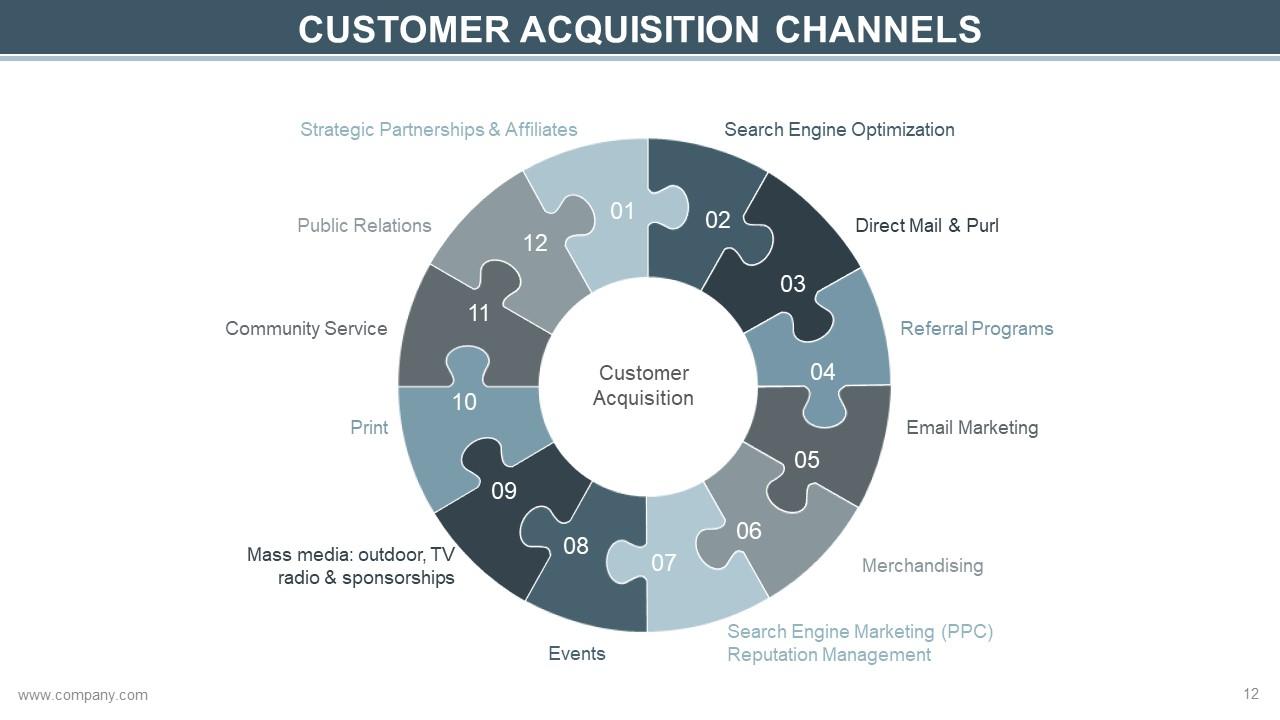
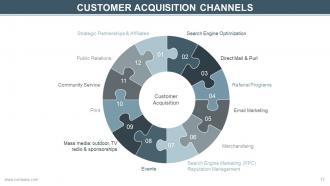
Slide 12: This slide shows Customer Acquisition Channels such as- Strategic Partnerships & Affiliates, Public Relations, Community Service, Print, Mass media: outdoor, TV radio & sponsorships, Events, Search Engine Marketing (PPC) Reputation Management, Merchandising, Email Marketing, Referral Programs, Direct Mail & Purl, Search Engine Optimization.
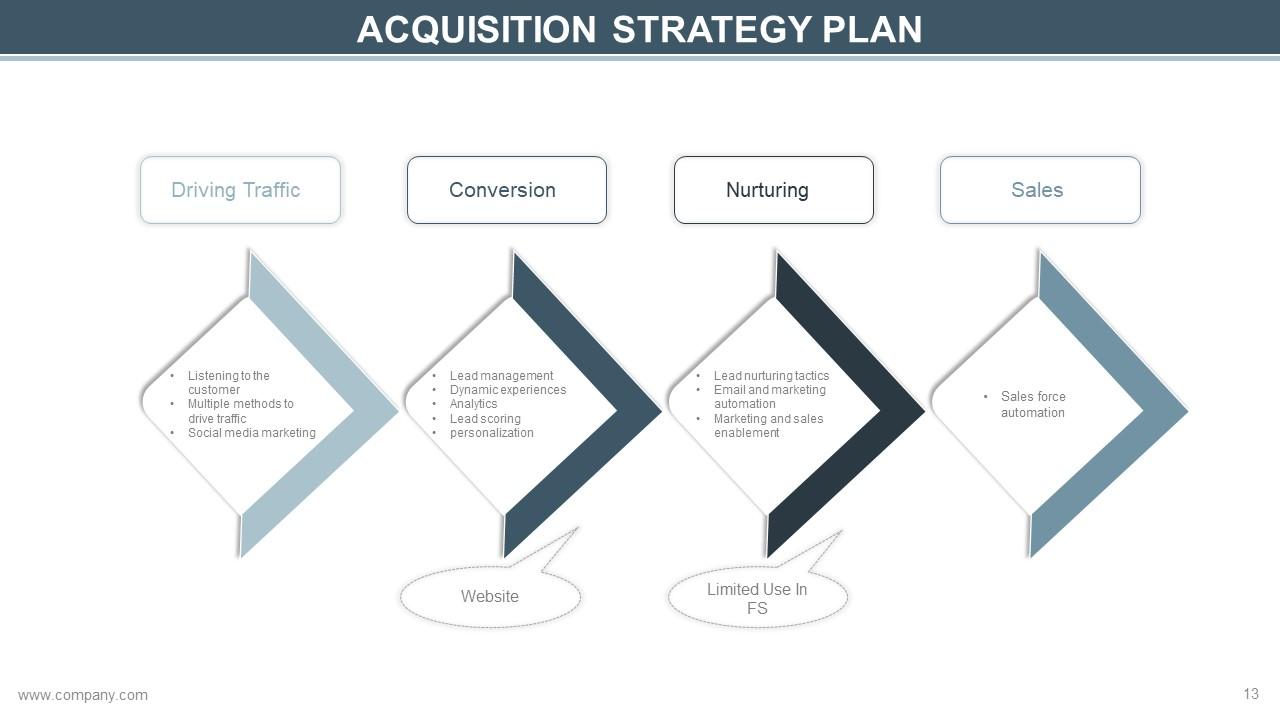
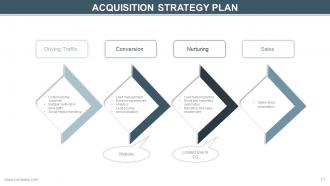
Slide 13: This slide shows Acquisition Strategy Plan with the following points- Driving Traffic, Conversion, Nurturing, Sales.
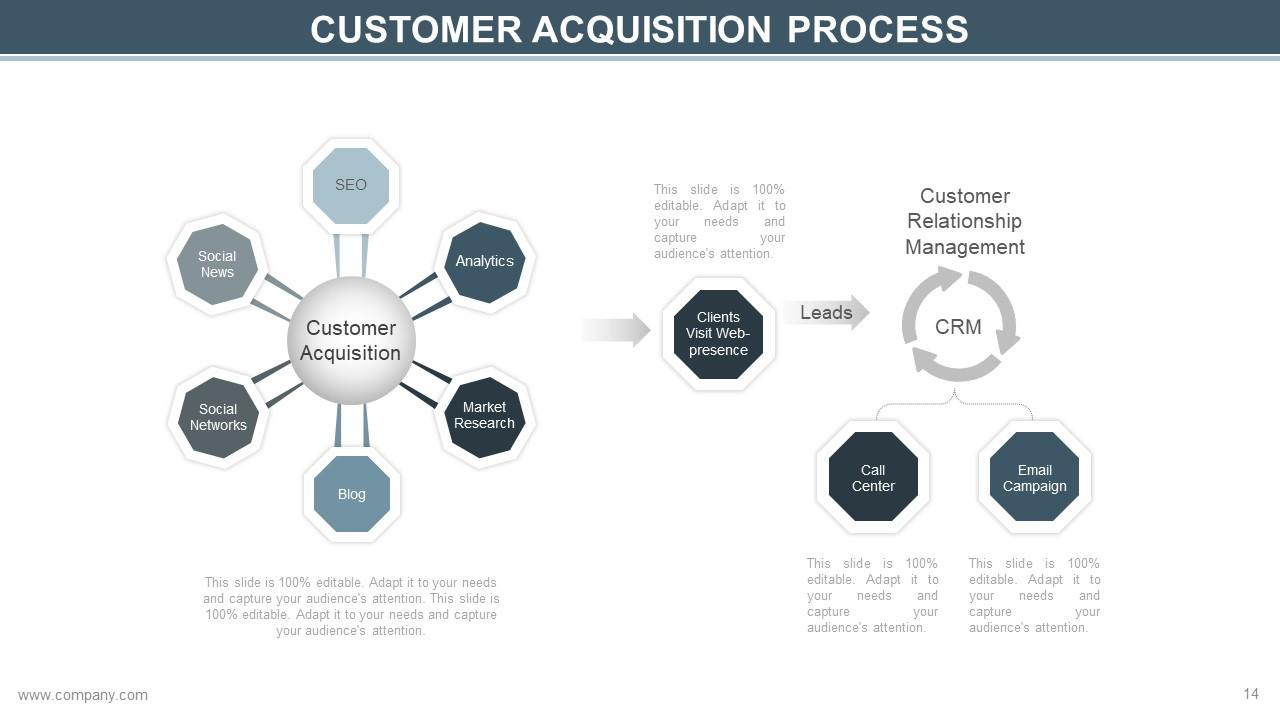
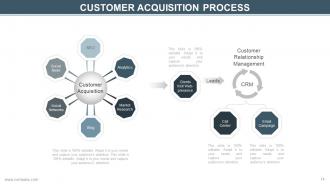
Slide 14: This slide shows Customer Acquisition Process with the following content- Clients Visit Web-presence, Leads, CRM, Customer Relationship Management, Call Center, Email Campaign, Social News, Blog, Social Networks, Analytics, SEO, Market Research, Customer Acquisition.
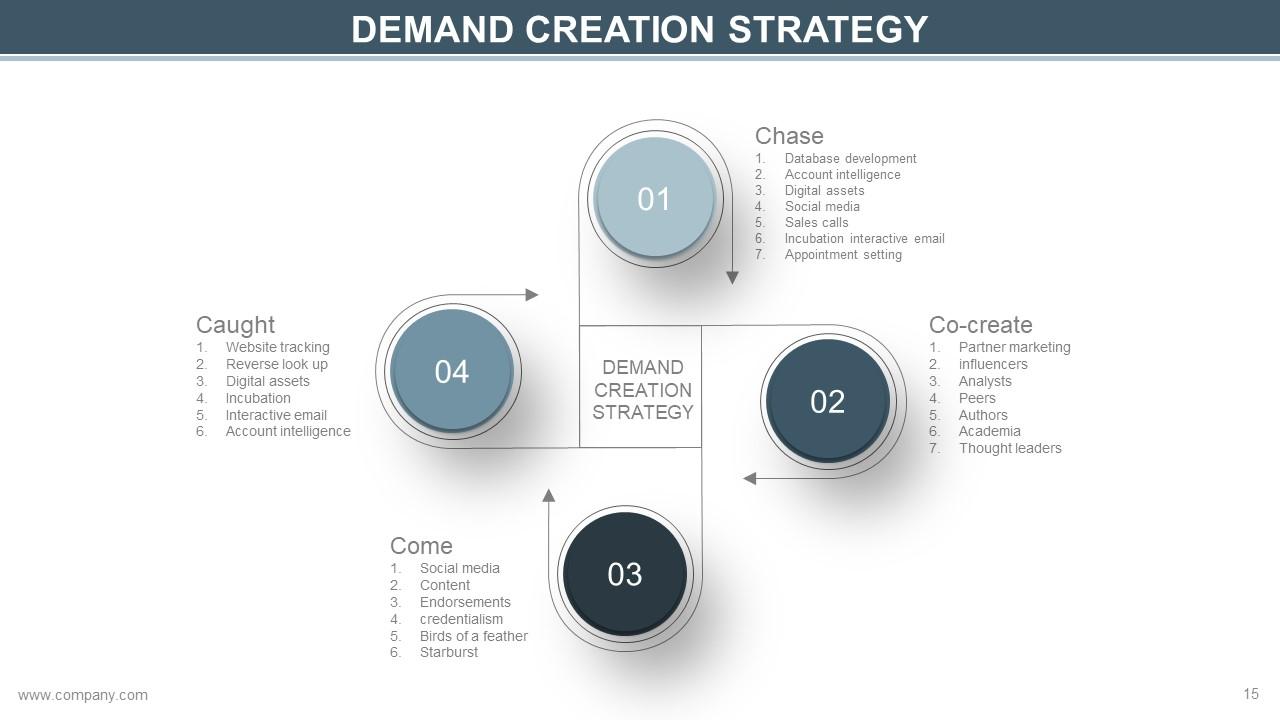
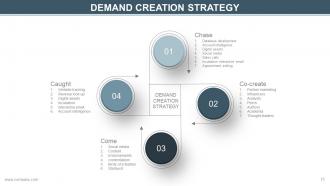
Slide 15: This slide shows Demand Creation Strategy divided into- Chase: Database development, Account intelligence, Digital assets, Social media, Sales calls, Incubation interactive email, Appointment setting. Come: Social media, Content, Endorsements, credentialism, Birds of a feather, Starburst. Co-create: Partner marketing, influencers, Analysts, Peers, Authors, Academia, Thought leaders. Caught: Website tracking, Reverse look up, Digital assets, Incubation, Interactive email, Account intelligence.
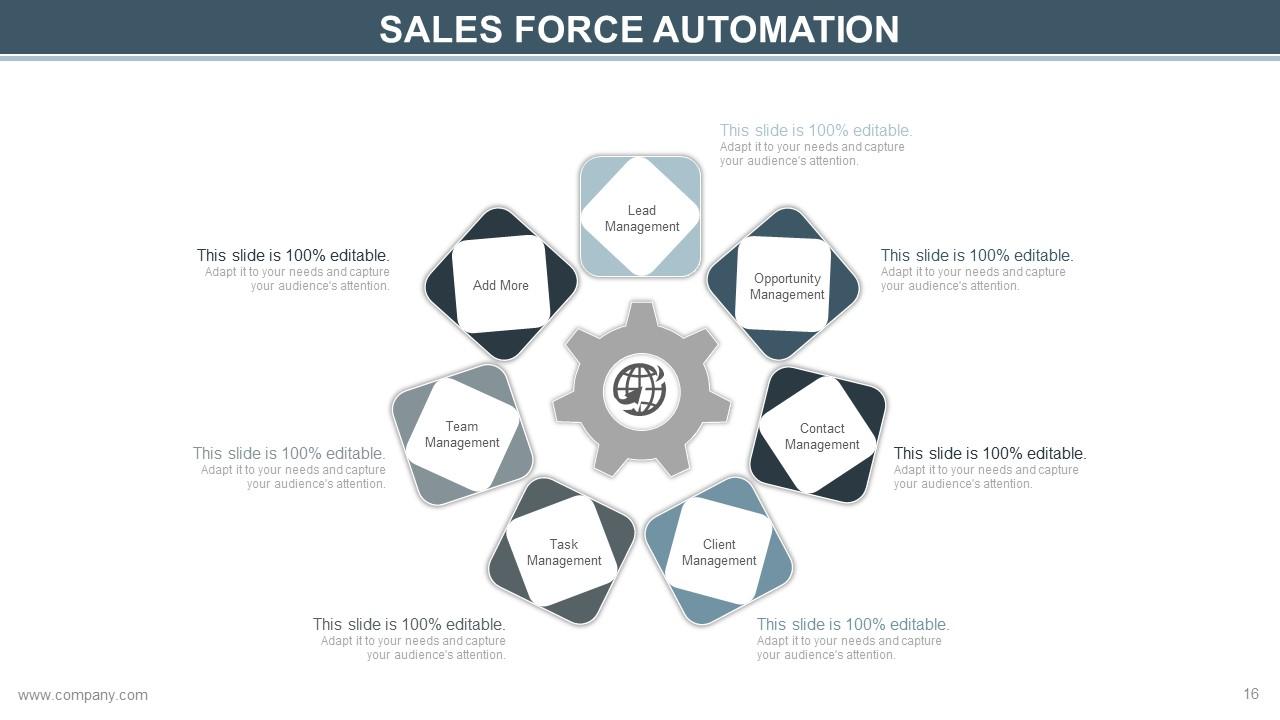
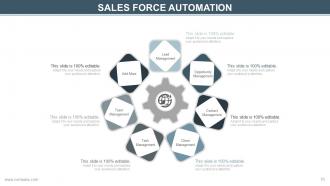
Slide 16: This is Sales Force Automation slide showing- Task Management, Client Management, Team Management, Contact Management ,Add More,Opportunity Management, Lead Management.
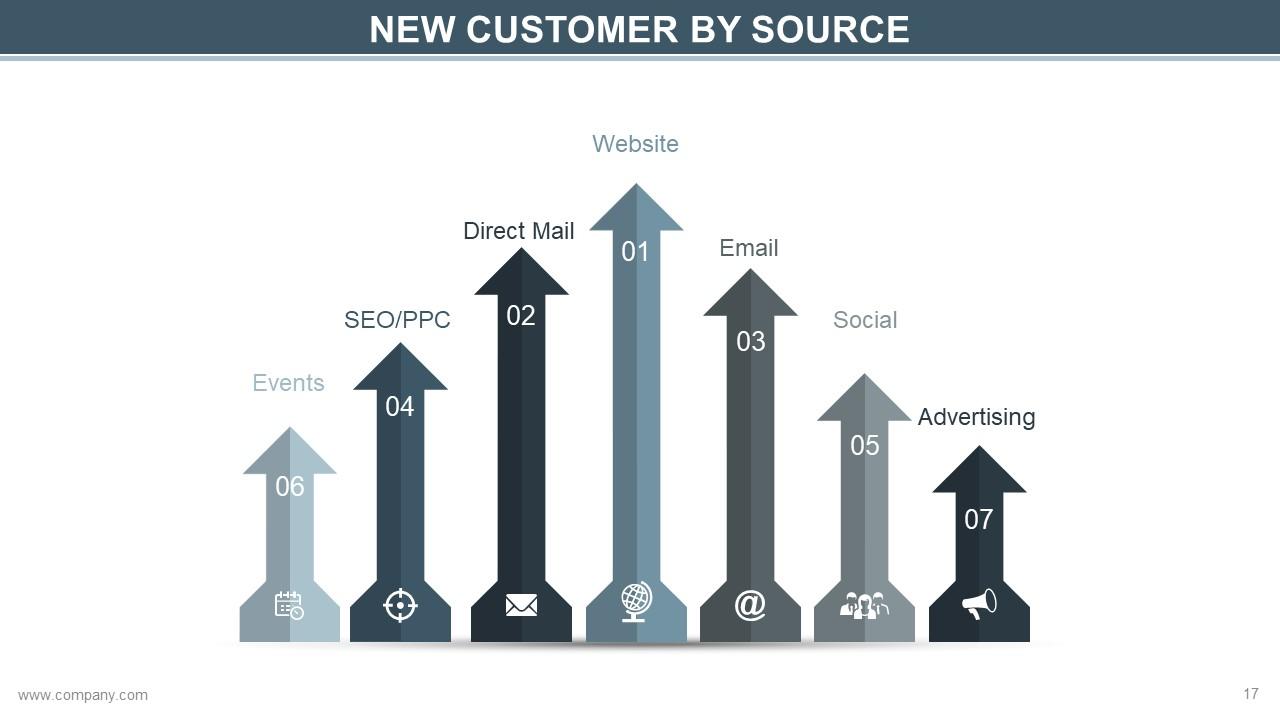
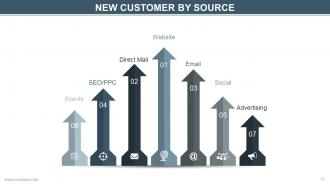
Slide 17: This slide shows New Customer By Source such as that from- Events, SEO/PPC, Direct Mail, Website, Email, Social, Advertising.
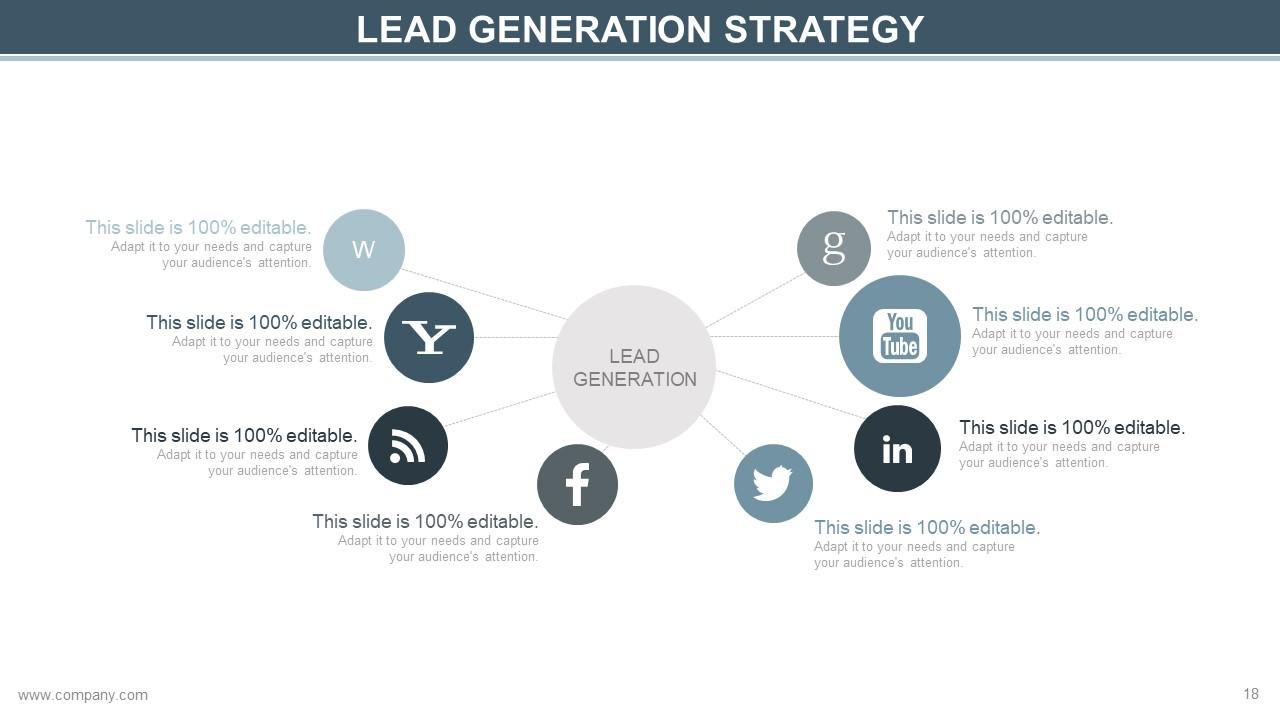
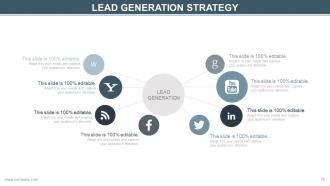
Slide 18: This slide shows Lead Generation Strategy. We have identified 5 key strategies for generating leads which you can alter as per your business need.
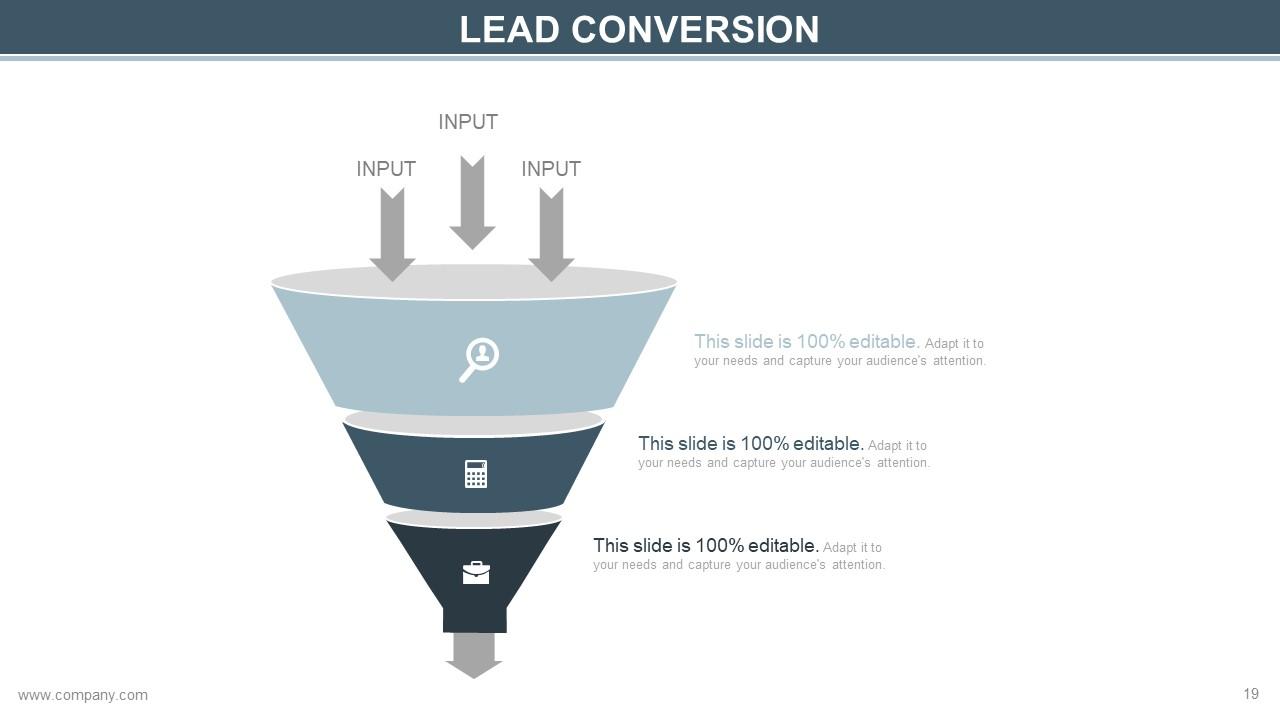
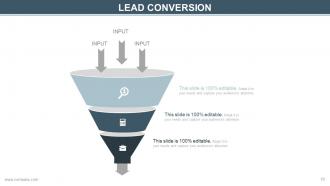
Slide 19: This slide shows Lead Conversion diagram.
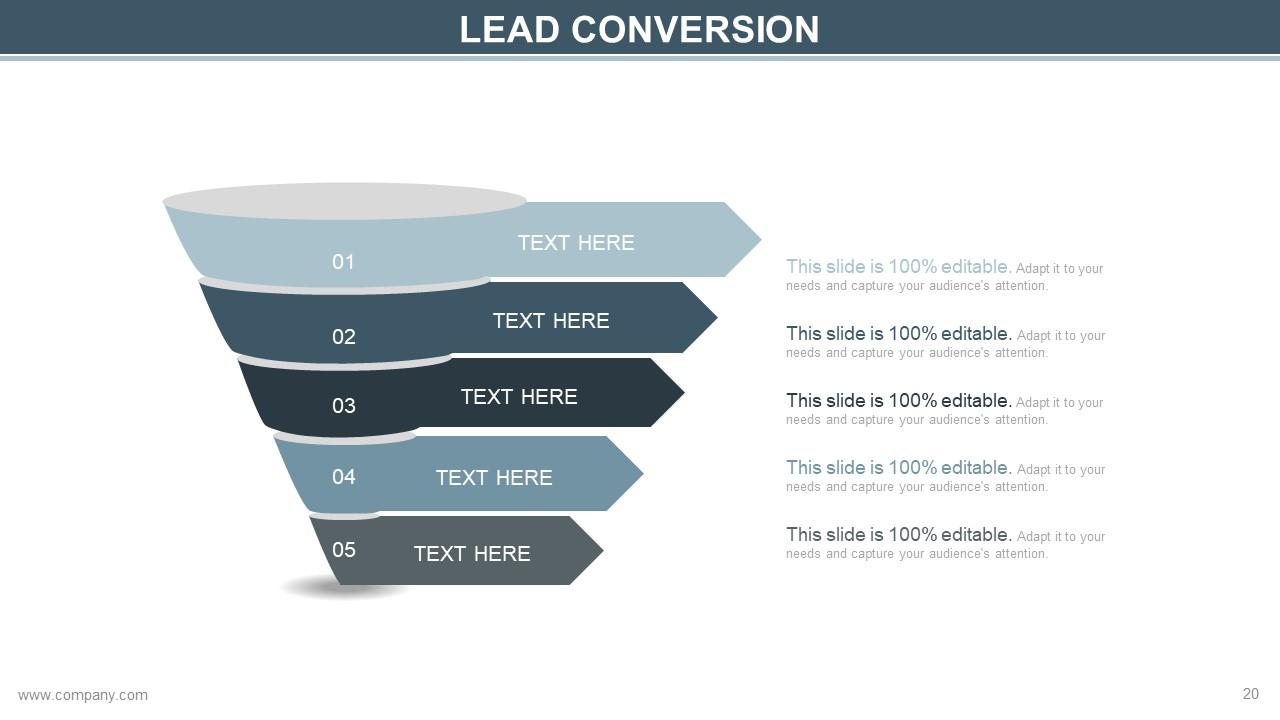
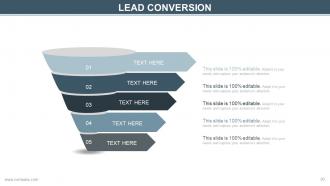
Slide 20: This slide also shows Lead Conversion diagram with text boxes.
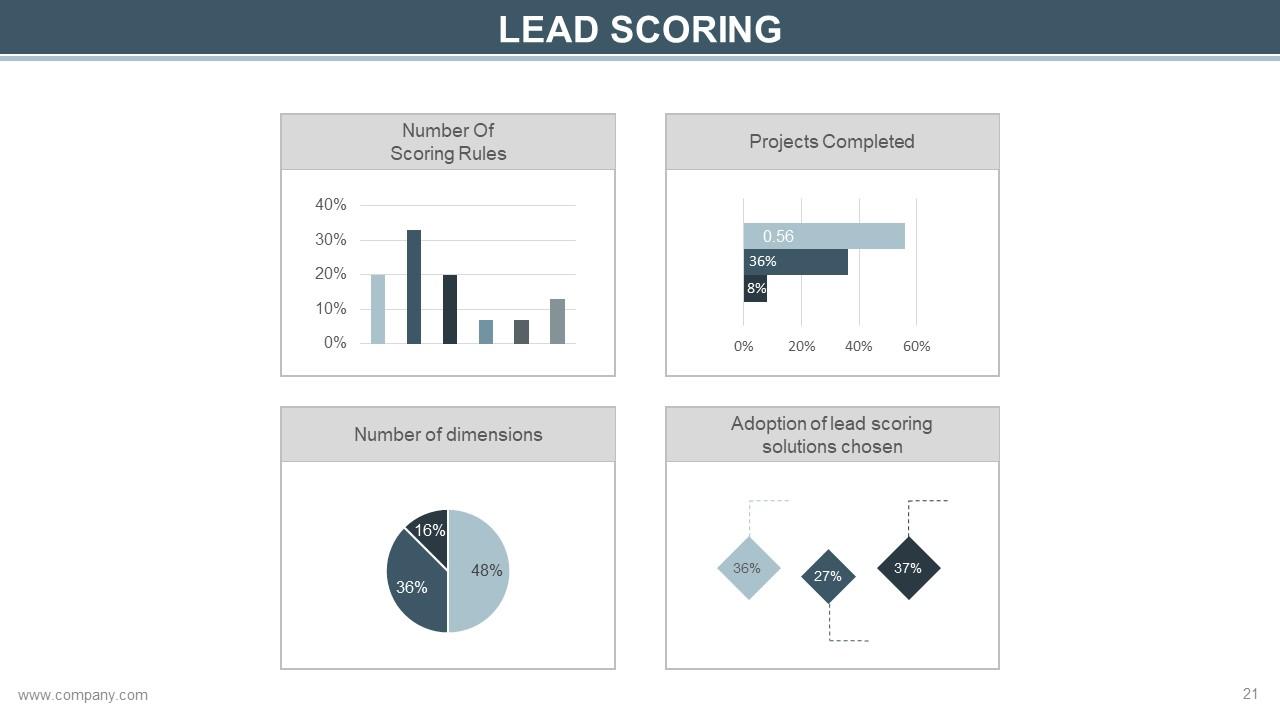
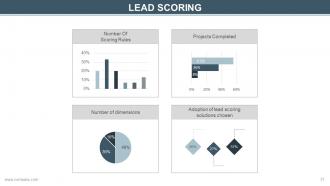
Slide 21: This slide shows Lead Scoring charts and graphs.
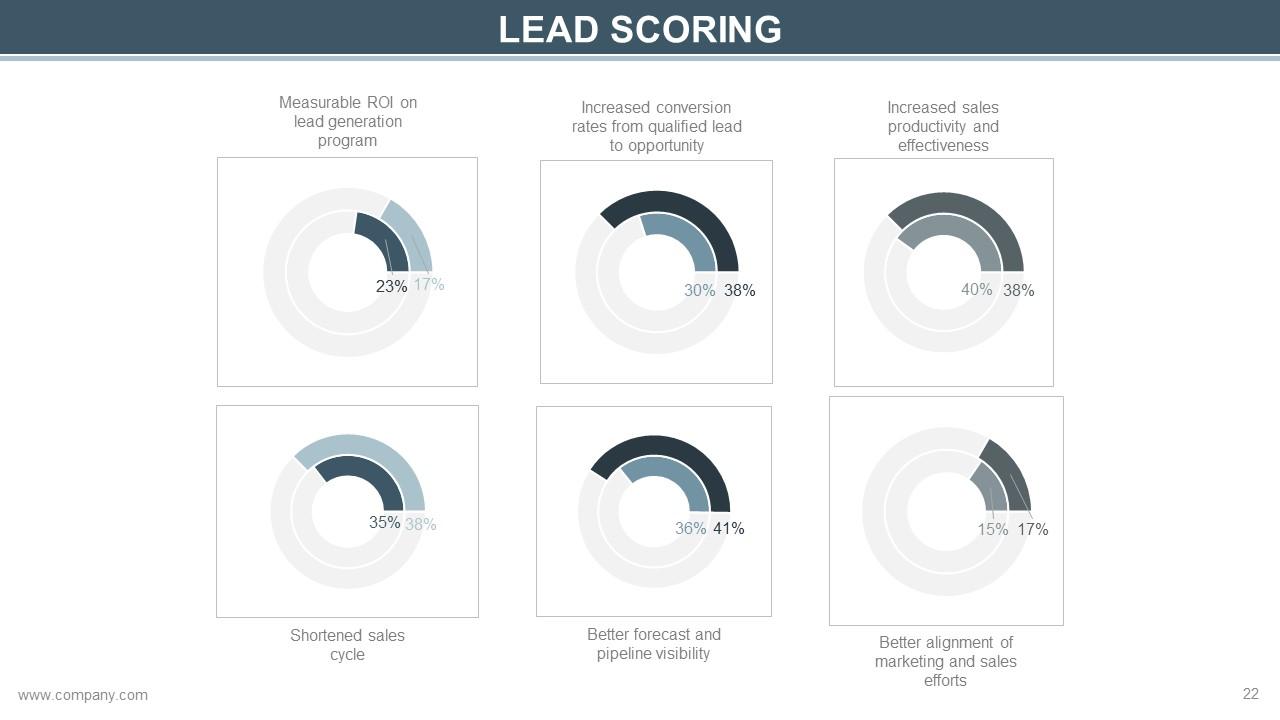
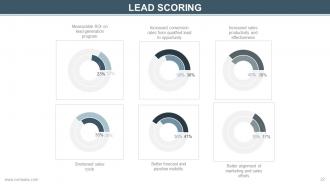
Slide 22: This slide also shows Lead Scoring.
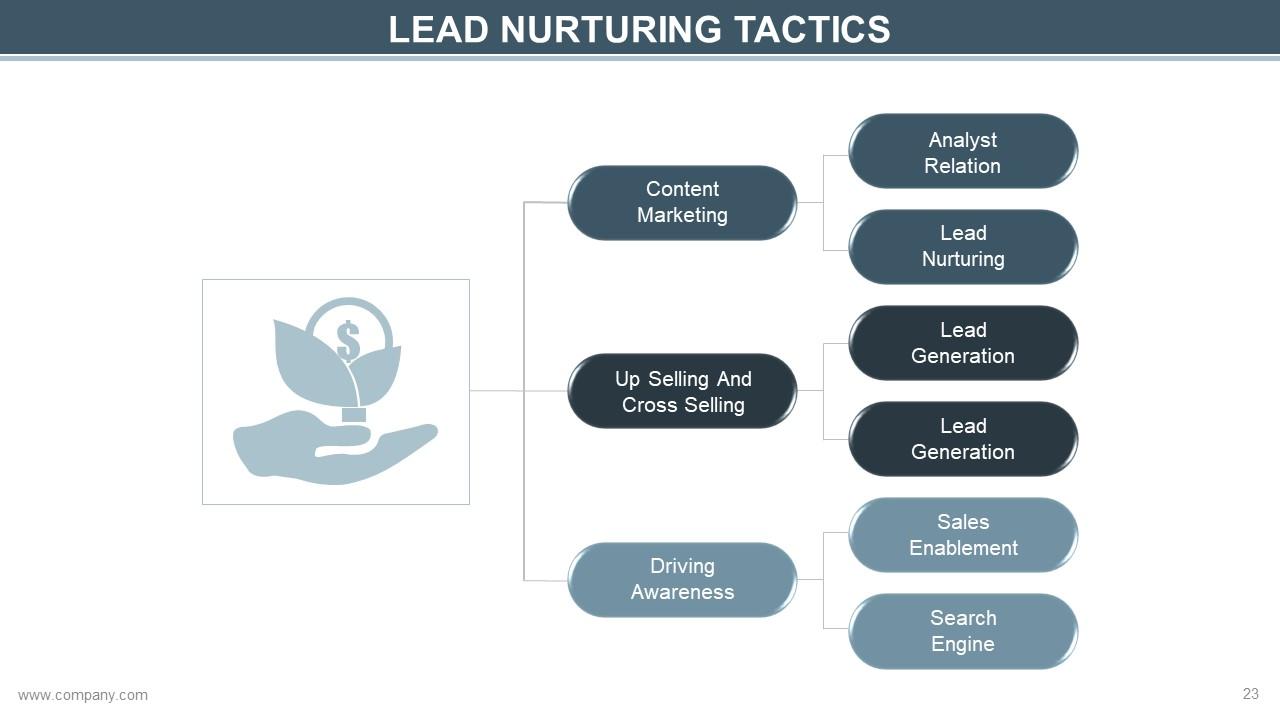
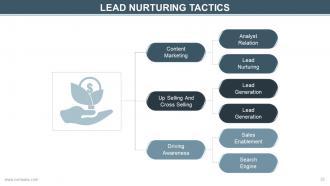
Slide 23: This slide shows Lead Nurturing Tacics- Content Marketing, Up Selling And Cross Selling, Driving Awareness, Analyst Relation, Lead Nurturing, Lead Generation, Lead Generation, Search Engine, Sales Enablement.
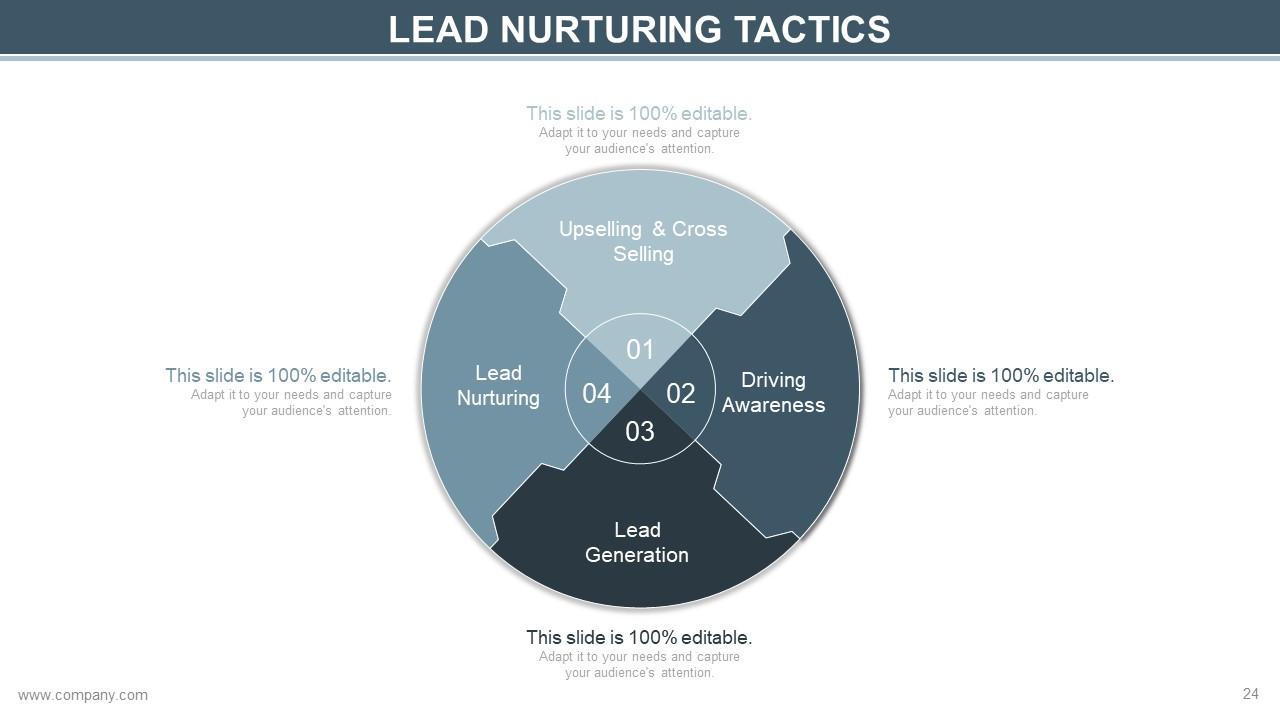
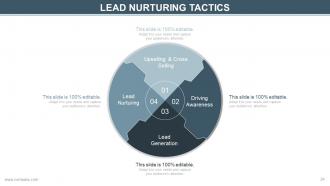
Slide 24: This slide also shows Lead Nurturing Tacics- Driving Awareness, Lead Generation, Lead Nurturing, Upselling & Cross Selling.
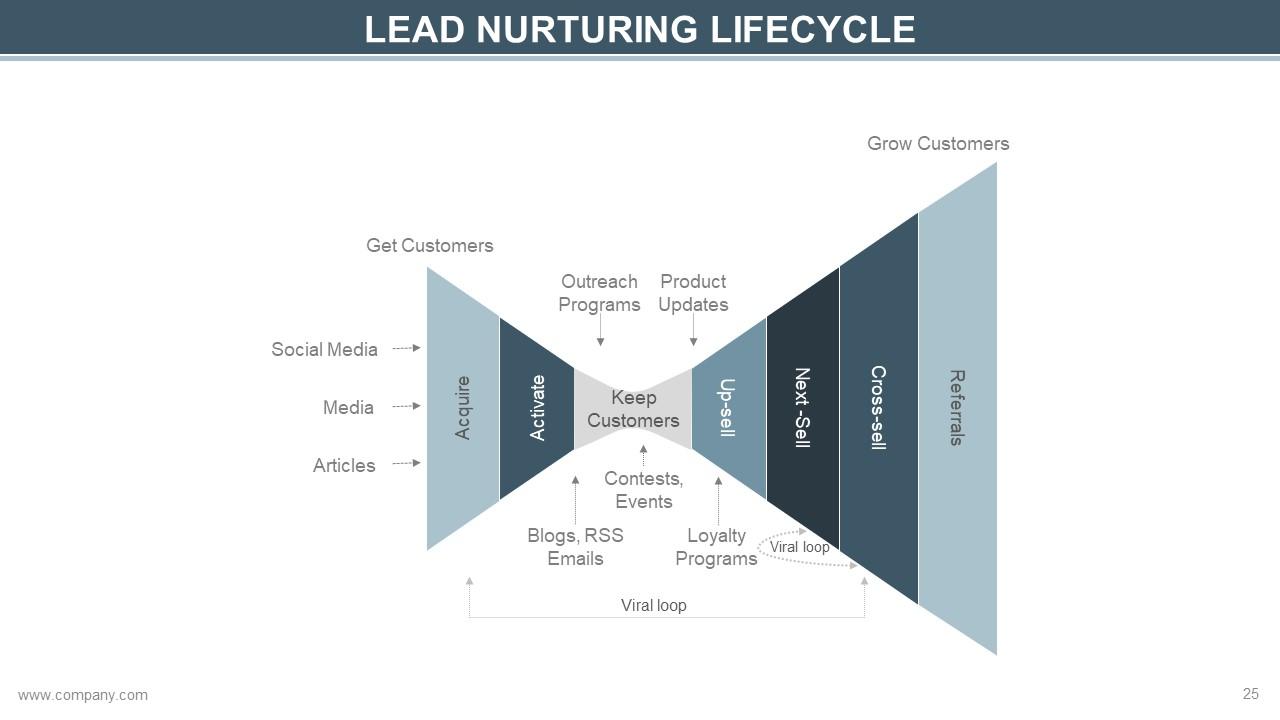
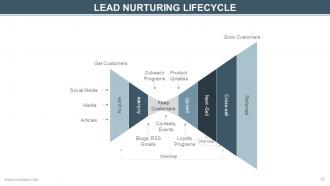
Slide 25: This slide shows a Lead Nurturing Lifecycle with the following content- Viral loop, Acquire, Activate, Keep Customers, Up-sell, Next -Sell, Referrals, Cross-sell, Contests, Events, Blogs, RSS Emails, Loyalty Programs, Outreach Programs, Product Updates, Get Customers, Grow Customers, Social Media, Media, Articles.
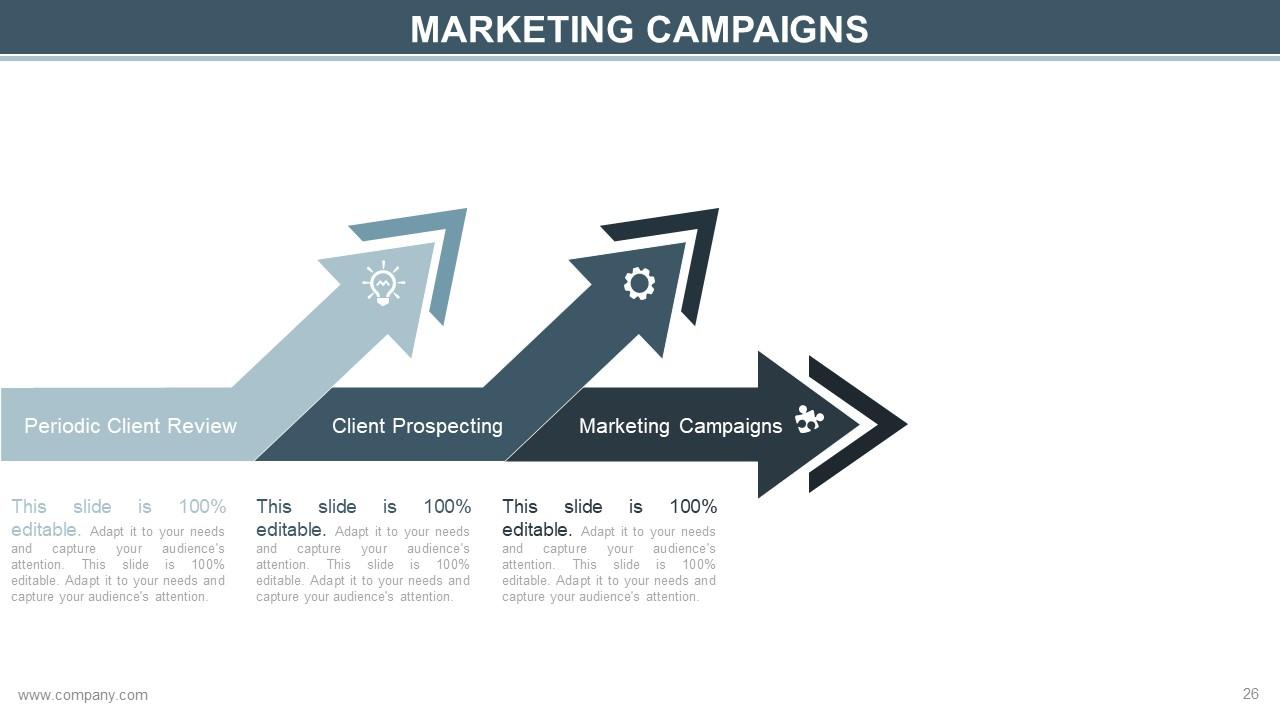
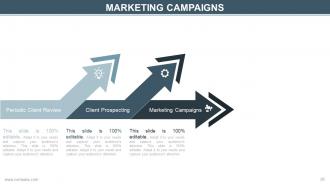
Slide 26: This slide presents Marketing Campaigns with- Periodic Client Review, Client Prospecting.
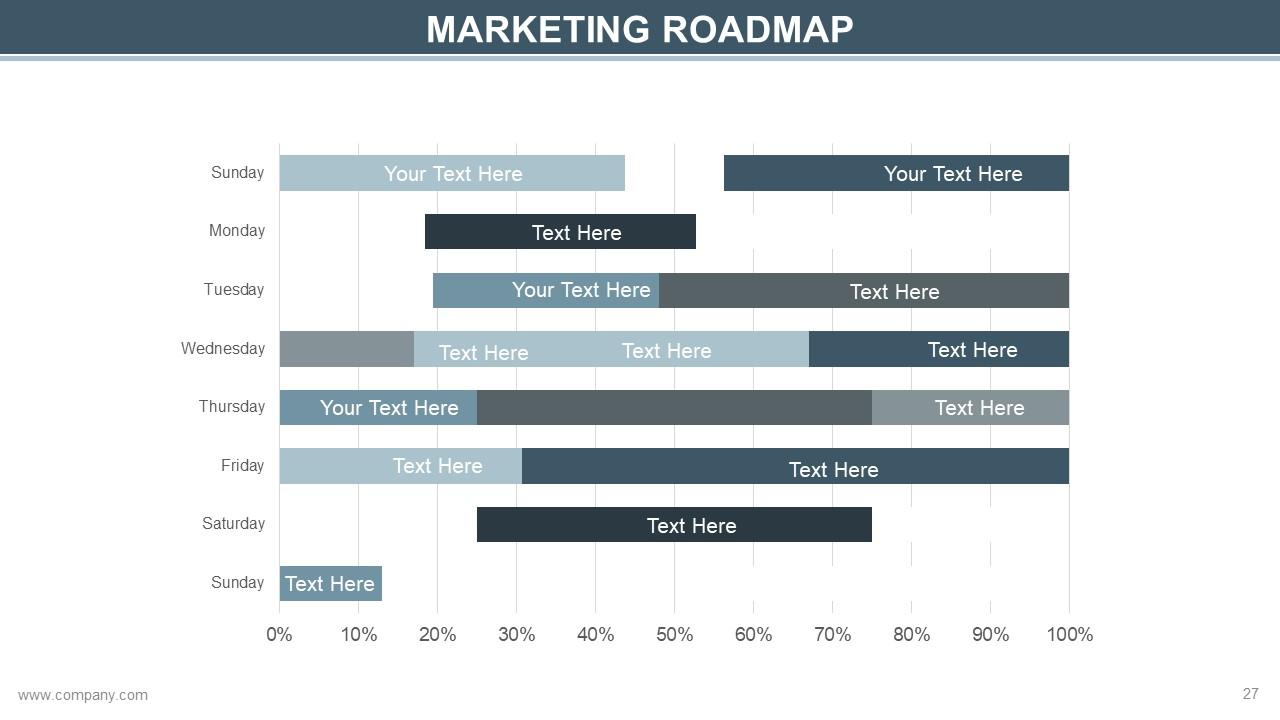
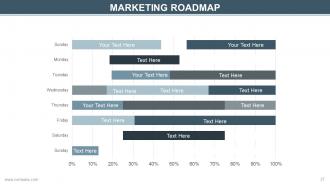
Slide 27: This slide presents a Marketing Roadmap to fill as per requirement.
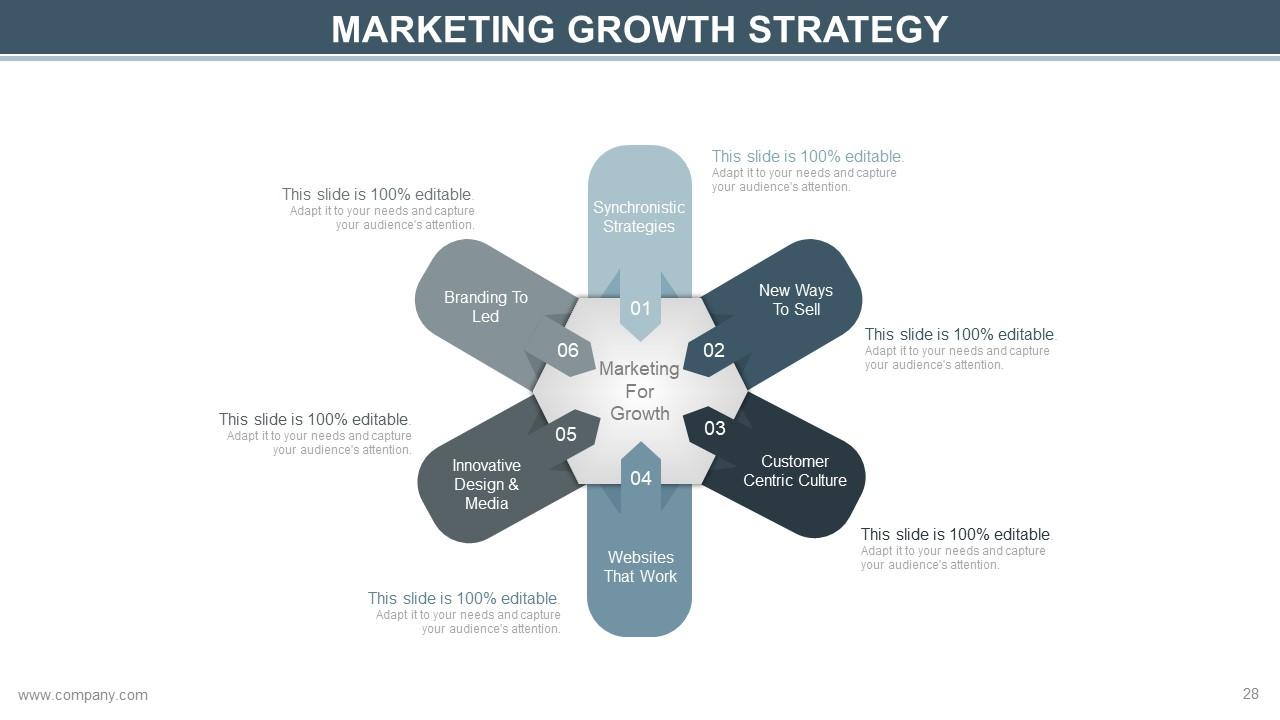
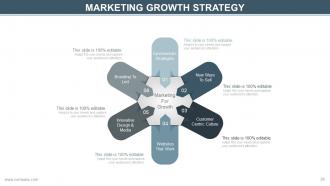
Slide 28: This slide shows Marketing Growth Strategy with the following points- Branding To Led, Innovative Design & Media, Websites That Work, Customer Centric Culture, New Ways To Sell, Synchronistic Strategies, Marketing For Growth.
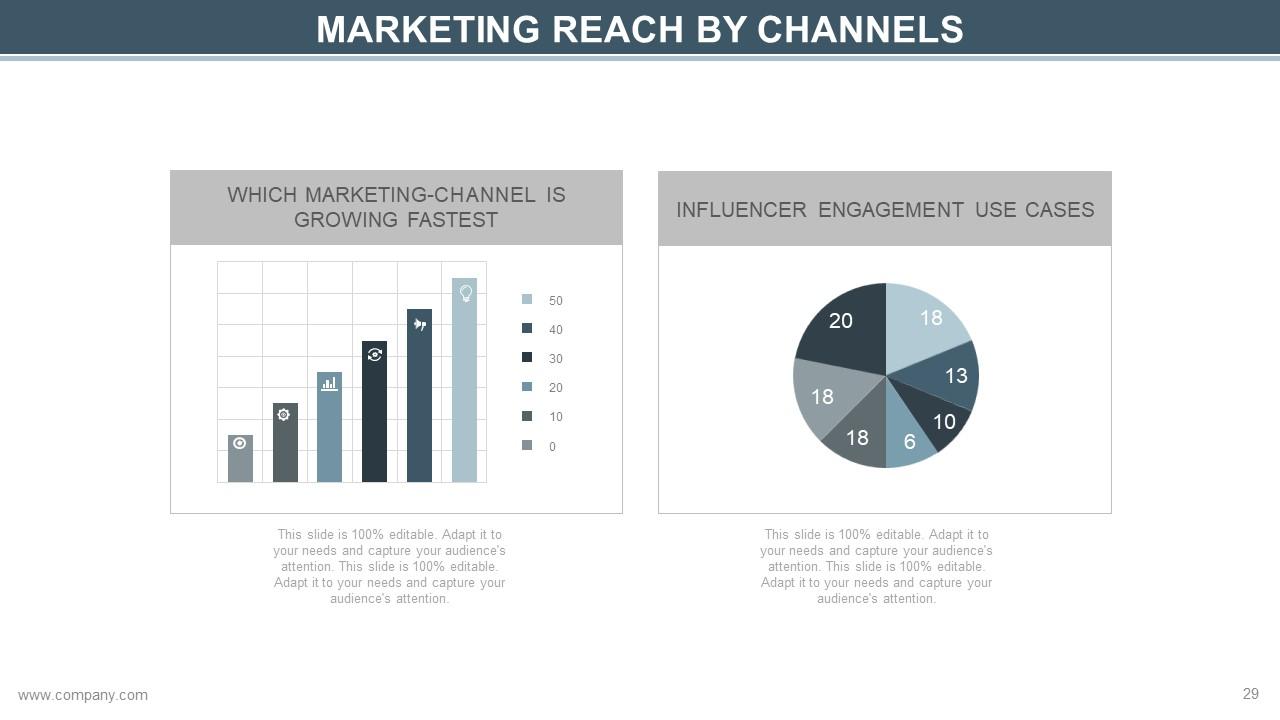
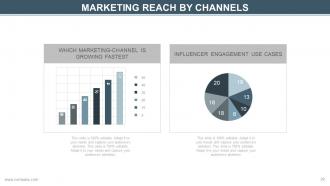
Slide 29: This slide shows Marketing Reach by Channels- Which Marketing-channel Is Growing Fastest, Influencer Engagement Use Cases.
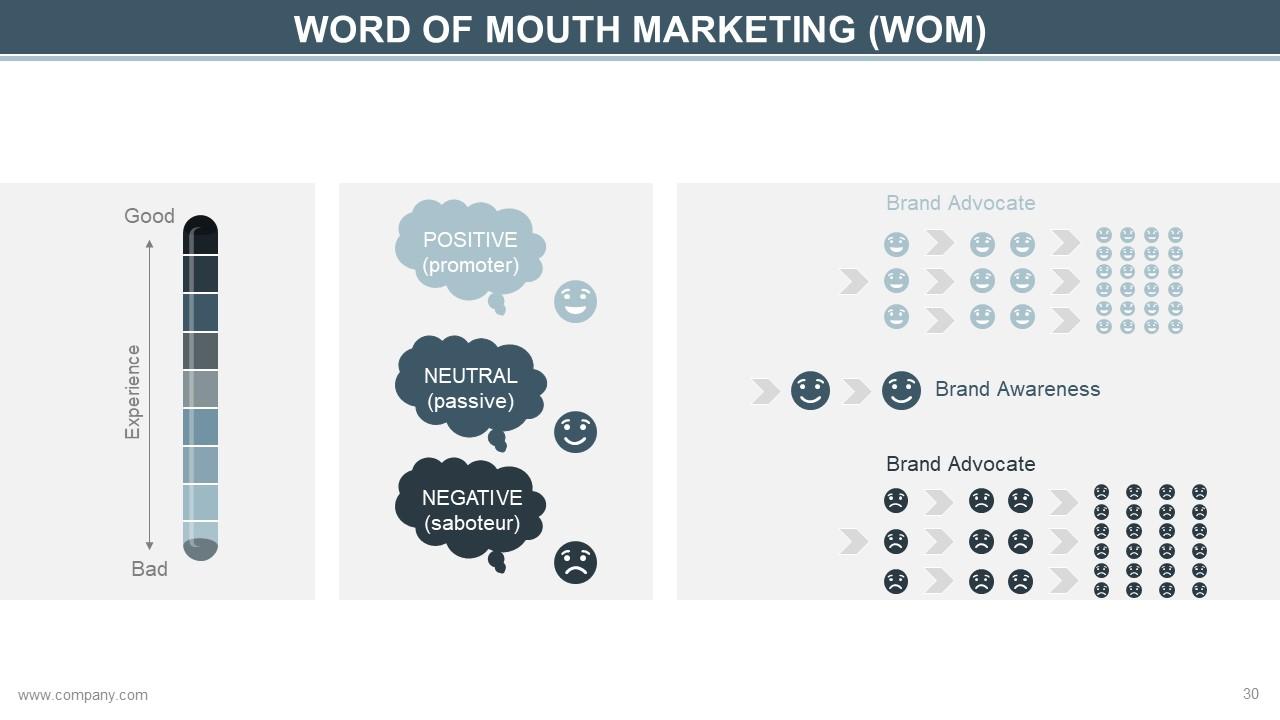
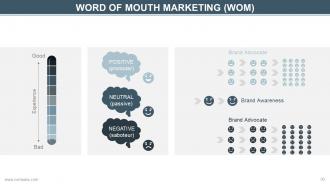
Slide 30: This slide presents Word Of Mouth Marketing with Good and Bad parameters.
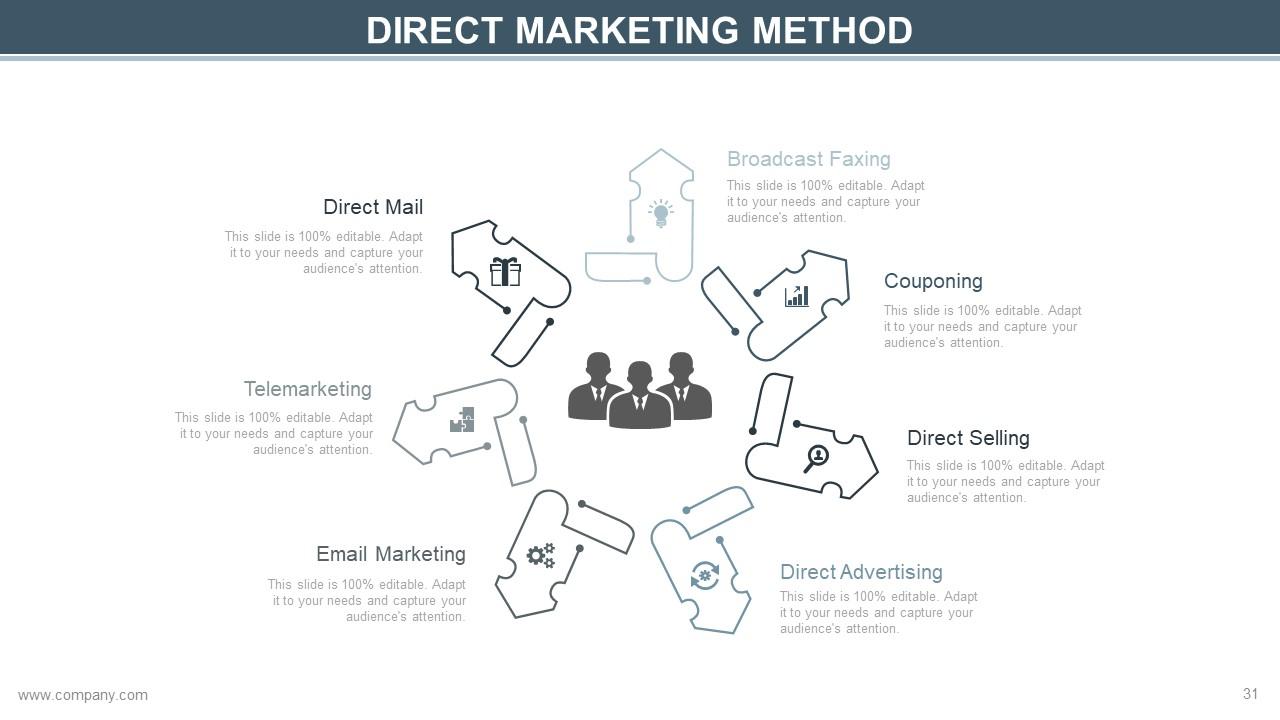
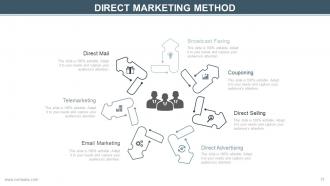
Slide 31: This slide shows Direct Marketing Method with the following points- Broadcast Faxing, Couponing, Direct Mail, Direct Selling, Telemarketing, Email Marketing, Direct Advertising.
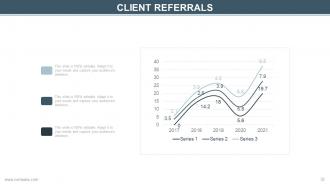
Slide 32: This slide presents Client Referrals in a graphical form.
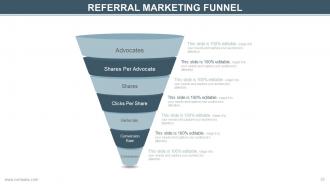
Slide 33: This is Referral Marketing Funnel slide showing- Advocates, Shares Per Advocate, Shares, Clicks Per Share, Referrals, Conversion Rate, Conversions.
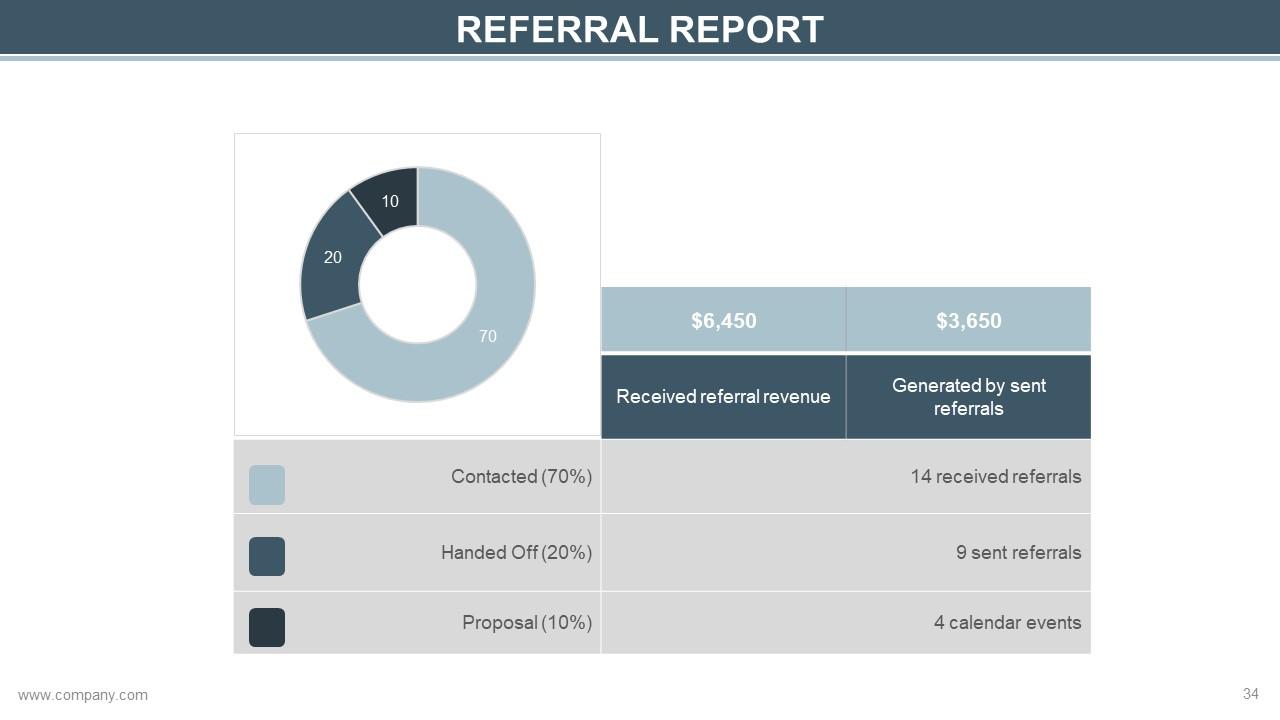
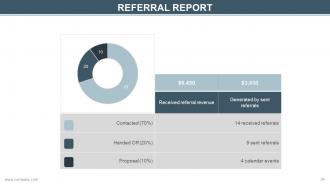
Slide 34: This slide displays Referral Report.
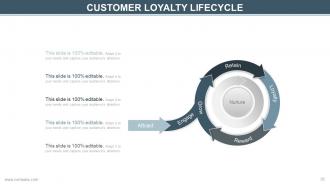
Slide 35: This slide shows Customer Loyalty Lifecycle with the following stages- Attract, Engage, Grow, Retain, Loyalty, Reward, Nurture.
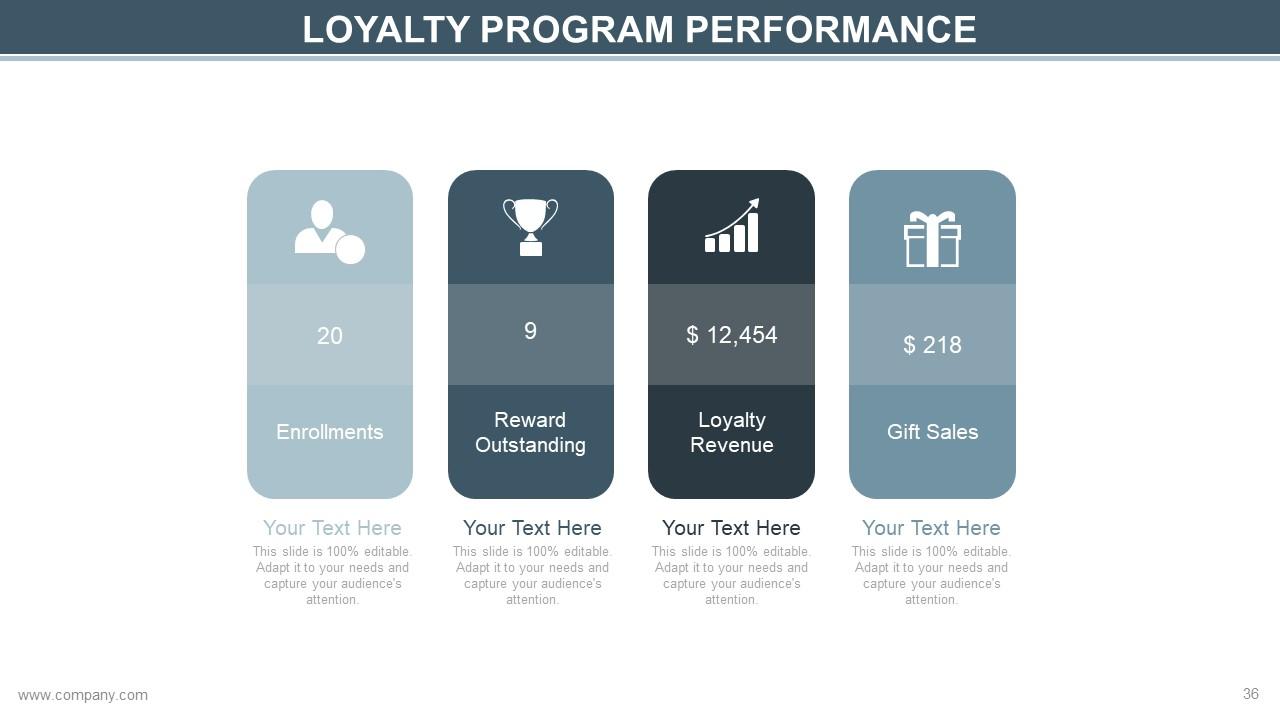
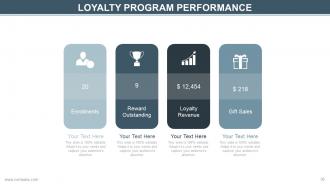
Slide 36: This slide shows Loyalty Program Performance with the following points- Enrollments Icon, Reward Outstanding, Loyalty Revenue, Gift Sales.
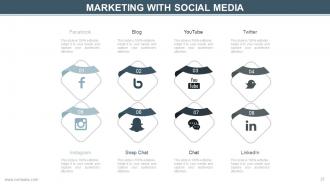
Slide 37: This slide shows Marketing With Social Media with their respective icons. Present social media aspects/ planning here.
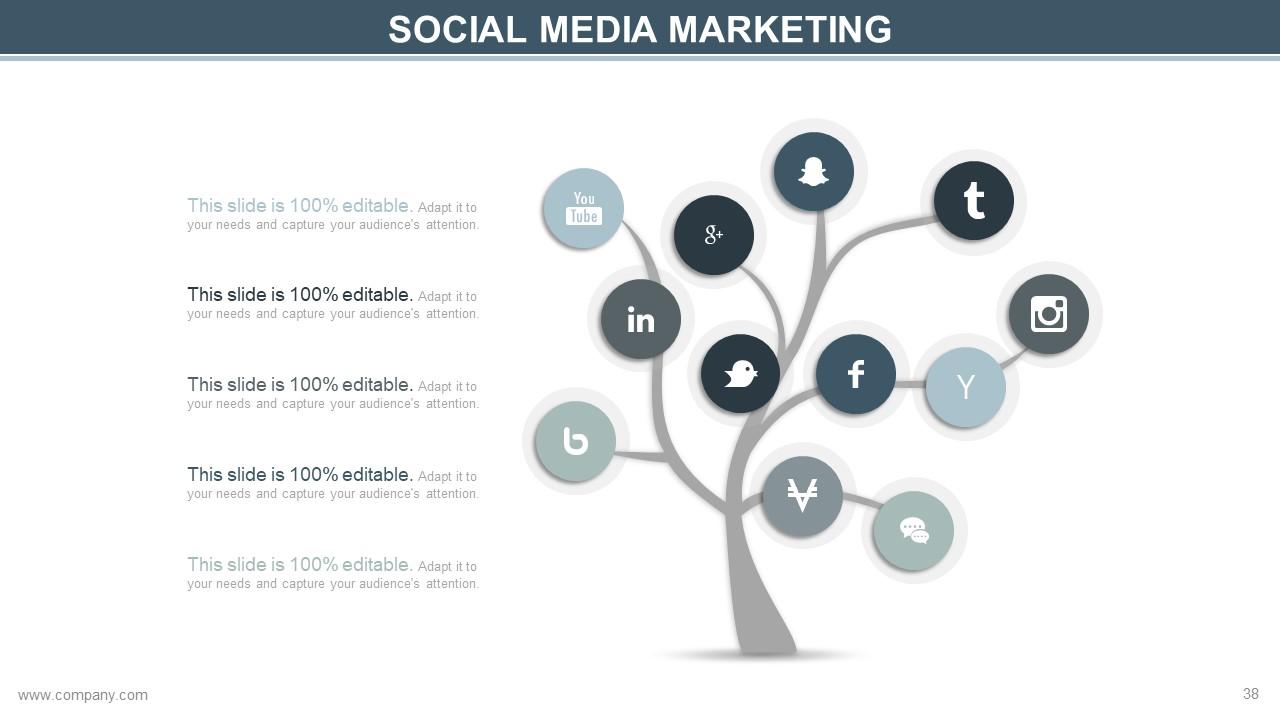
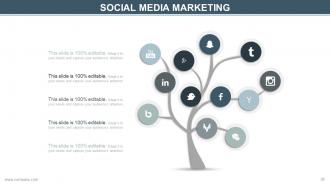
Slide 38: This slide also shows Social Media Marketing with a creative tree imagery. This tree has icons of some poplular social media sites which you can alter.
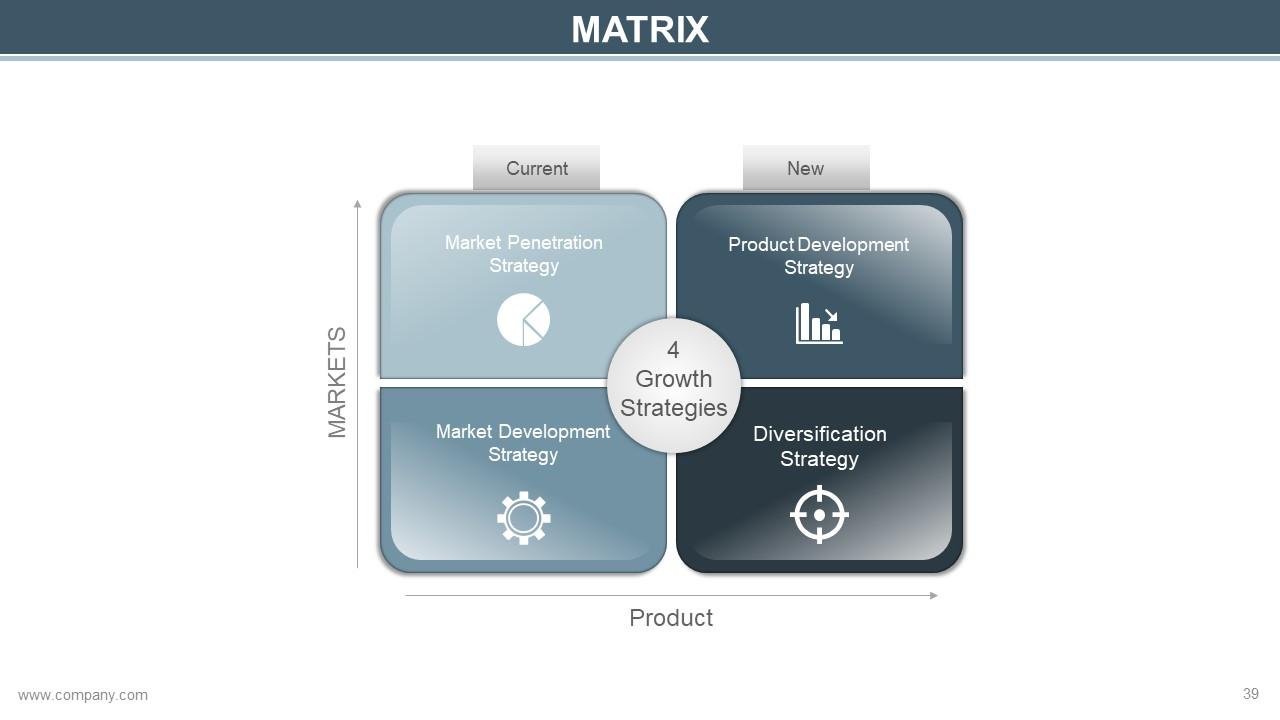
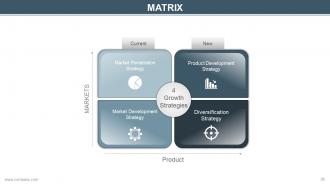
Slide 39: This is a Matrix slide showing 4 Growth Strategies- Market Penetration Strategy, Product Development Strategy, Market Development Strategy, Diversification Strategy.
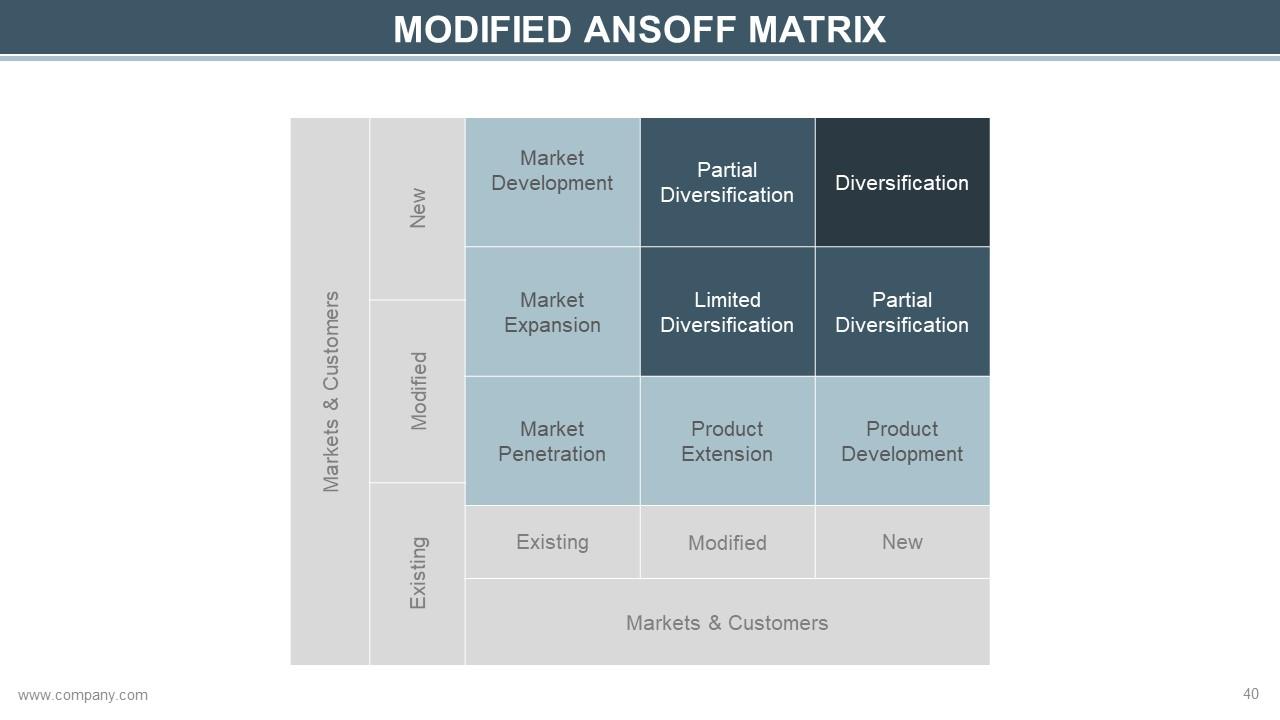
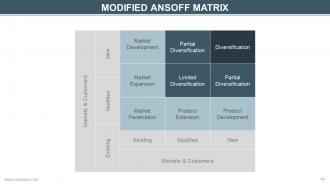
Slide 40: This slide shows Modified Ansoff Matrix.
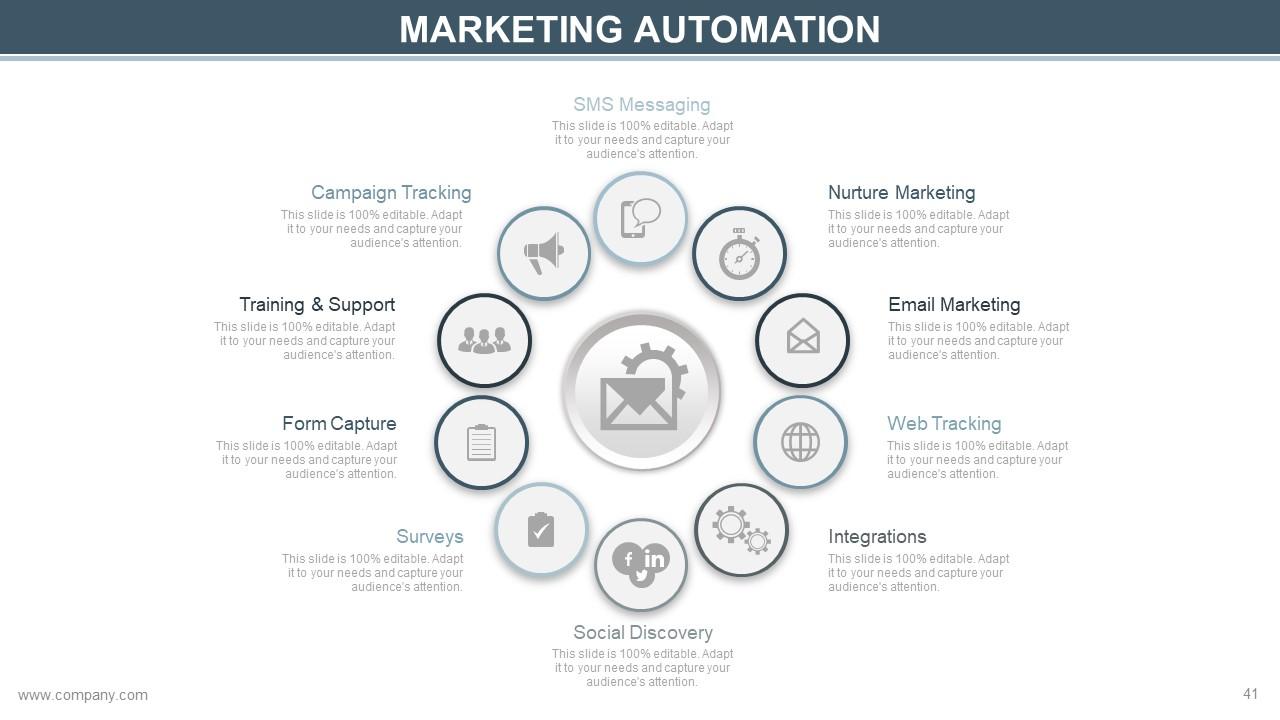
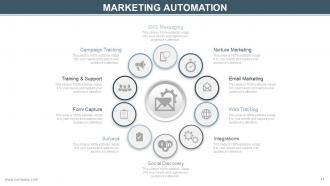
Slide 41: This is Marketing Automation slide with the following points- SMS Messaging, Nurture Marketing, Email Marketing, Web Tracking, Integrations, Social Discovery, Surveys, Form Capture, Training & Support, Campaign Tracking.
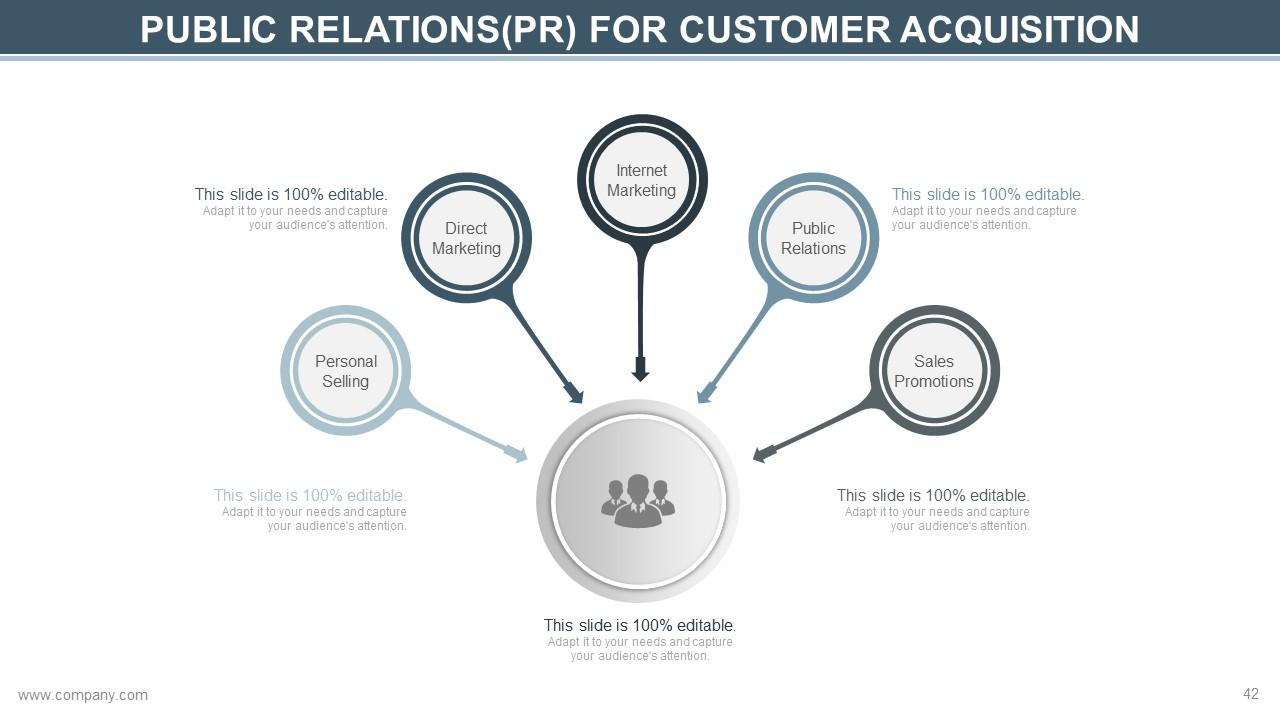
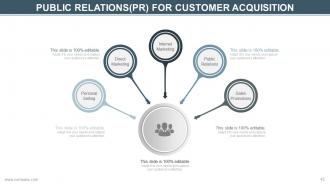
Slide 42: This slide shows Public Relations (PR) For Customer Acquisition involving- Personal Selling, Direct Marketing, Internet Marketing, Public Relations, Sales Promotions.
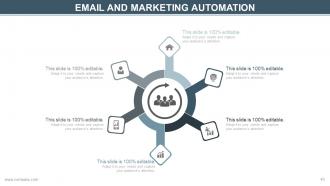
Slide 43: This is an Email and Marketing Automation slide. Present relative aspects here.
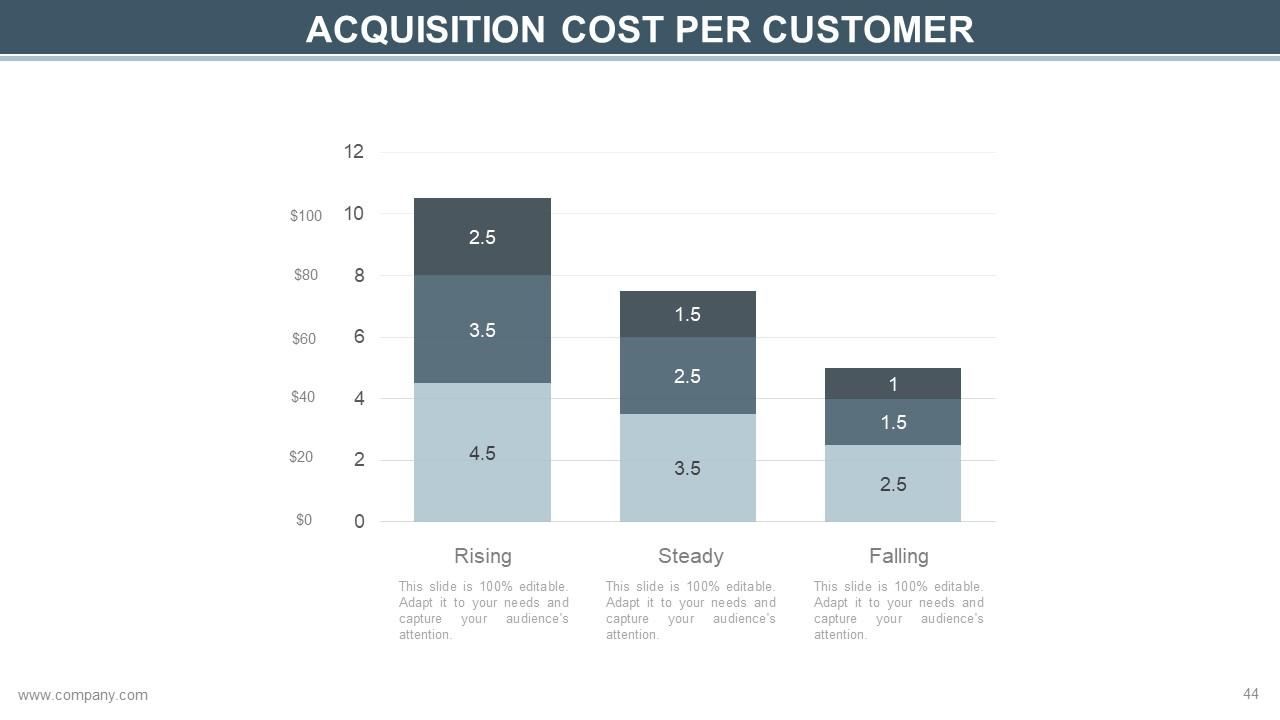
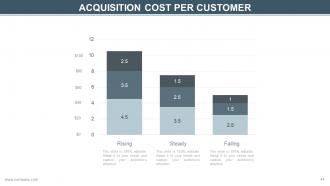
Slide 44: This slide displays a graph showing Acquisition Cost Per Customer. You can show Rising, Steady and Falling aspects in this graph.
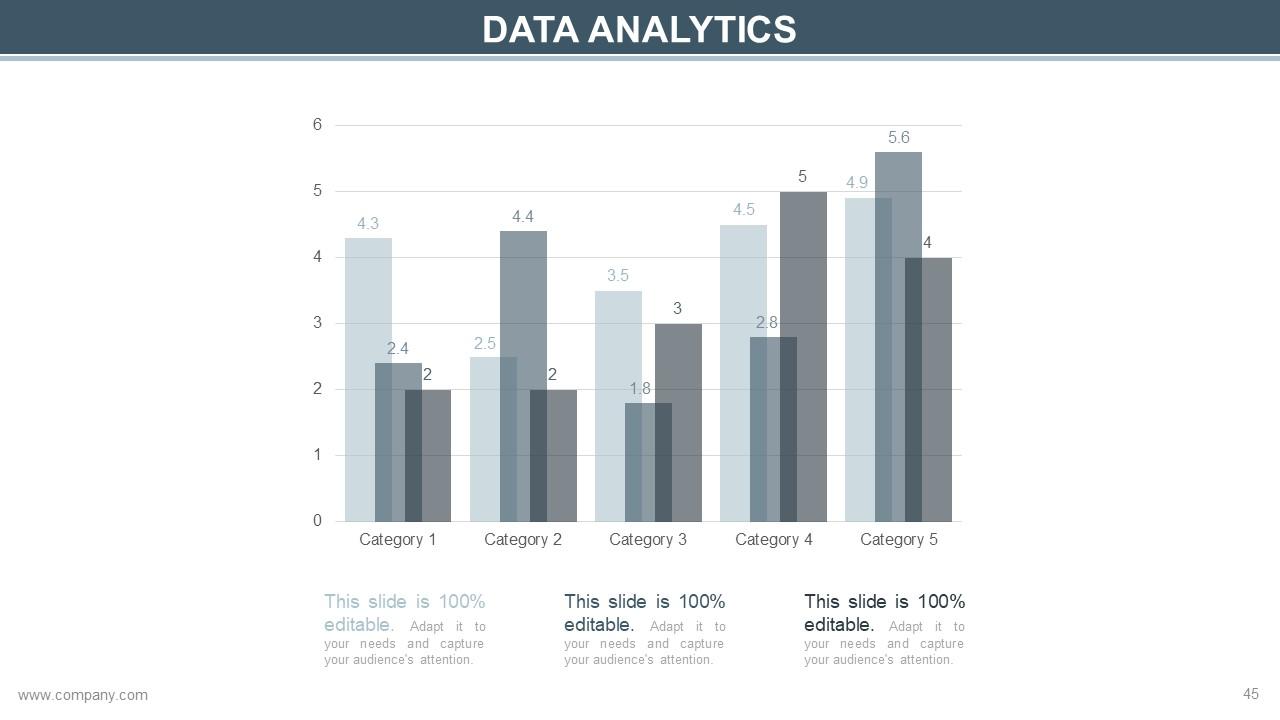
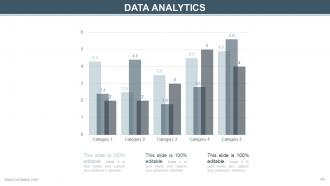
Slide 45: This slide presents Data Analytics in a graphical form.
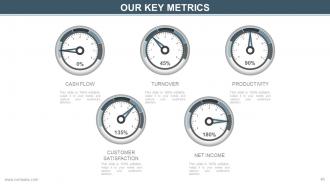
Slide 46: This slide shows Our Key Metrics such as- Cash Flow, Turnover, Productivity, Customer Satisfaction, Net Income.
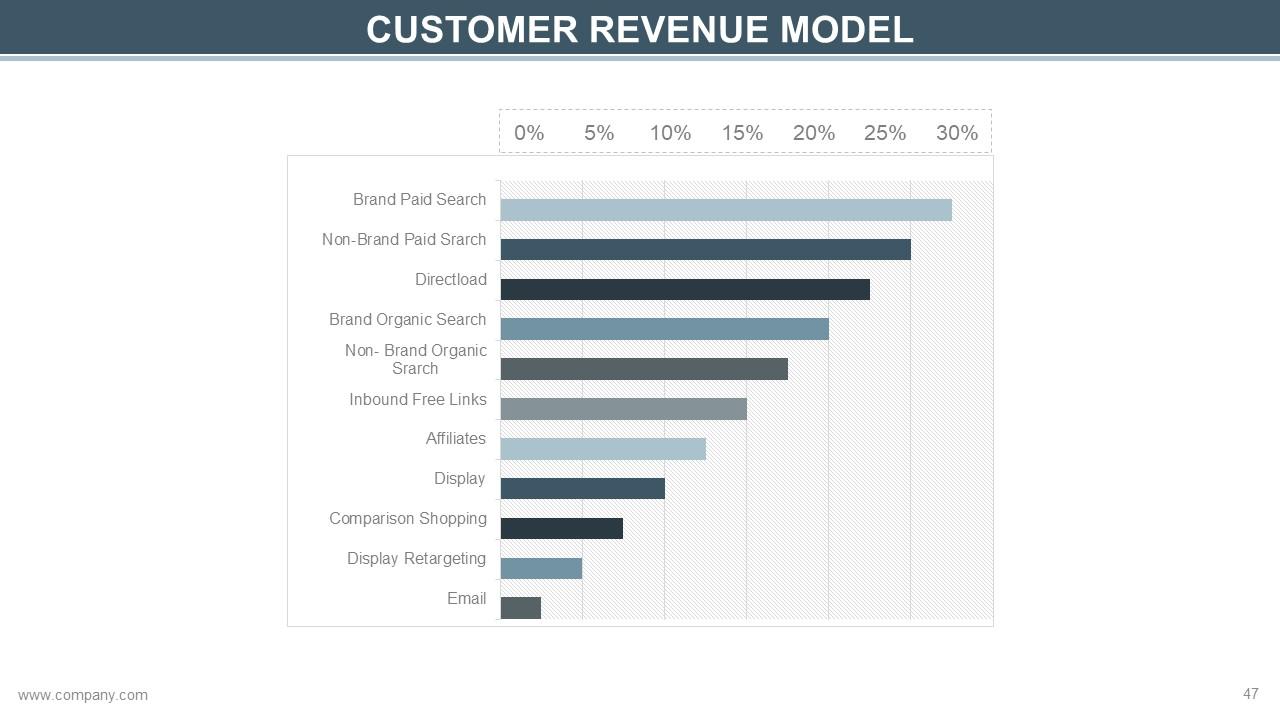
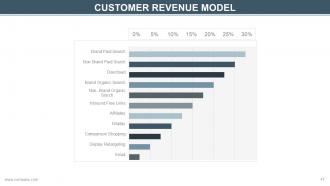
Slide 47: This slide shows a Customer Revenue Model graph. You can show the various aspects of customer revenue model in this graph.
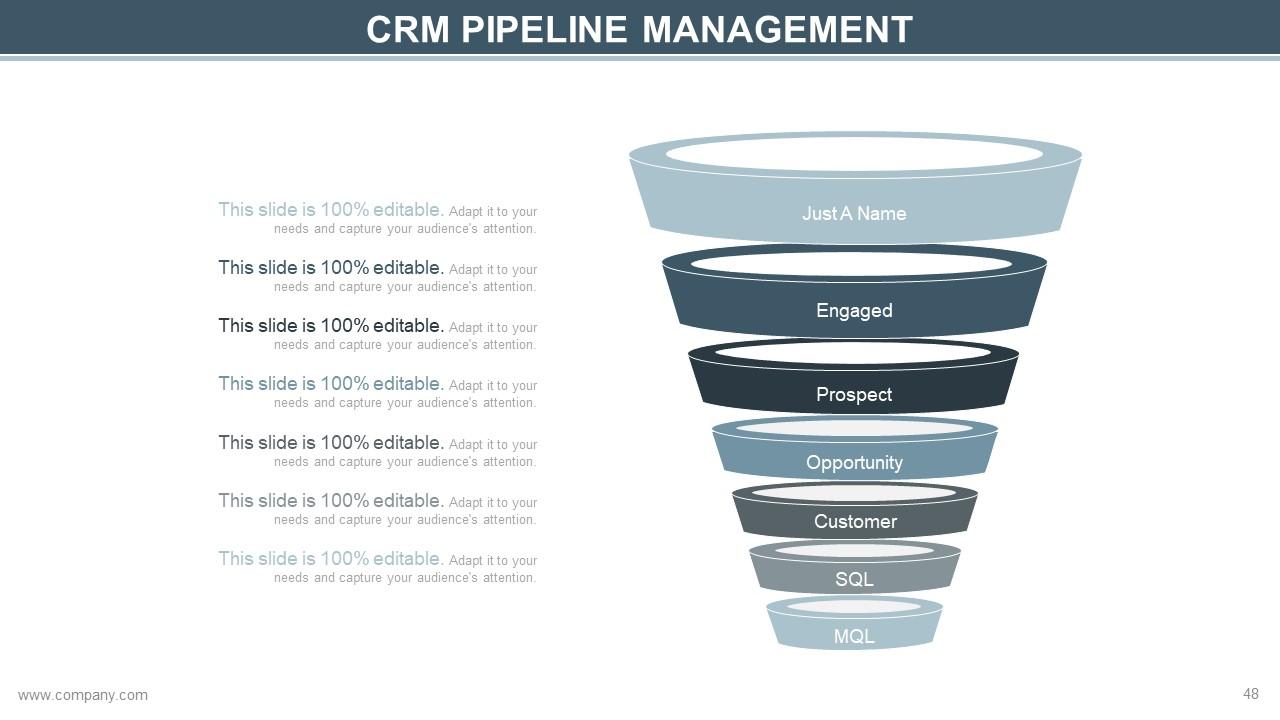
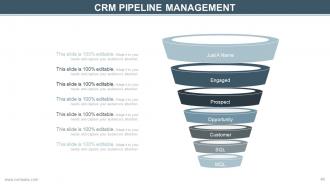
Slide 48: This slide shows CRM Pipeline Management which displays the following stages- Customer, SQL, MQL, Engaged, Just A Name, Prospect, Opportunity.
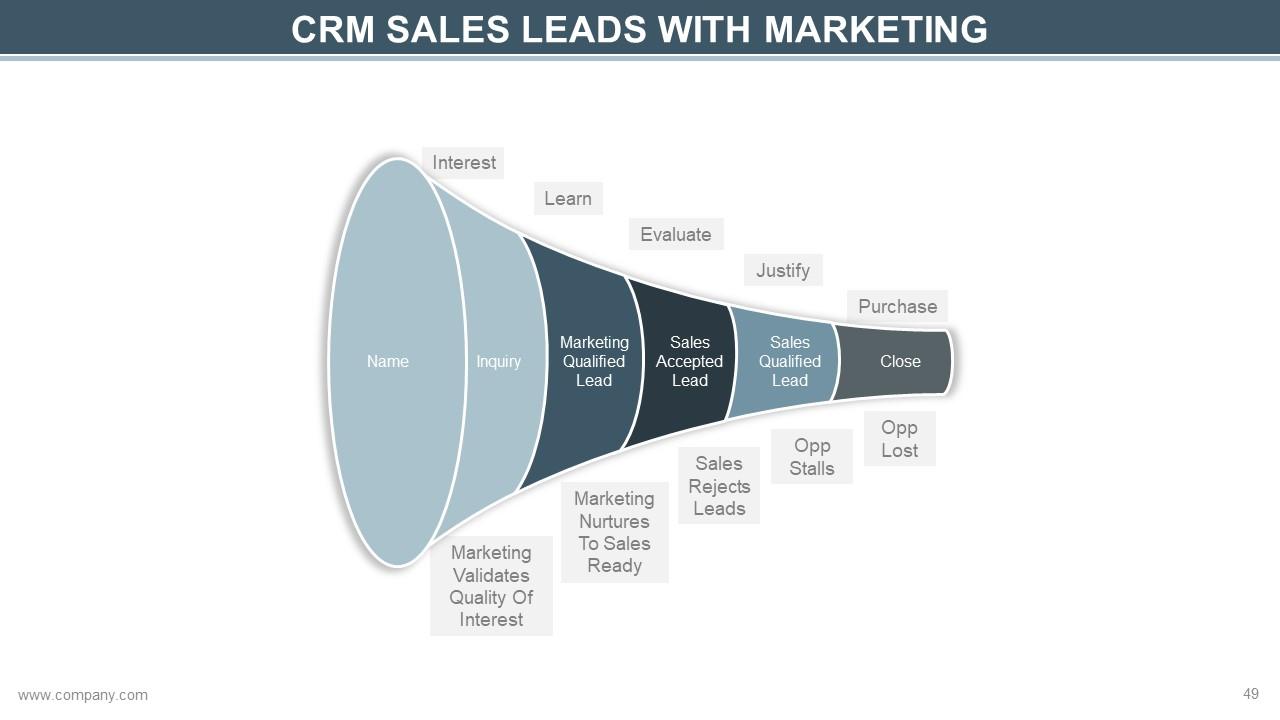
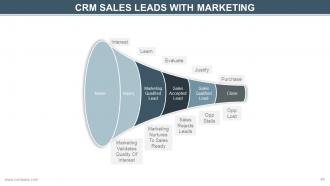
Slide 49: This slide shows CRM Sales Leads With Marketing.
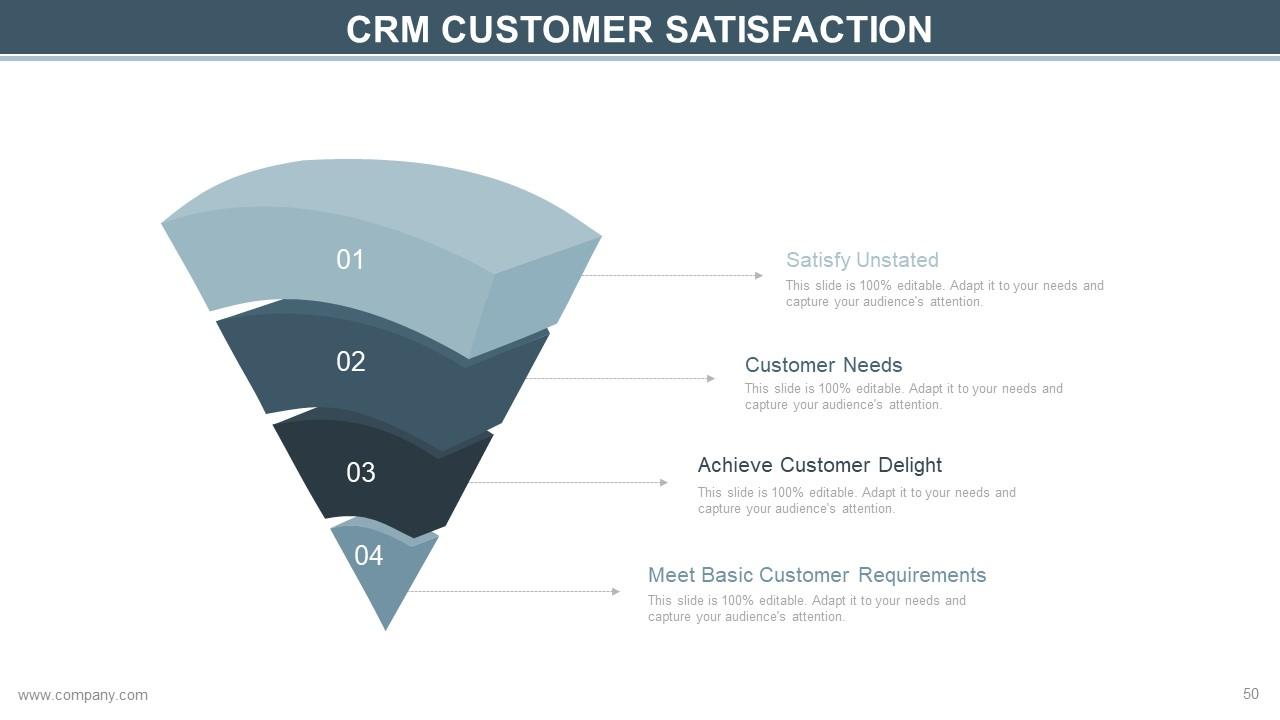
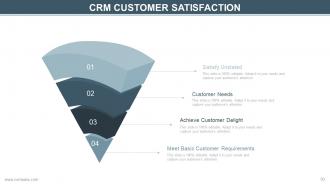
Slide 50: This slide shows CRM Customer Satisfaction with the following features that CRM should possess- Meet Basic Customer Requirements, Achieve Customer Delight, Customer Needs, Satisfy Unstated.
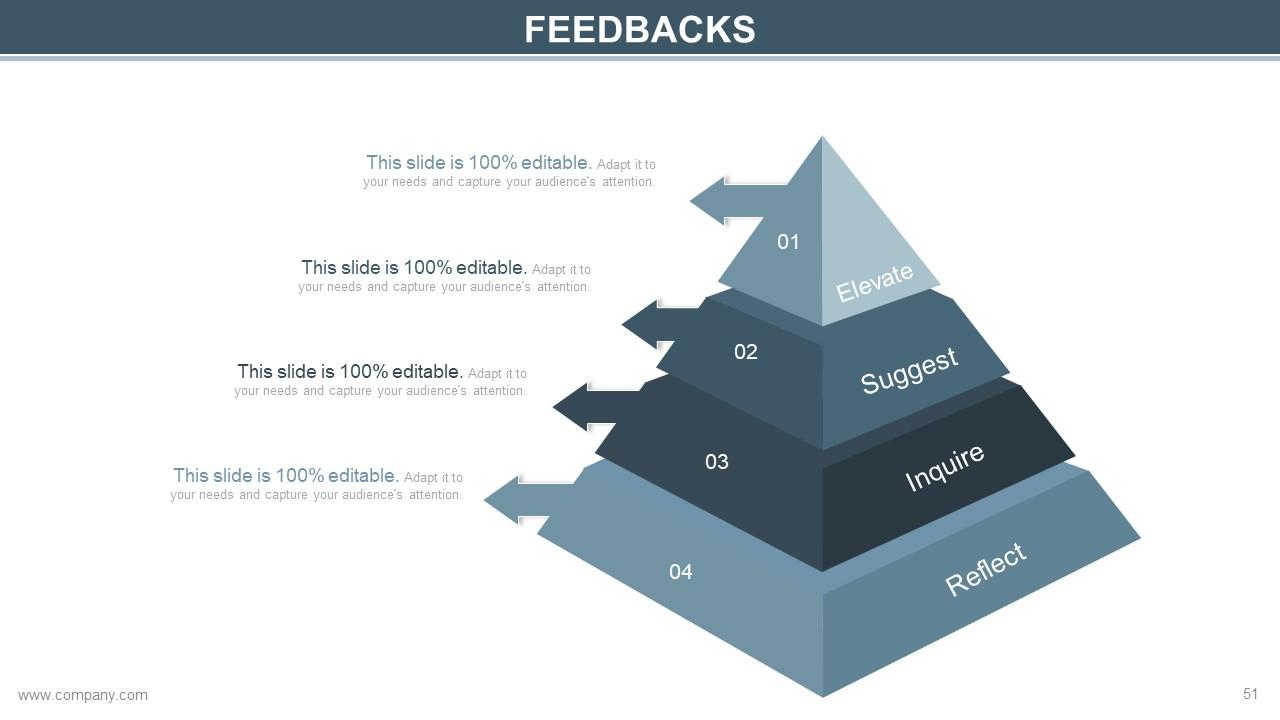
Slide 51: This slide showcases the following four stages in Feedbacks- Elevate, Suggest, Inquire, Reflect.
Slide 52: This slide is titled Additional Slides to move forward. You can change/ alter the slide content as per need.
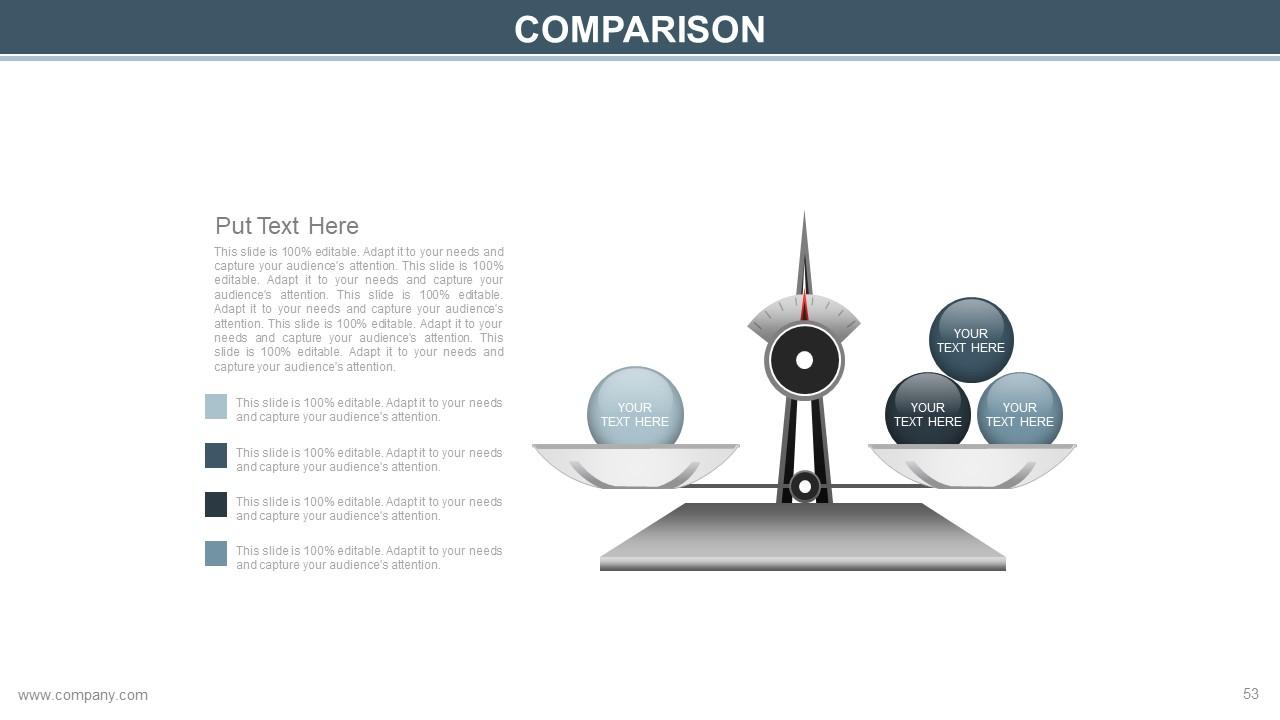
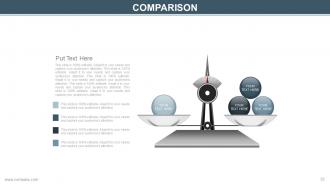
Slide 53: This is a Comparison slide to show comparison of two entities with balancing scale imagery.
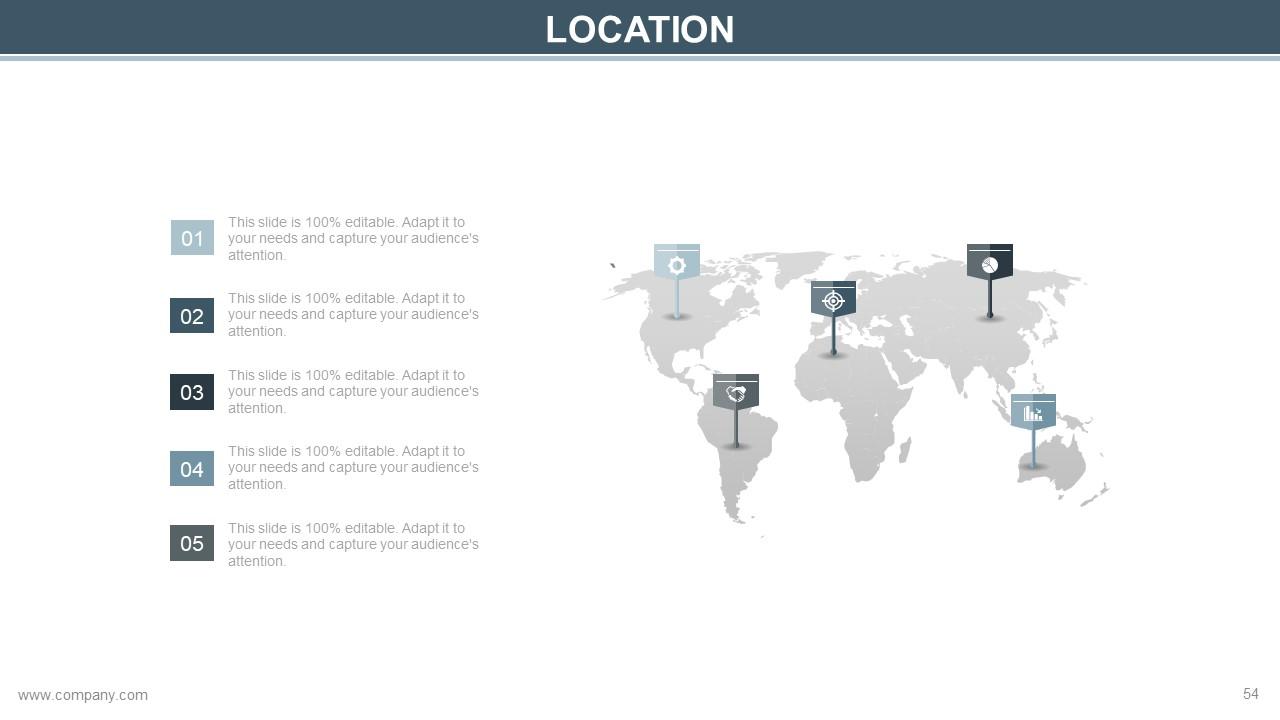
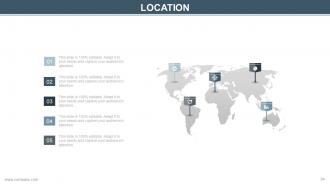
Slide 54: This is a Location slide to show global growth, presence etc. on a world map image. `
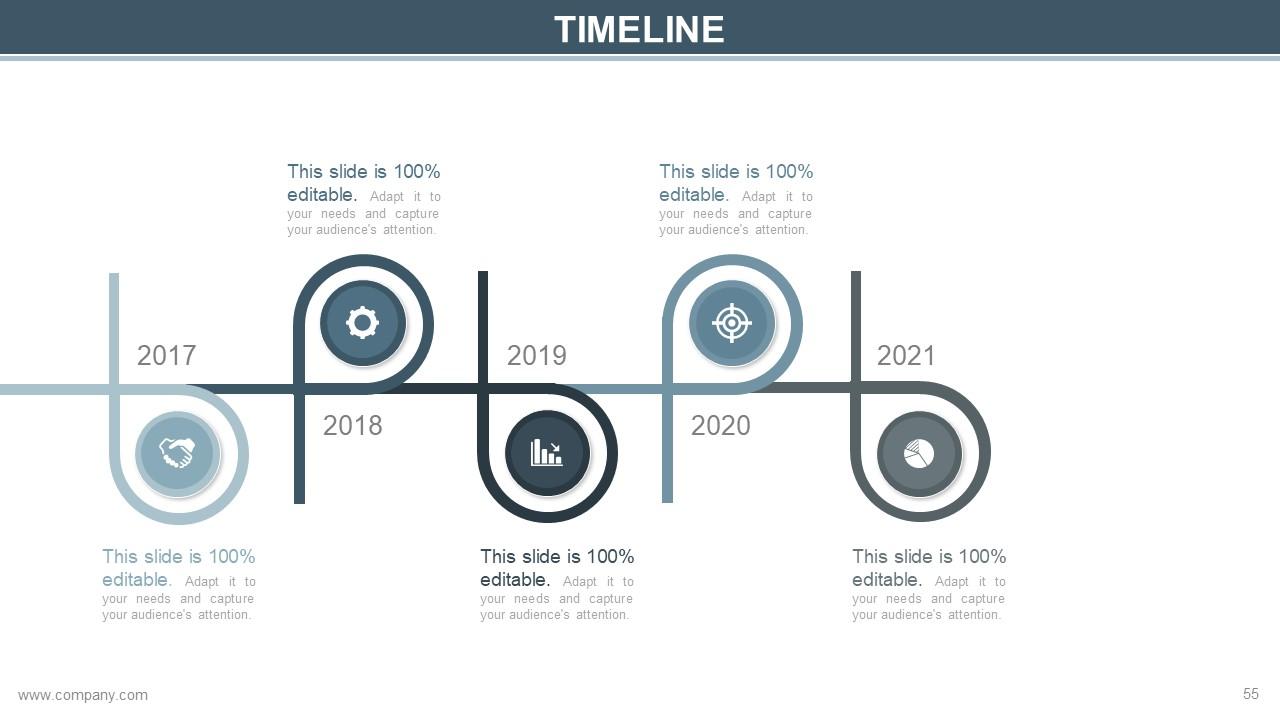
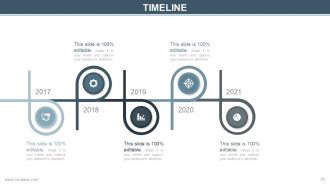
Slide 55: This is a Timeline slide to show growth, evolution, milestones etc.
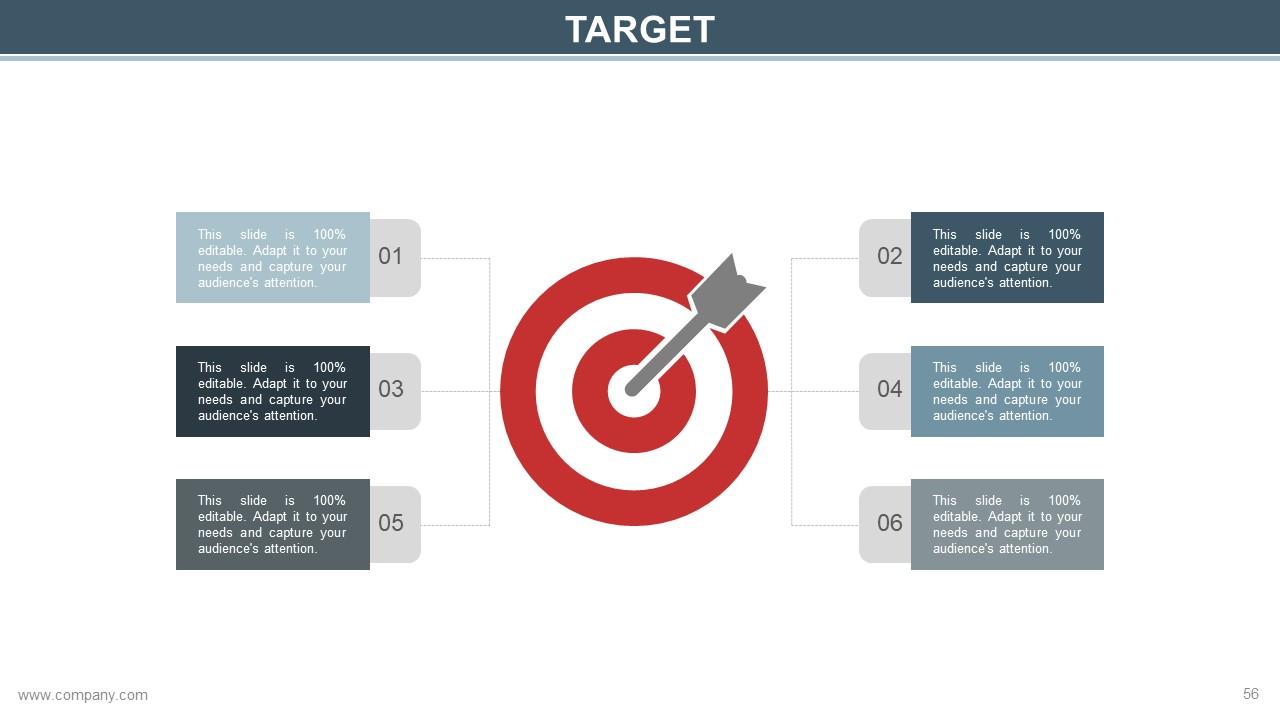
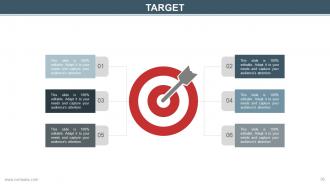
Slide 56: This is a Target slide to show targets, plans etc.
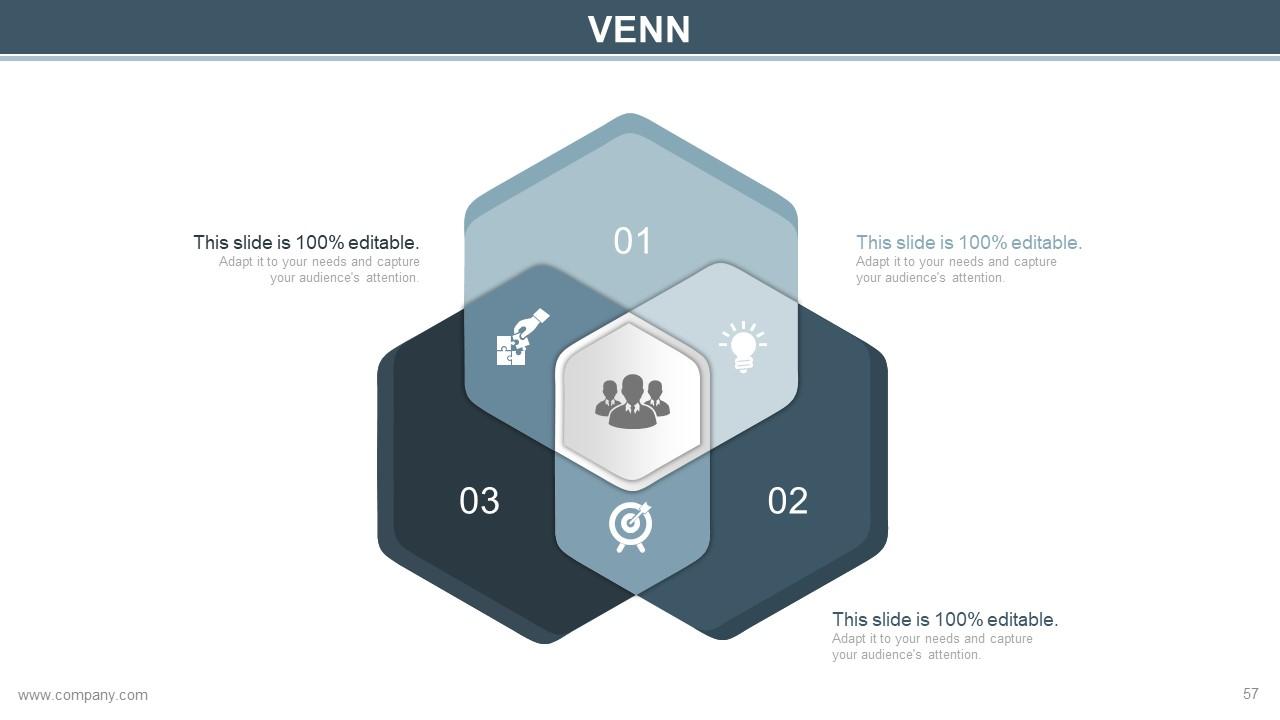
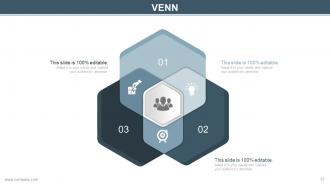
Slide 57: This is a Venn diagram image slide to show information, specifications etc.
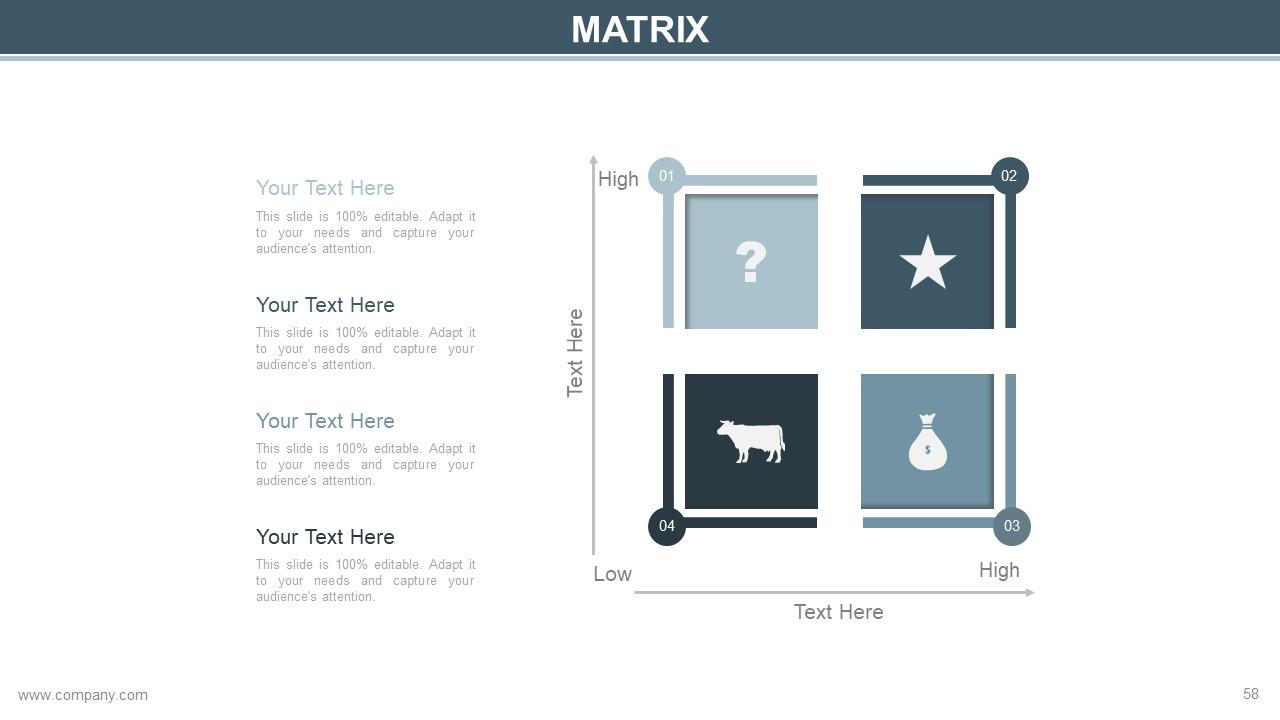
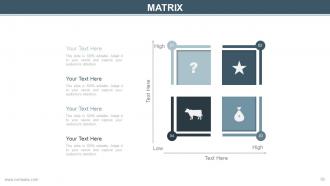
Slide 58: This is a Matrix slide to show products/ aspects in different quadrants.
Slide 59: This is a Bulb Or Idea image slide to show information, specifications, innovative aspects etc.
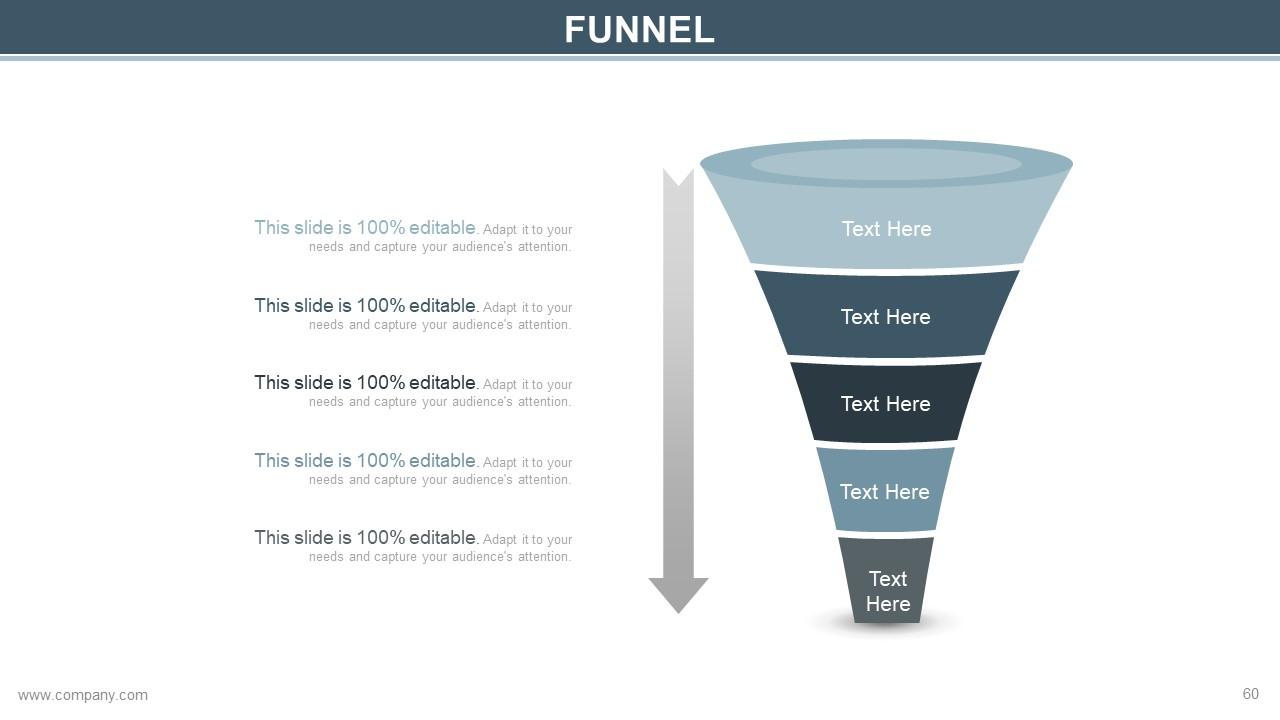
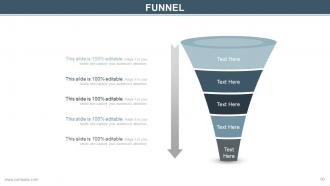
Slide 60: This is a Funnel image slide to show information, specifications etc.
Slide 61: This is a Thank You slide with Address# street number, city, state, Contact Numbers, Email Address.
Customer acquisition cost powerpoint presentation with slides with all 61 slides:
Gear up your ideas to meet demands. Fit them out with our Customer Acquisition Cost Complete Powerpoint Deck With Slides.
-
Easily Understandable slides.
-
Unique research projects to present in meeting.
