Customer Churn Analysis Powerpoint Presentation Slides
Customer Churn Analysis Powerpoint Presentation Slides is a readymade and custom virtual solution for marketers. Represent a customer’s propensity to churn with the help of our comprehensive and content-driven PPT slideshow. Showcase the present situation through customer acquisition cost, the flow of products and services, and the effectiveness of your marketing campaigns. This customer attrition PowerPoint presentation features industry-leading data visuals. Elucidate the CRM process using a cyclic diagram, and email campaign performance through a bar graph. Employing our customer turnover PPT template deck helps in elaborating customer access through social media. Take your audience for a virtual walk in the shoes of your customers by mapping the customer journey. Consolidate the channels through which you can create brand awareness amongst your target customers. Compile the retention rate and conversion rate through state-of-the-art diagrams featured in our customer defection PowerPoint theme. Highlight recent customer complaints, problems, or issues. Hit the download button and begin personalization instantly. Our Customer Churn Analysis Powerpoint Presentation Slides are topically designed to provide an attractive backdrop to any subject. Use them to look like a presentation pro.
- Google Slides is a new FREE Presentation software from Google.
- All our content is 100% compatible with Google Slides.
- Just download our designs, and upload them to Google Slides and they will work automatically.
- Amaze your audience with SlideTeam and Google Slides.
-
Want Changes to This PPT Slide? Check out our Presentation Design Services
- WideScreen Aspect ratio is becoming a very popular format. When you download this product, the downloaded ZIP will contain this product in both standard and widescreen format.
-

- Some older products that we have may only be in standard format, but they can easily be converted to widescreen.
- To do this, please open the SlideTeam product in Powerpoint, and go to
- Design ( On the top bar) -> Page Setup -> and select "On-screen Show (16:9)” in the drop down for "Slides Sized for".
- The slide or theme will change to widescreen, and all graphics will adjust automatically. You can similarly convert our content to any other desired screen aspect ratio.
Compatible With Google Slides

Get This In WideScreen
You must be logged in to download this presentation.
PowerPoint presentation slides
Presenting Customer Churn Analysis Powerpoint Presentation Slides. Download this 100% customizable complete deck and gain access to 64 PPT templates. Each PowerPoint slide is professionally designed and can be edited with appreciable ease. Alter orientation, background, colors, patterns, shapes, font, and text as per your desire. Change the file format into PDF, PNG, or JPG according to your needs. Use standard and widescreen resolutions to access this presentation. Use Google Slides for a quick view.
People who downloaded this PowerPoint presentation also viewed the following :
Content of this Powerpoint Presentation
Slide 1: This slide introduces Customer Churn Analysis. State your Company name and begin.
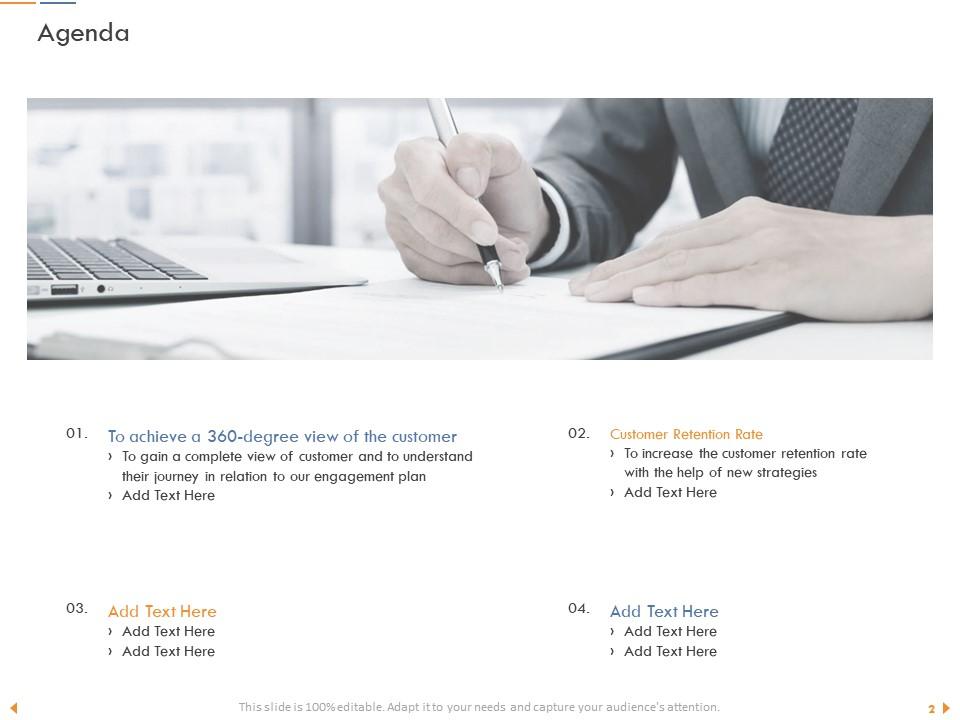
Slide 2: This slide displays Agenda.
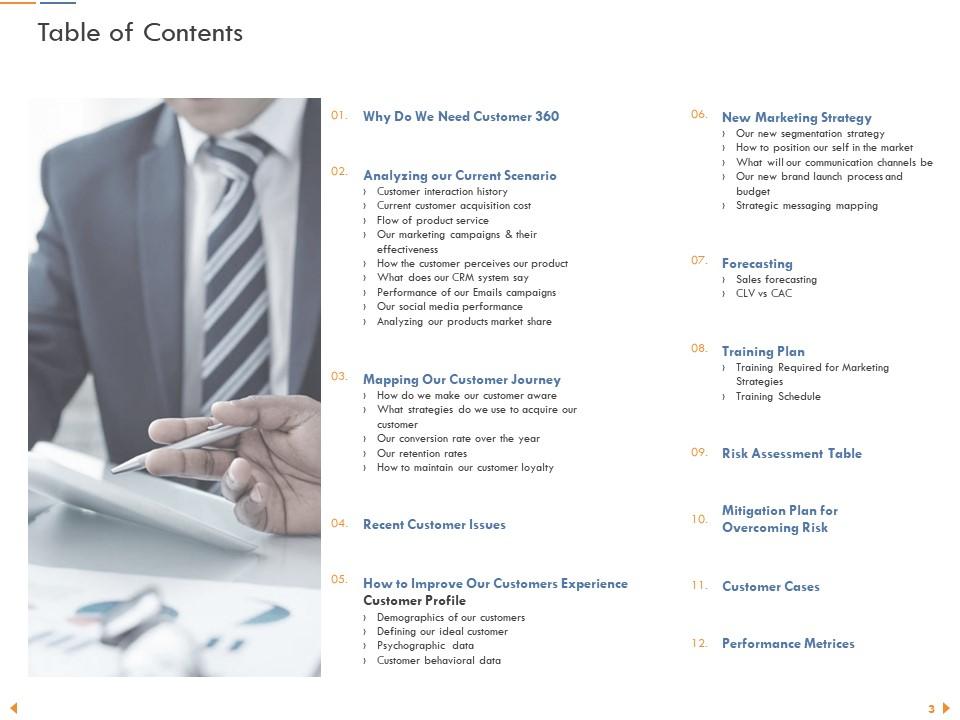
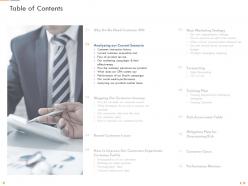
Slide 3: This slide displays Table of Contents.
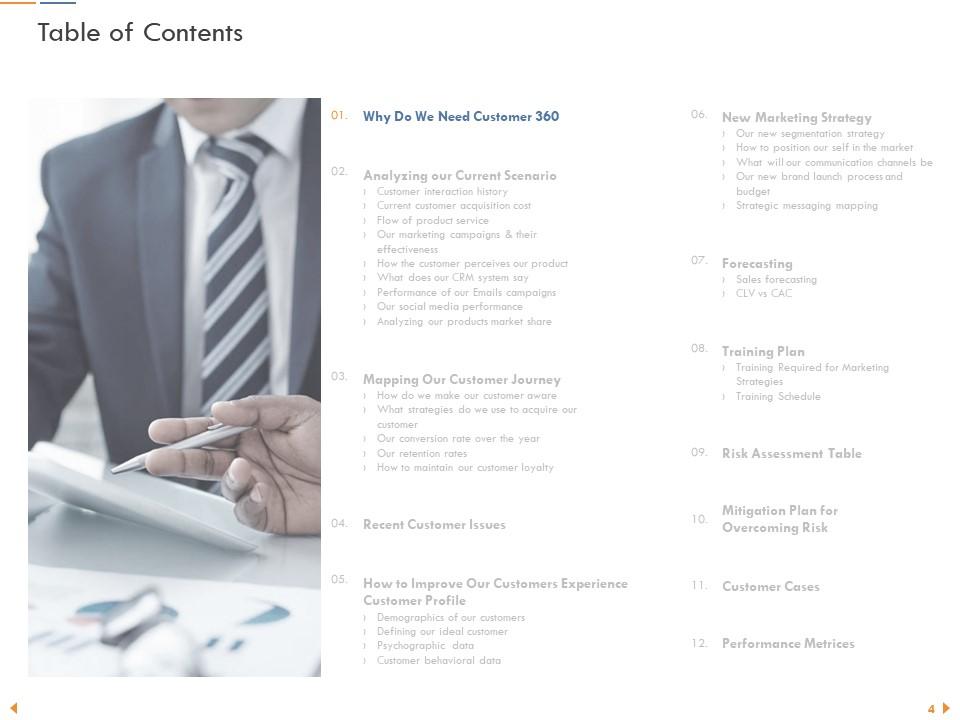
Slide 4: This slide displays Table of Contents
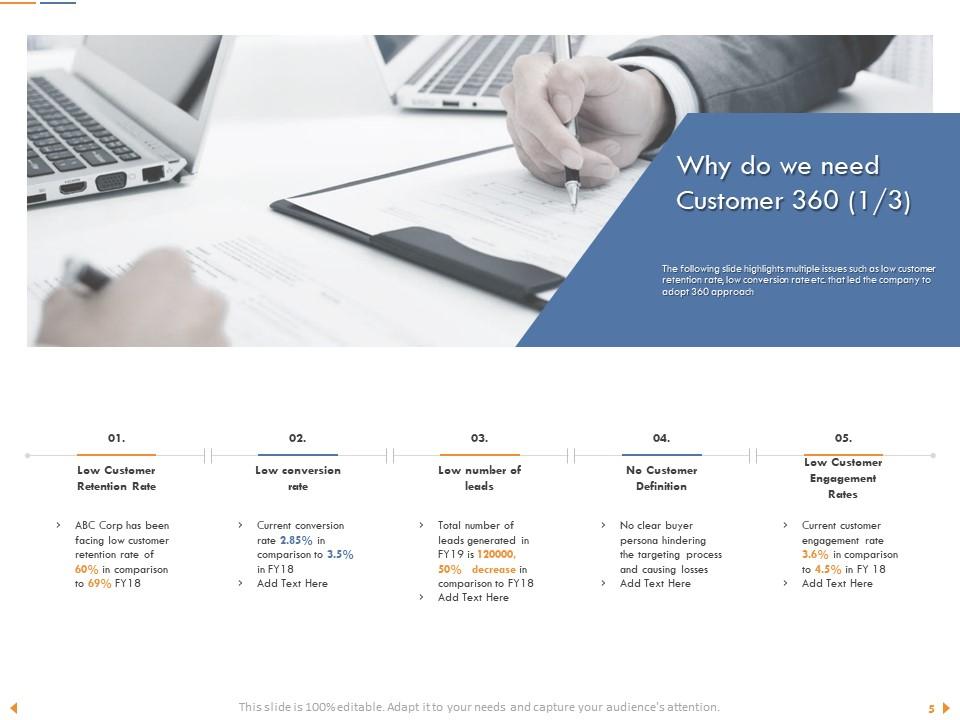
Slide 5: The following slide highlights multiple issues such as low customer retention rate, low conversion rate etc. that led the company to adopt 360 approach
Slide 6: The following slide highlights the key metrices of customer satisfaction and have measured their performance over years in the table provided
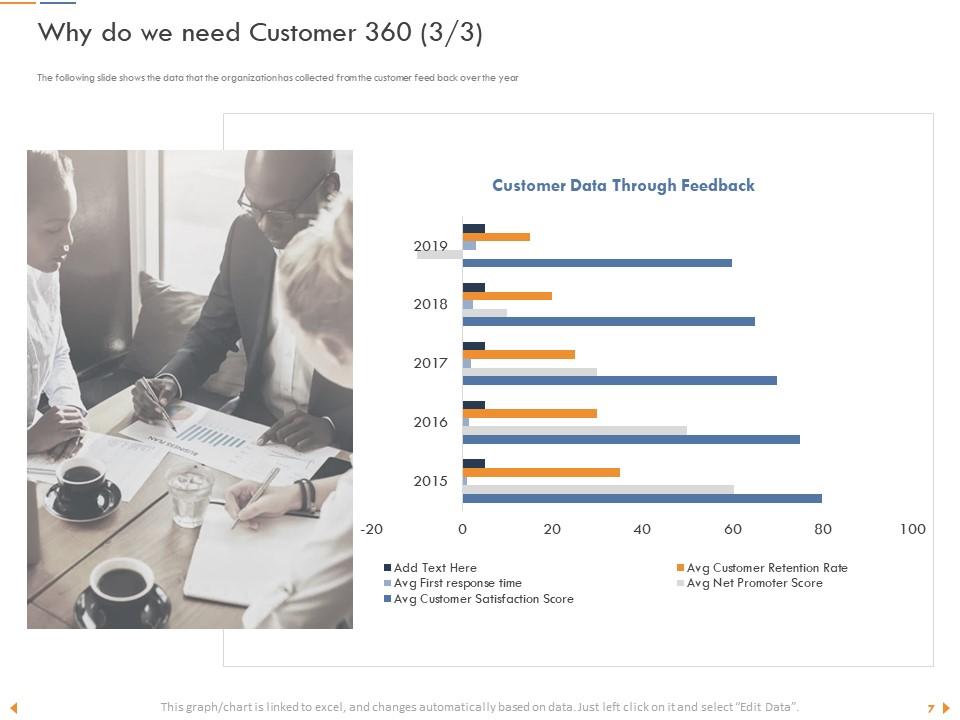
Slide 7: The slide shows the data that the organization has collected from the customer feed back over the year
Slide 8: This slide displays Table of Contents.
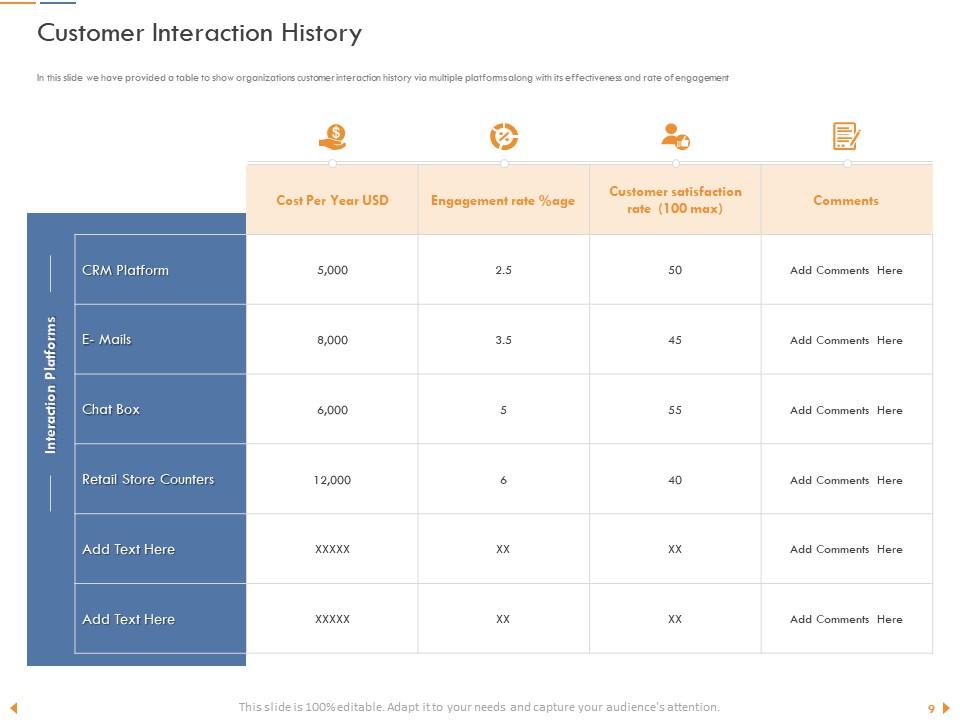
Slide 9: In this slide we have provided a table to show organizations customer interaction history via multiple platforms along with its effectiveness and rate of engagement
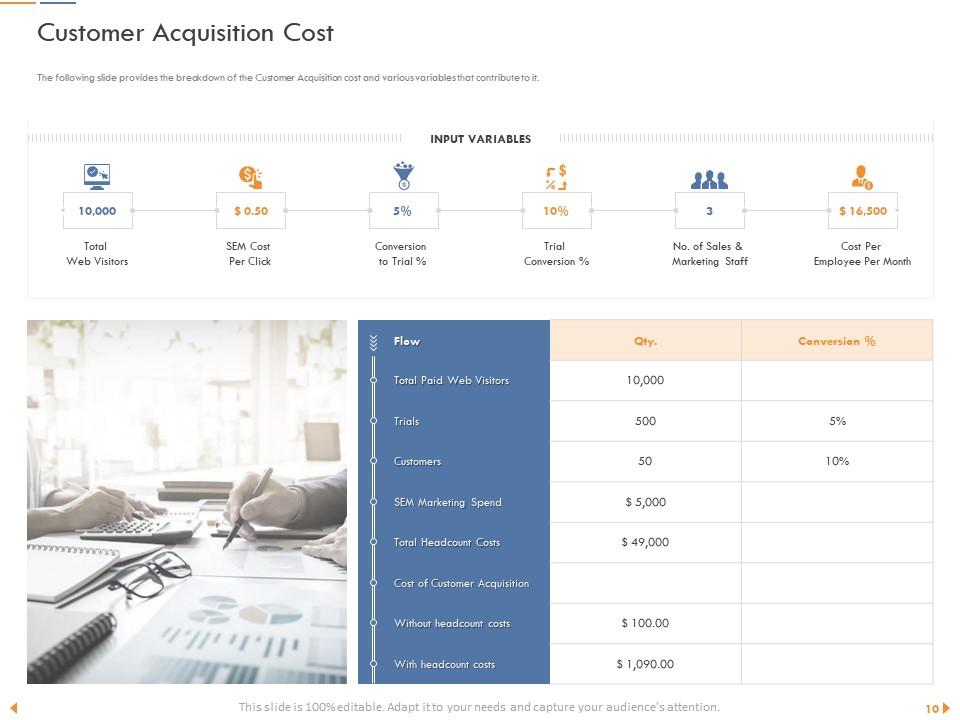
Slide 10: The following slide provides the breakdown of the Customer Acquisition cost and various variables that contribute to it.
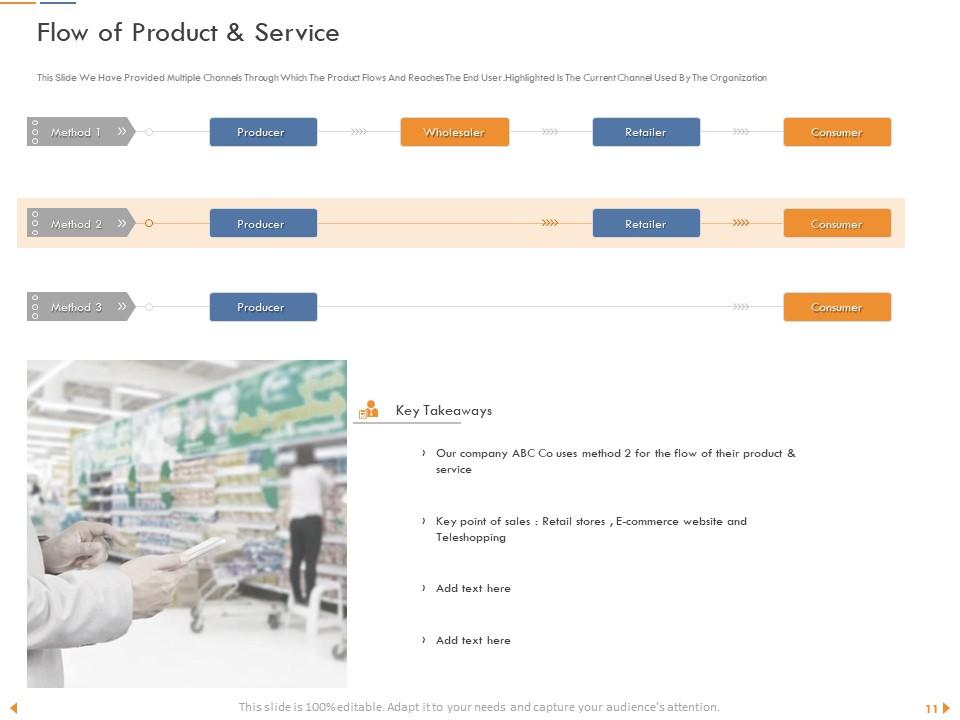
Slide 11: In this slide we have provided multiple channels through which the product flows and reaches the end user .Highlighted is the current channel used by the organization
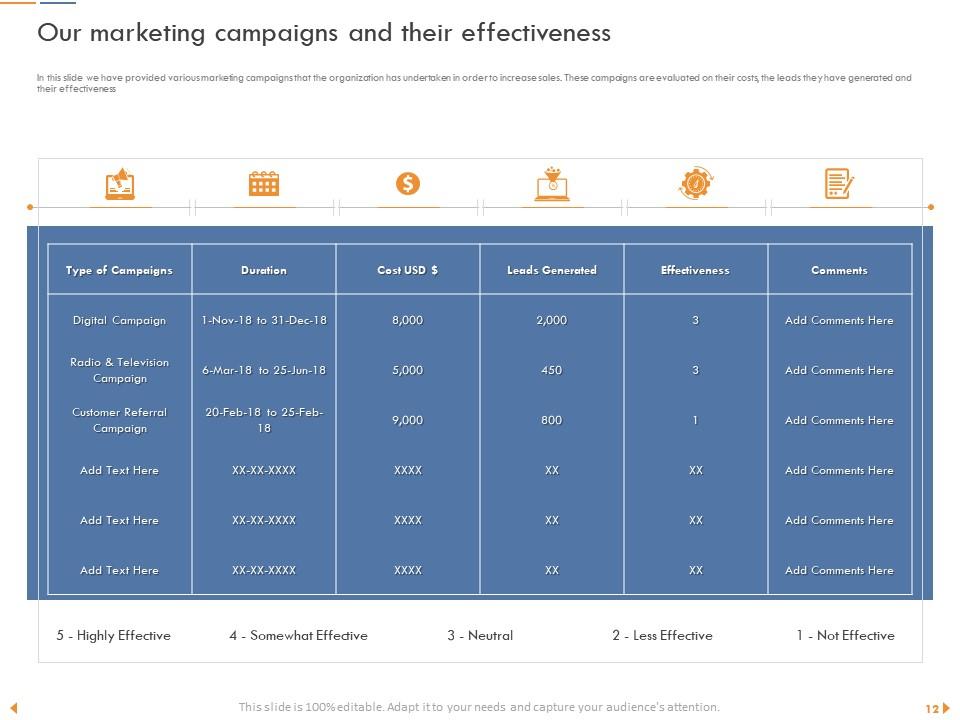
Slide 12: In this slide we have provided various marketing campaigns that the organization has undertaken in order to increase sales. These campaigns are evaluated on their costs, the leads they have generated and their effectiveness
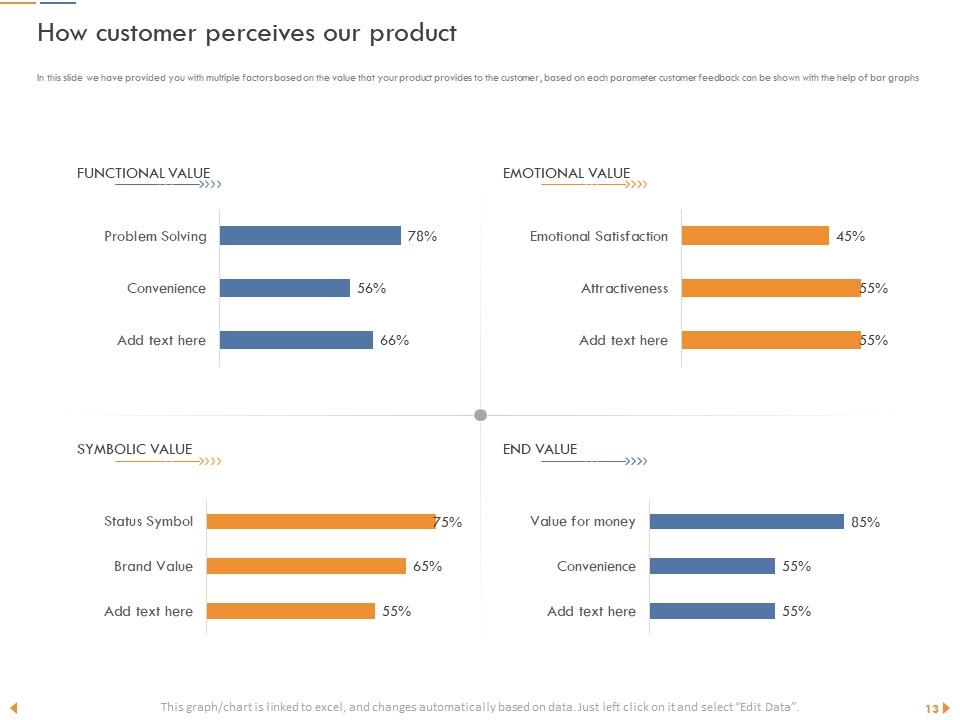
Slide 13: In this slide we have provided you with multiple factors based on the value that your product provides to the customer , based on each parameter customer feedback can be shown with the help of bar graphs
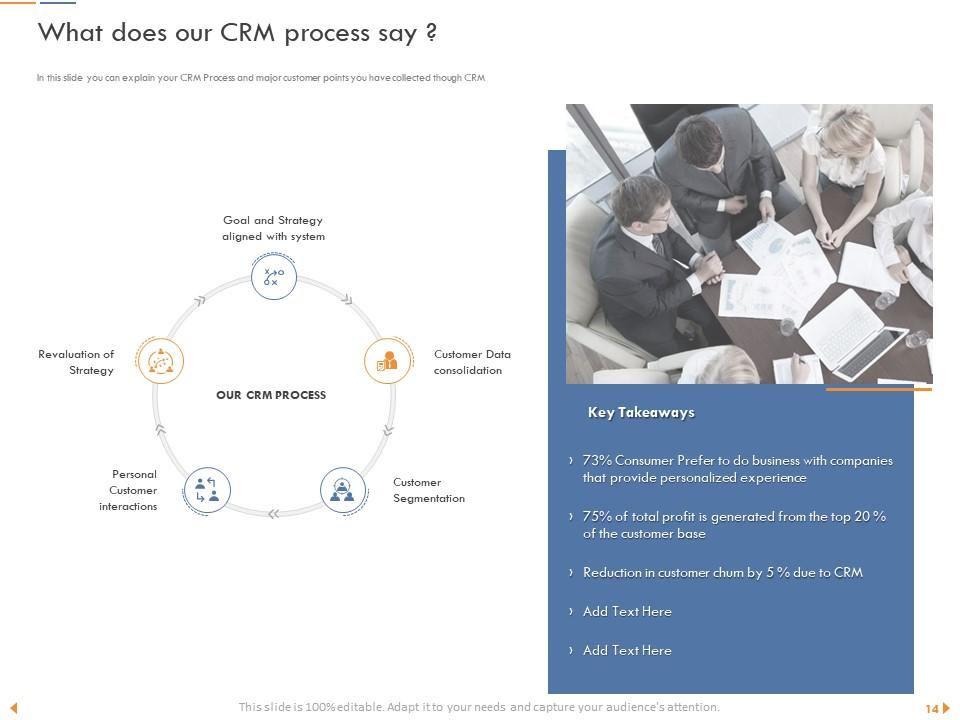
Slide 14: This slide displays Key Takeaways.
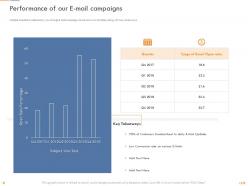
Slide 15: This slide showcases Performance of our E-mail campaigns.
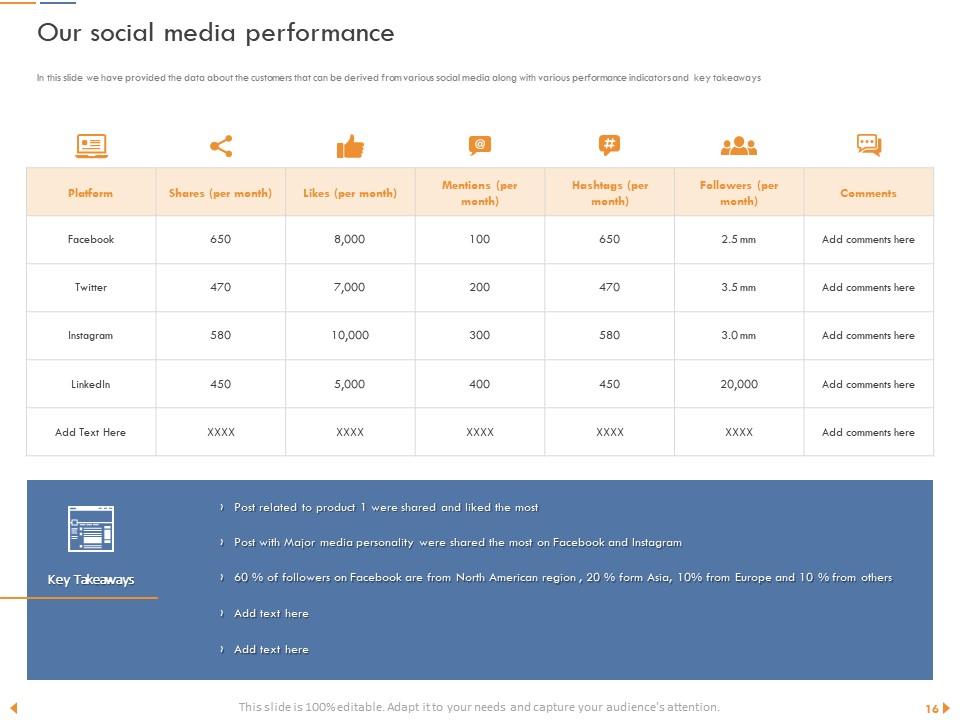
Slide 16: In this slide we have provided the data about the customers that can be derived from various social media along with various performance indicators and key takeaways
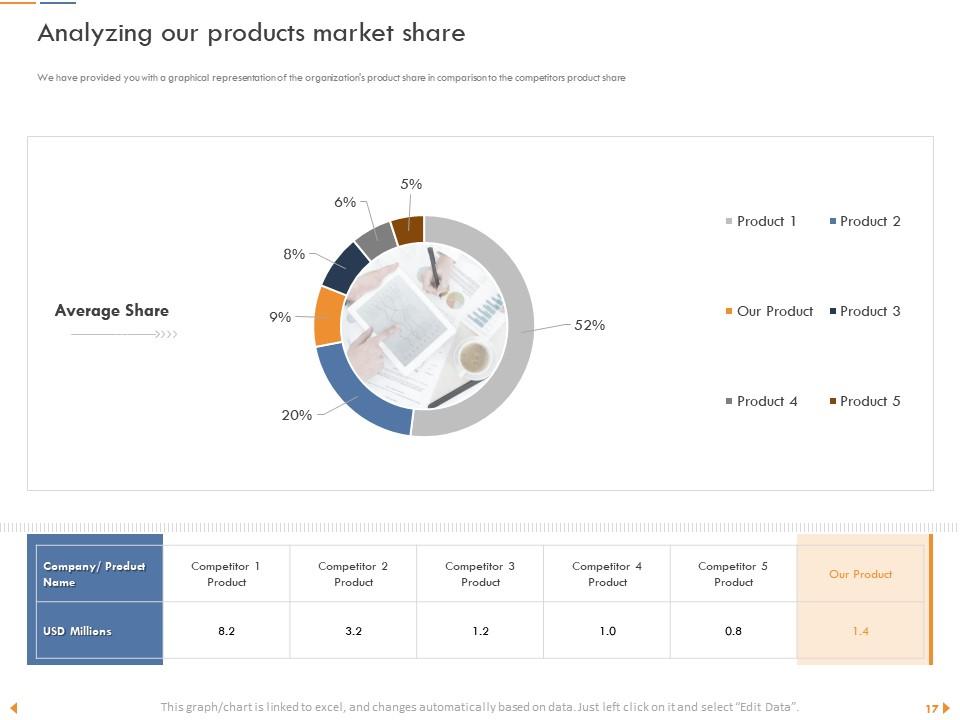
Slide 17: This slide showcases Analyzing our products market share.
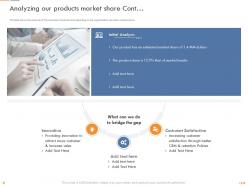
Slide 18: This slide shows the analysis of the customer transaction and spending on the organization's products market share
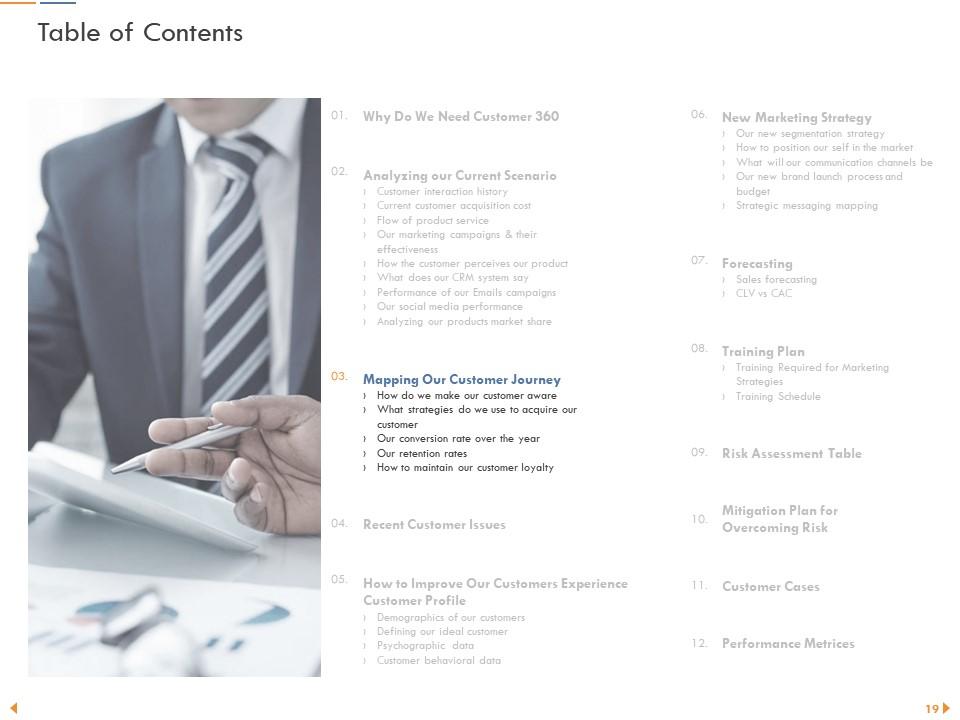
Slide 19: This slide displays Table of Contents.
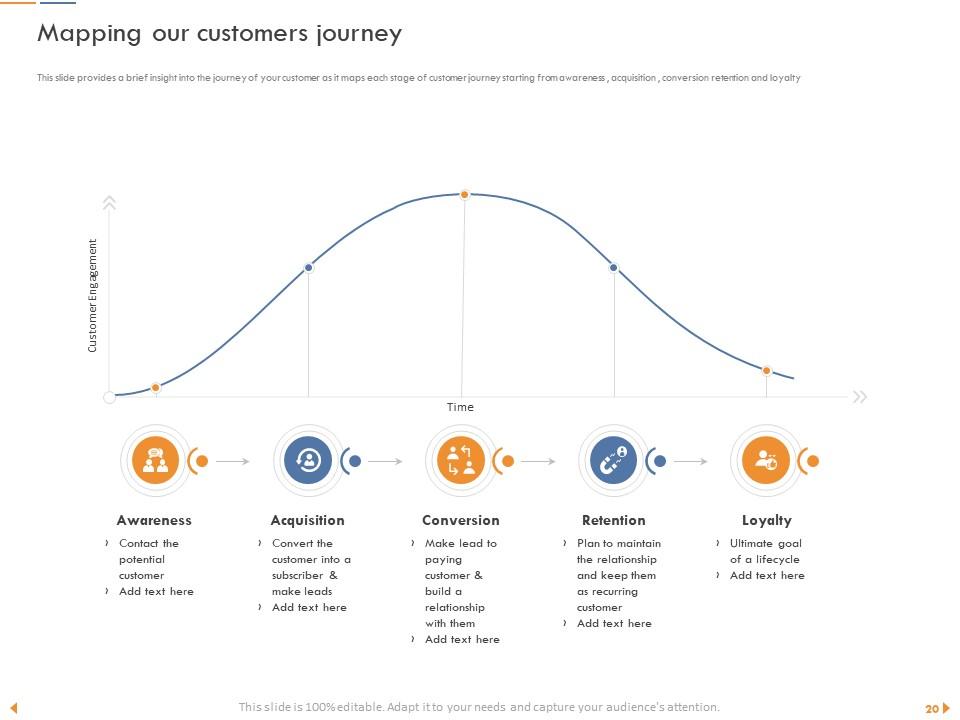
Slide 20: This slide provides a brief insight into the journey of your customer as it maps each stage of customer journey starting from awareness , acquisition , conversion retention and loyalty
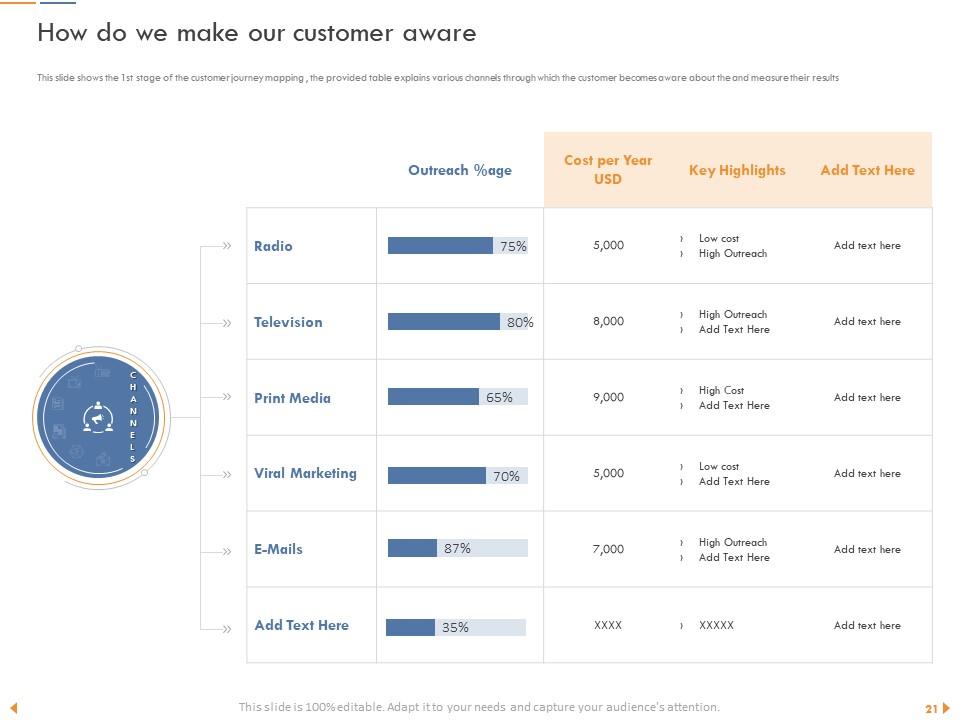
Slide 21: This slide shows the 1st stage of the customer journey mapping , the provided table explains various channels through which the customer becomes aware about the and measure their results
Slide 22: In this slide the provided graph shows the various steps taken in customer acquisition phase along with the customer acquisition rate
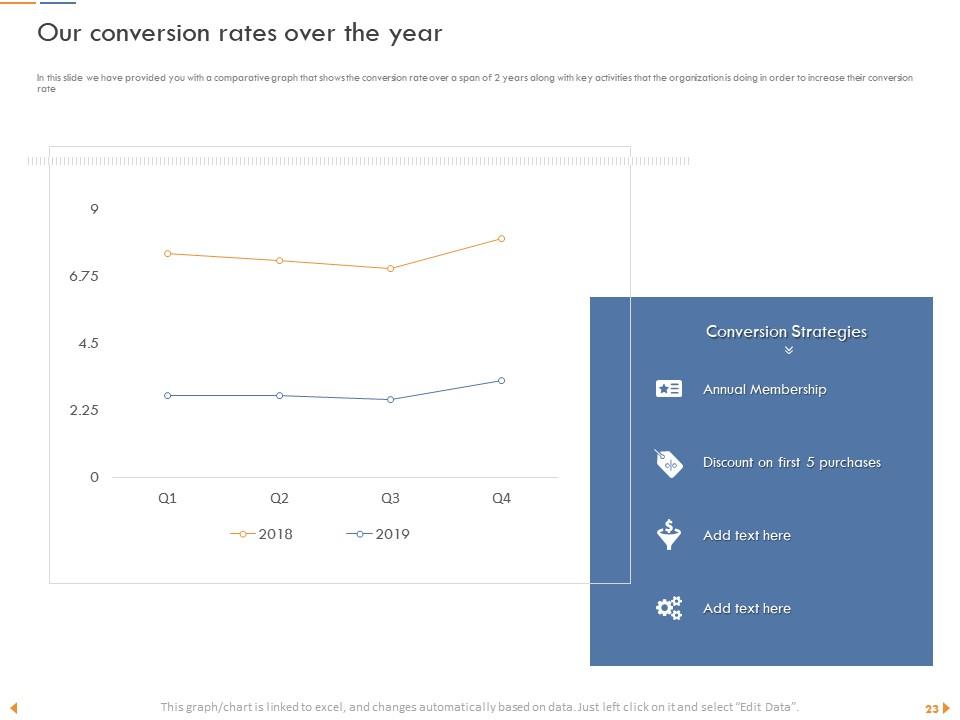
Slide 23: In this slide we have provided you with a comparative graph that shows the conversion rate over a span of 2 years along with key activities that the organization is doing in order to increase their conversion rate
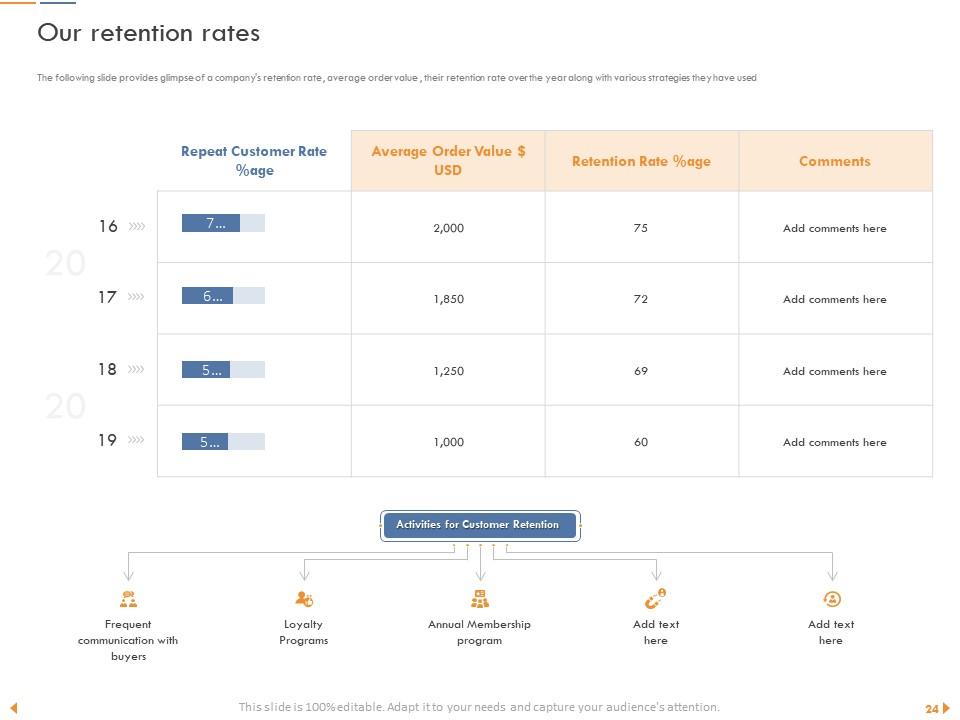
Slide 24: The following slide provides glimpse of a company's retention rate , average order value , their retention rate over the year along with various strategies they have used
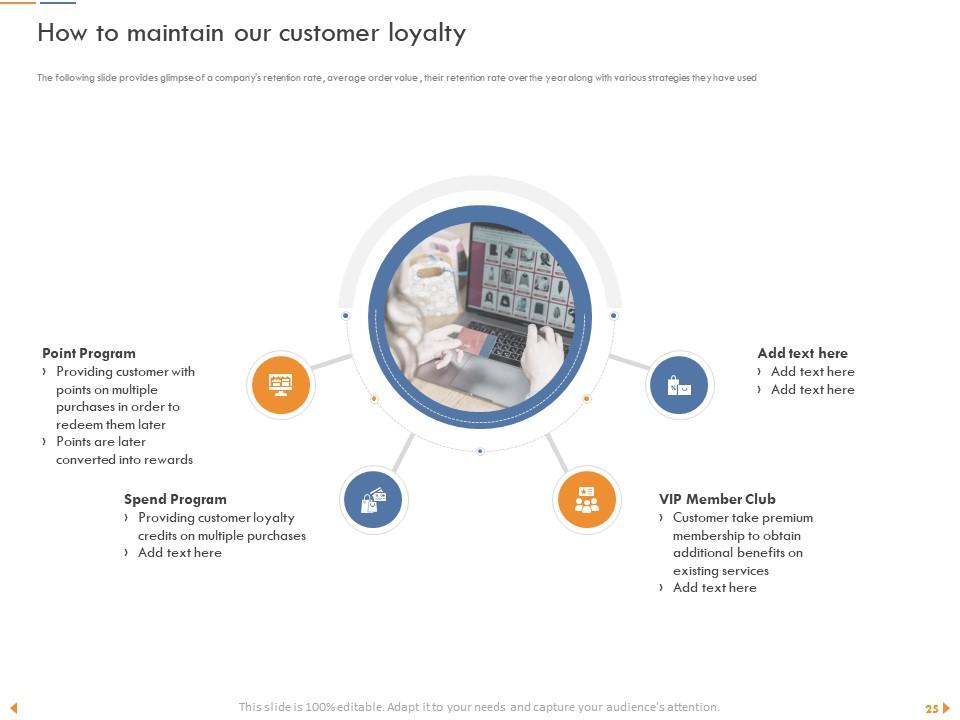
Slide 25: The following slide provides glimpse of a company's retention rate , average order value , their retention rate over the year along with various strategies they have used
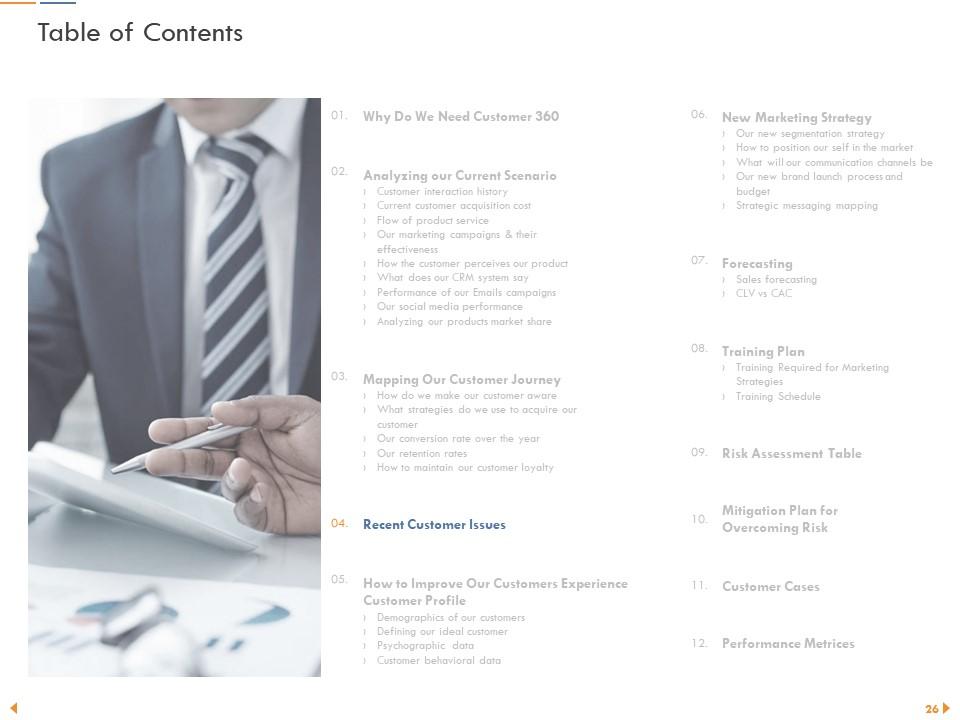
Slide 26: This slide displays Table of Contents
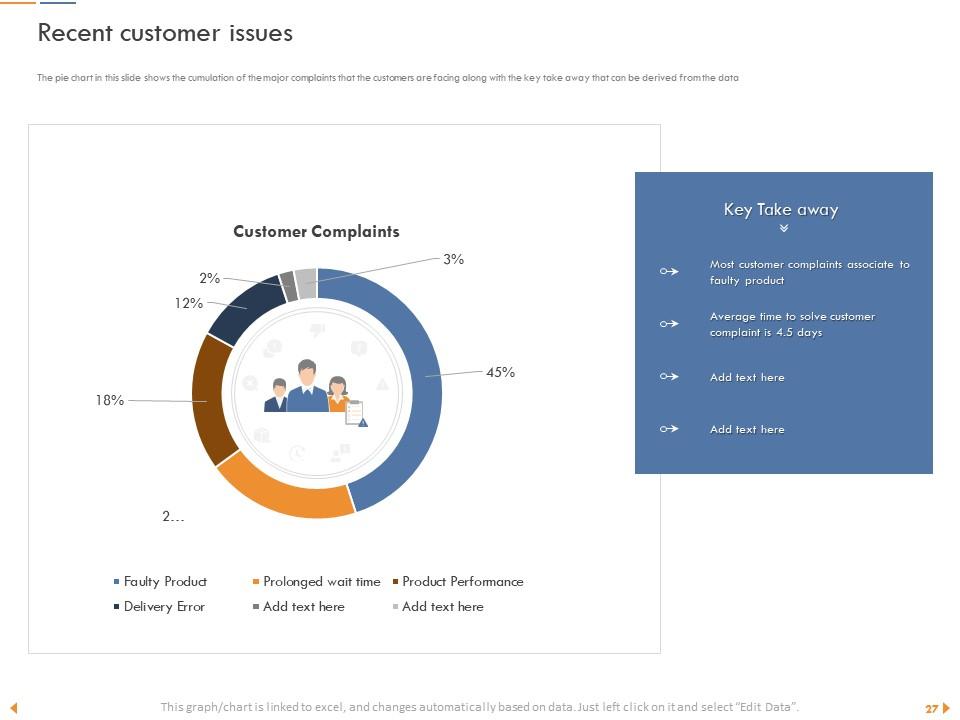
Slide 27: The pie chart in this slide shows the cumulation of the major complaints that the customers are facing along with the key take away that can be derived from the data
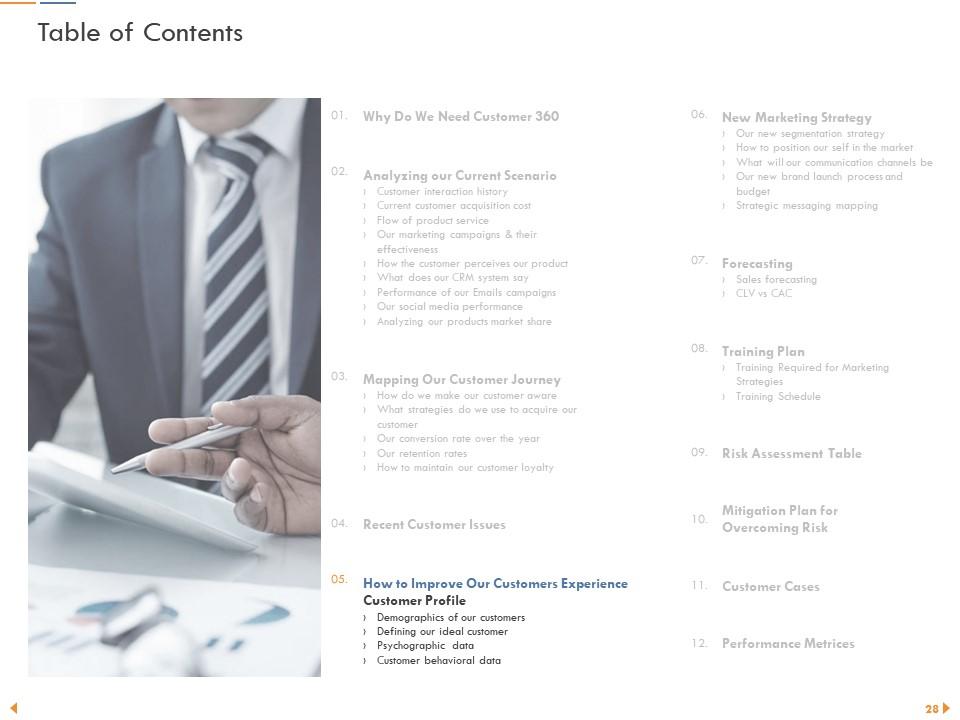
Slide 28: This slide displays Table of Contents.
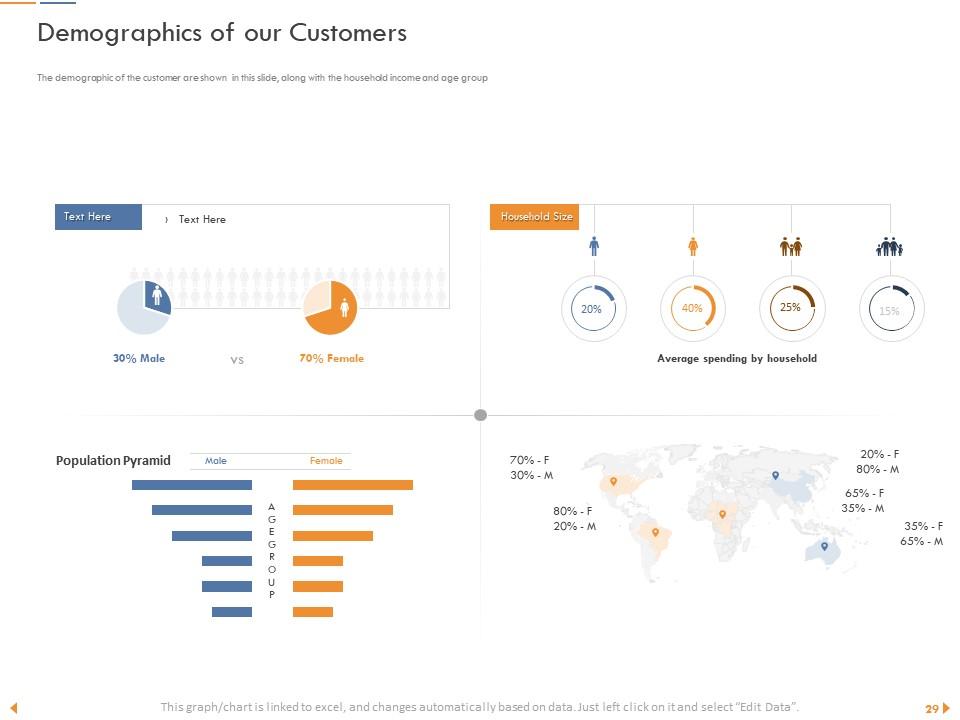
Slide 29: This slide displays Demographics of our Customers.
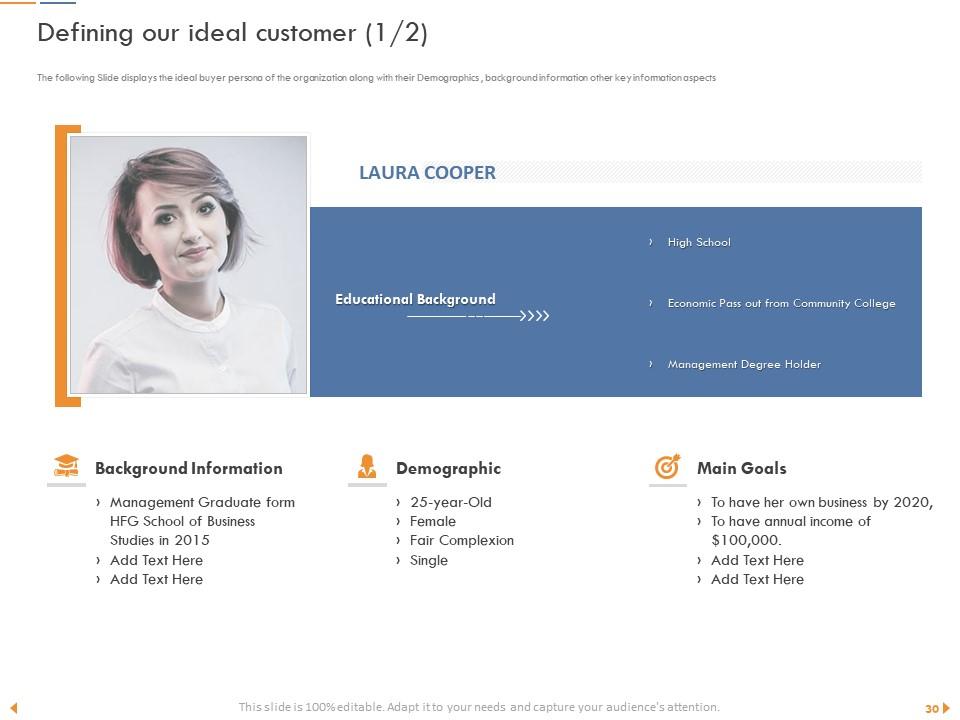
Slide 30: The following Slide displays the ideal buyer persona of the organization along with their Demographics , background information other key information aspects
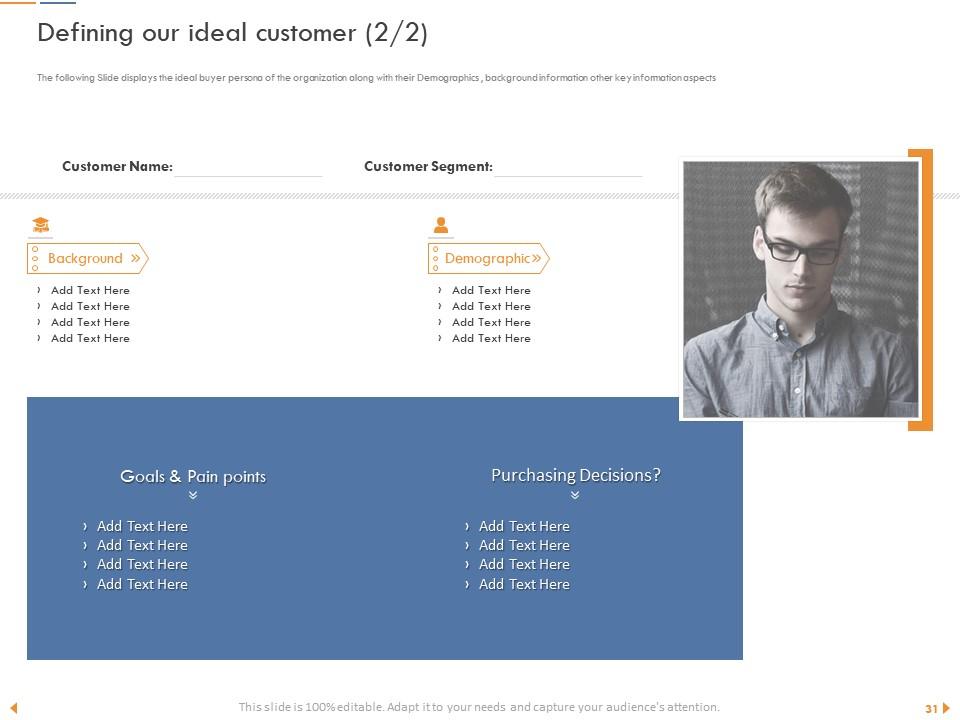
Slide 31: The following Slide displays the ideal buyer persona of the organization along with their Demographics , background information other key information aspects
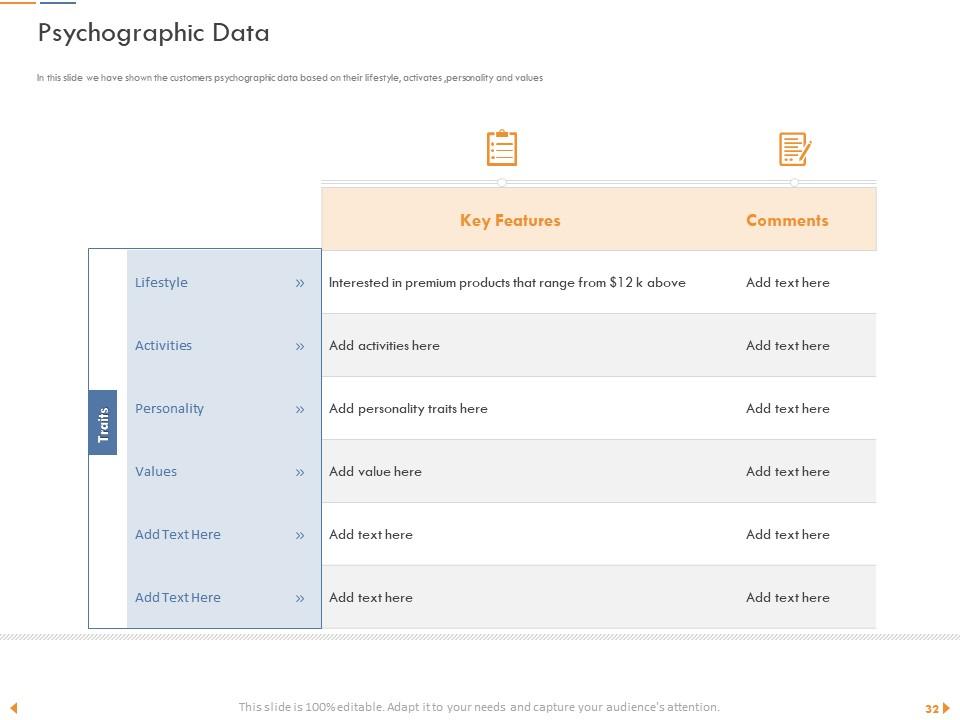
Slide 32: In this slide we have shown the customers psychographic data based on their lifestyle, activates ,personality and values
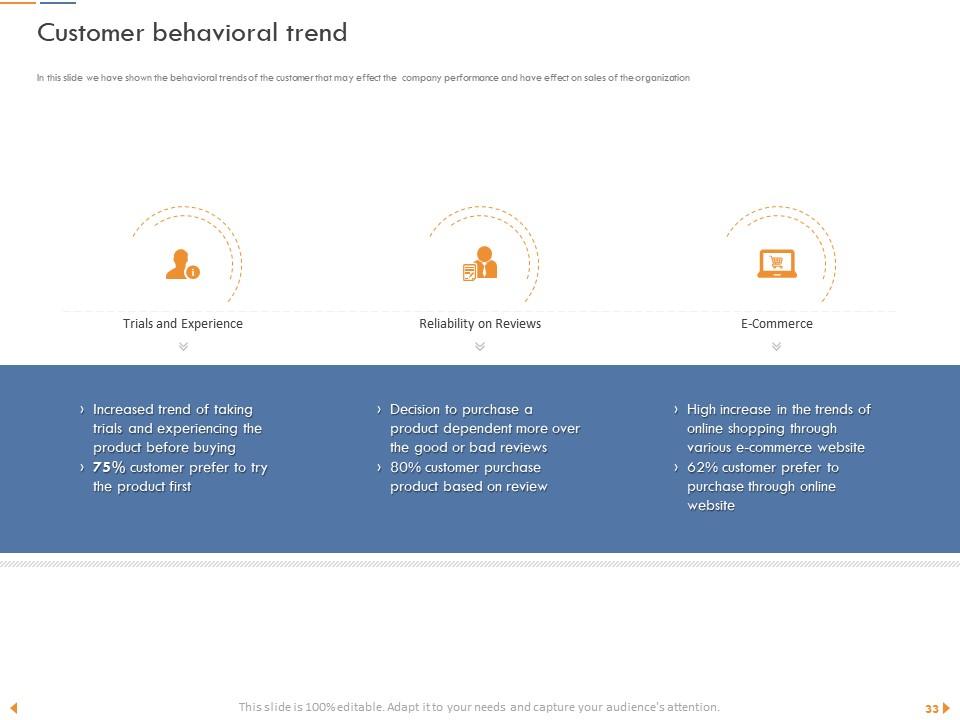
Slide 33: In this slide we have shown the behavioral trends of the customer that may effect the company performance and have effect on sales of the organization
Slide 34: This slide shows Table of Contents.
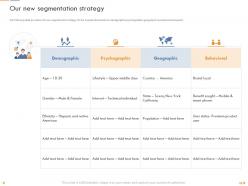
Slide 35: The following slide provides with new segmentation strategy for the organization based on demographics psychographics geographic and behavioral aspects
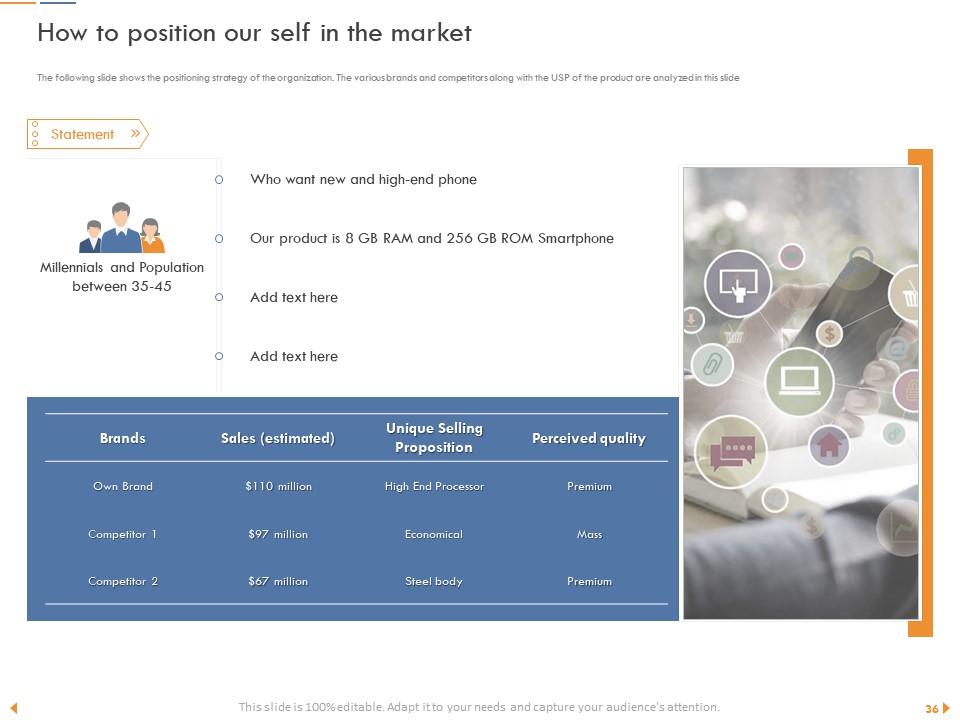
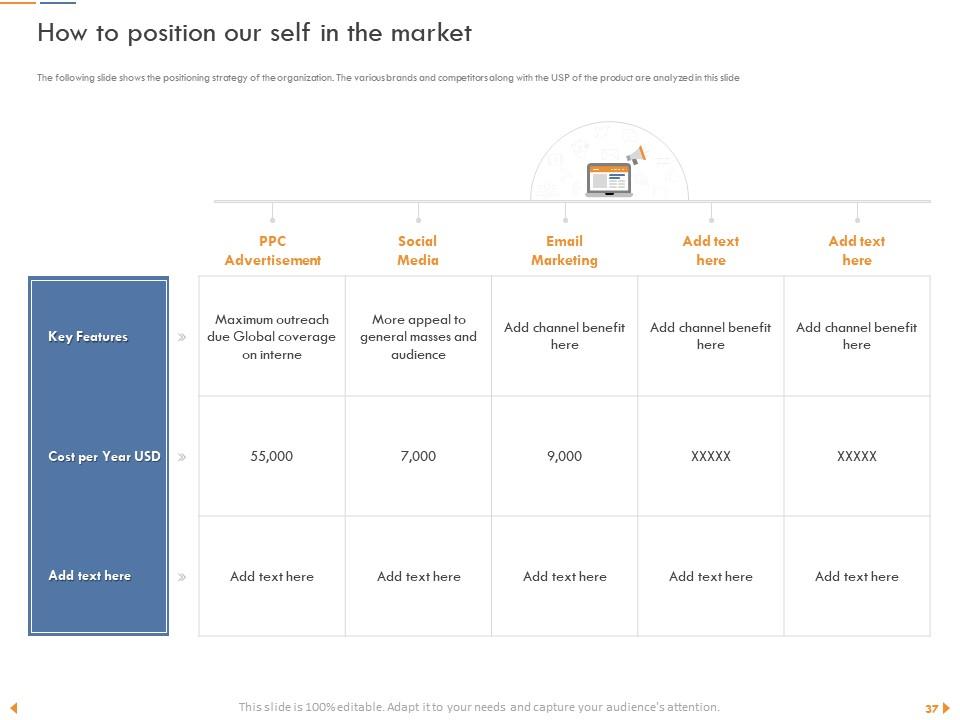
Slide 36: The following slide shows the positioning strategy of the organization. The various brands and competitors along with the USP of the product are analyzed in this slide
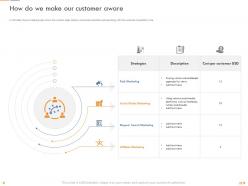
Slide 37: This slide Describes and analyze the marketing communication channel that will be used by company
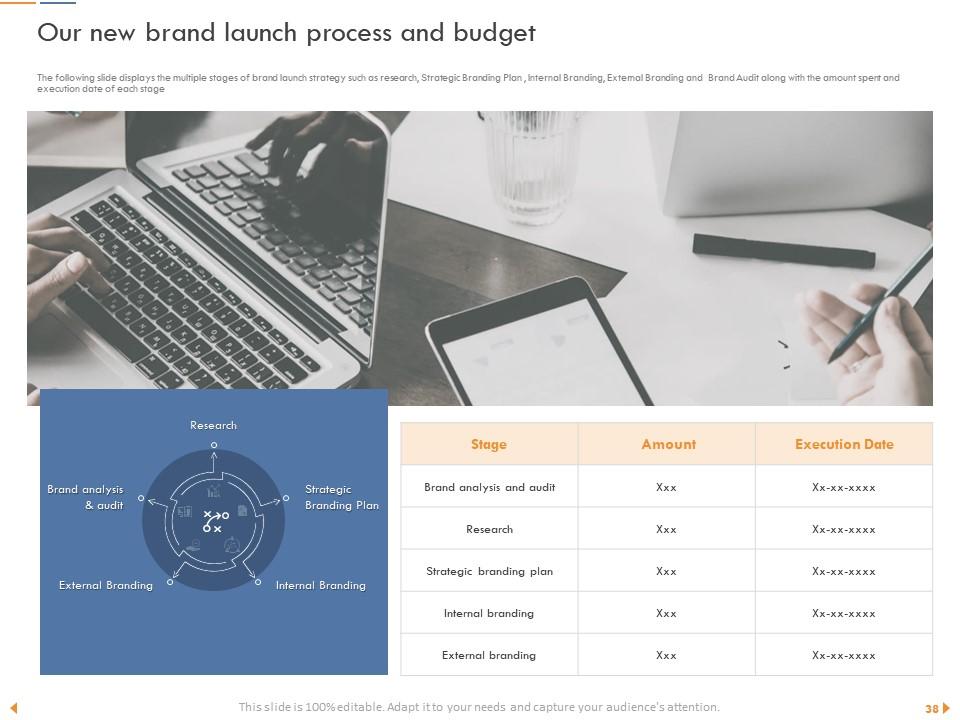
Slide 38: The following slide displays the multiple stages of brand launch strategy such as research, Strategic Branding Plan , Internal Branding, External Branding and Brand Audit along with the amount spent and execution date of each stage
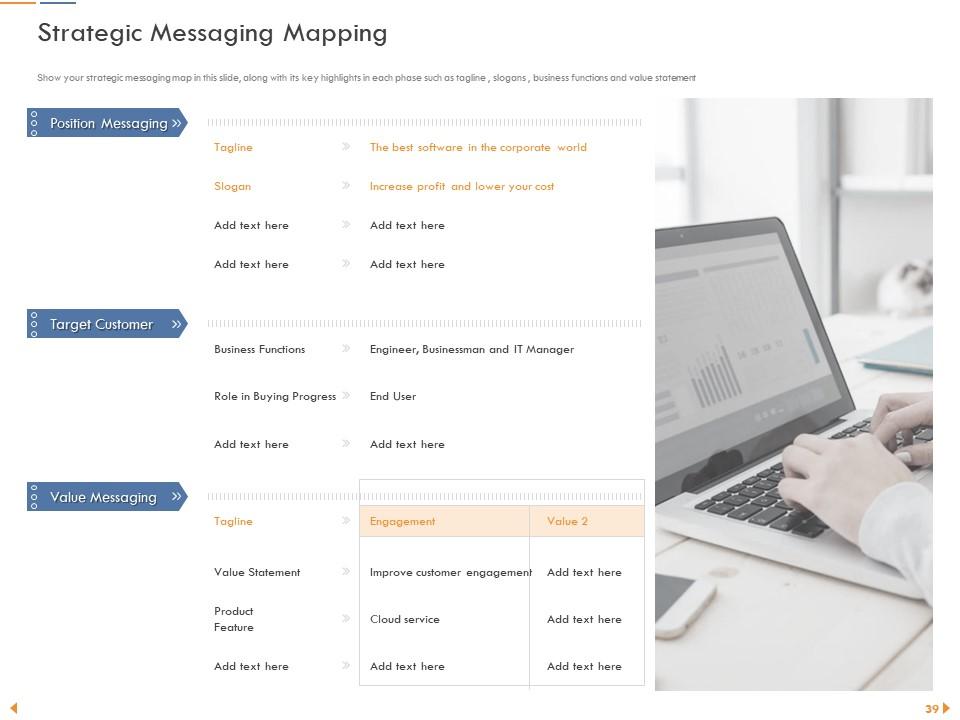
Slide 39: This slide showcases Strategic Messaging Mapping
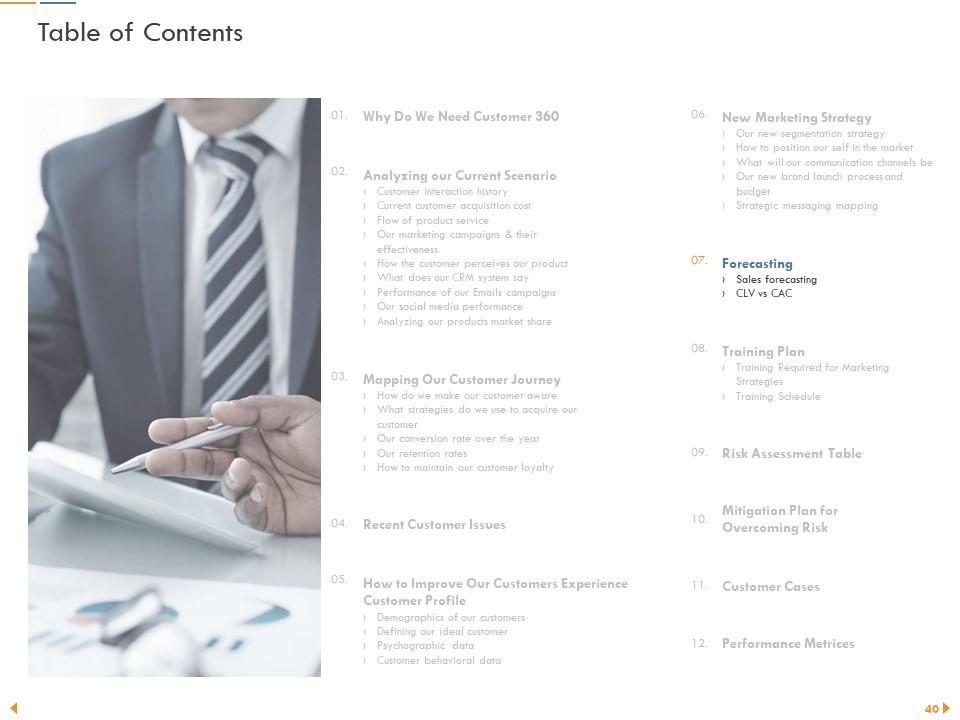
Slide 40: This slide shows Table of Contents.
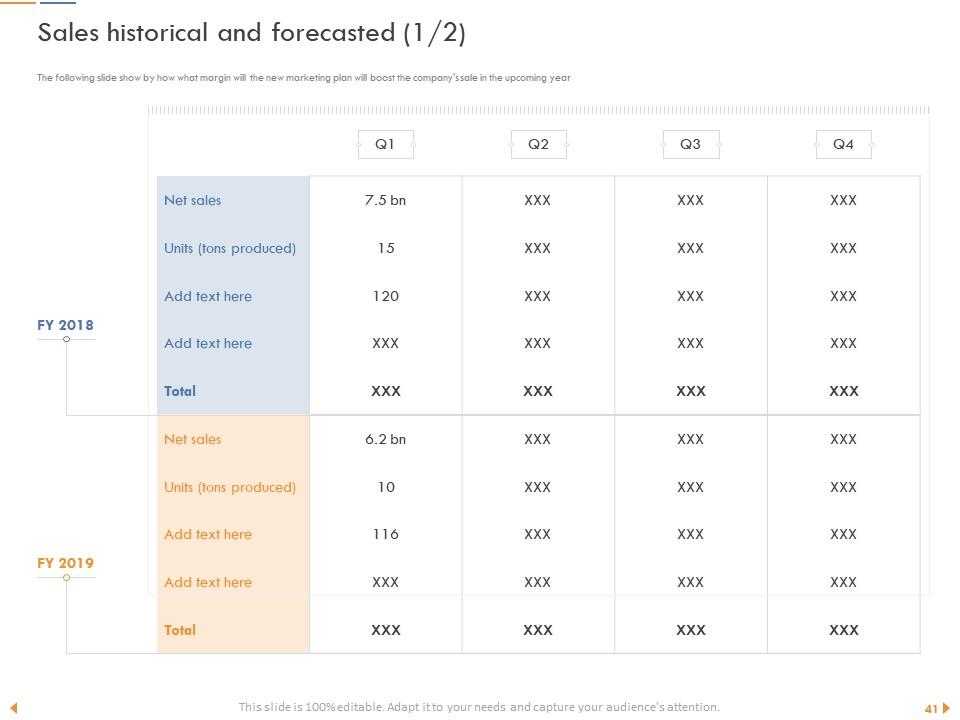
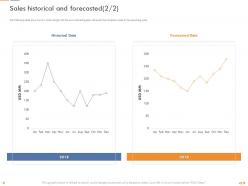
Slide 41: The following slide show by how what margin will the new marketing plan will boost the company's sale in the upcoming year
Slide 42: The following slide show by how what margin will the new marketing plan will boost the company's sale in the upcoming year
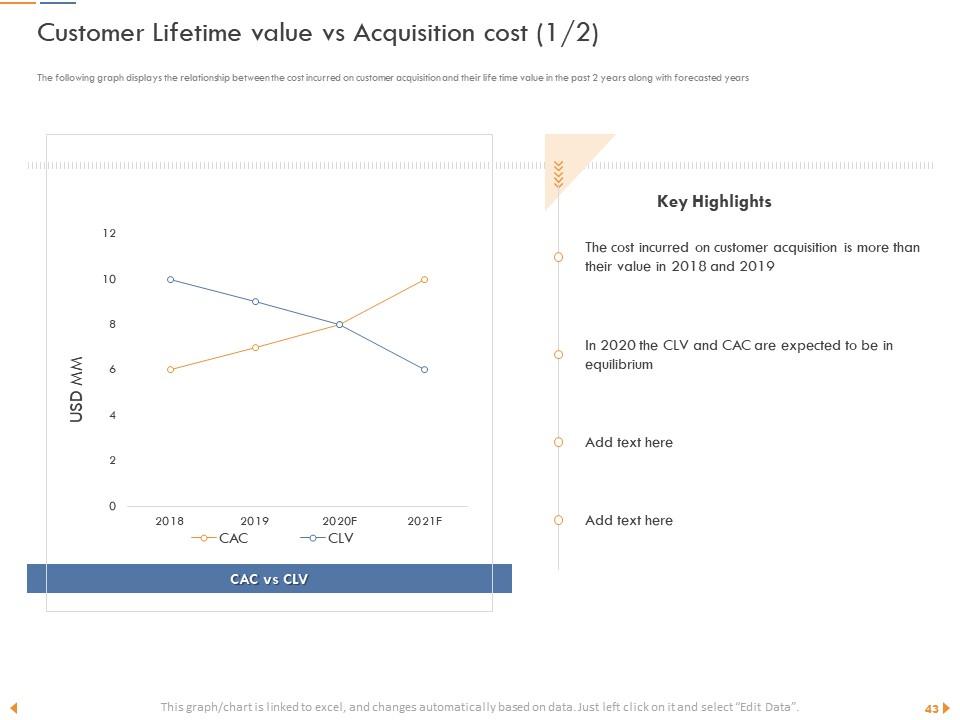
Slide 43: The following graph displays the relationship between the cost incurred on customer acquisition and their life time value in the past 2 years along with forecasted years
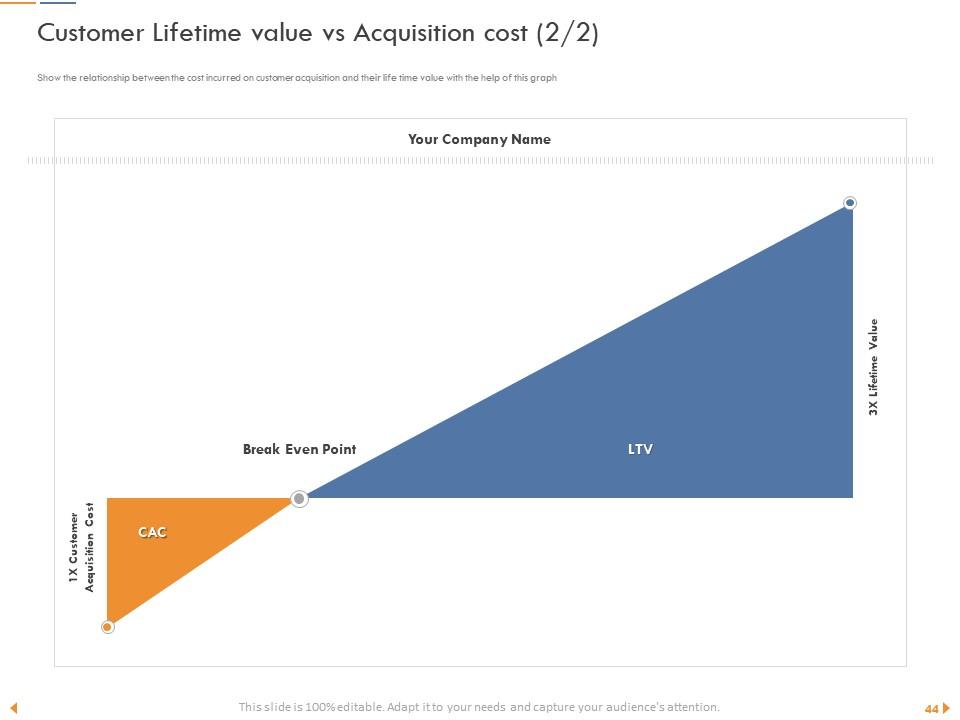
Slide 44: This slide depicts Customer Lifetime value vs Acquisition cost.
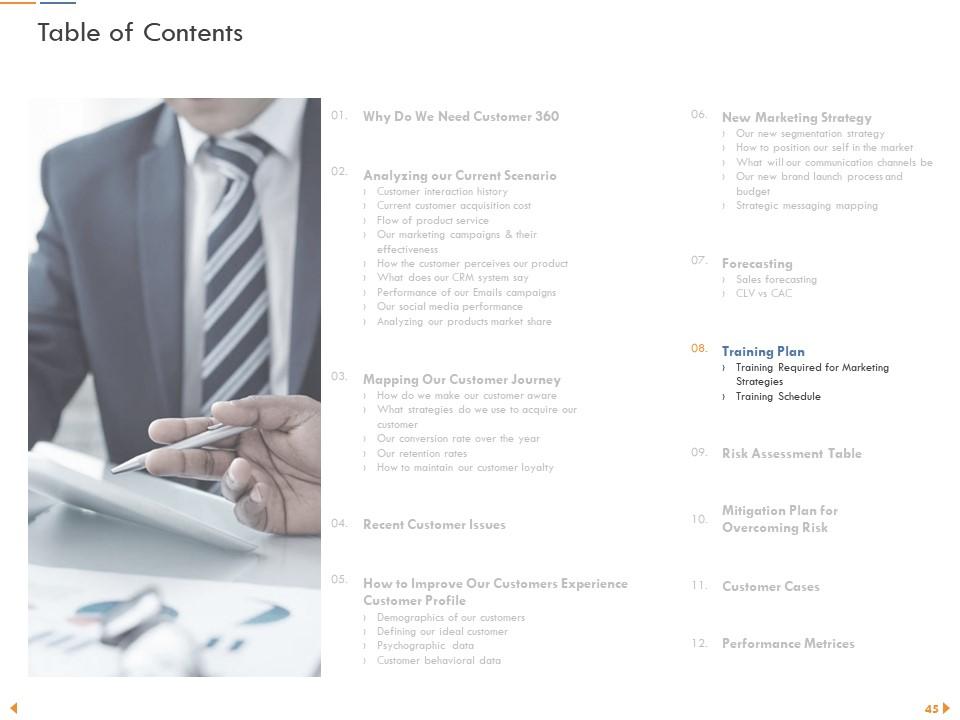
Slide 45: This slide displays Table of Contents
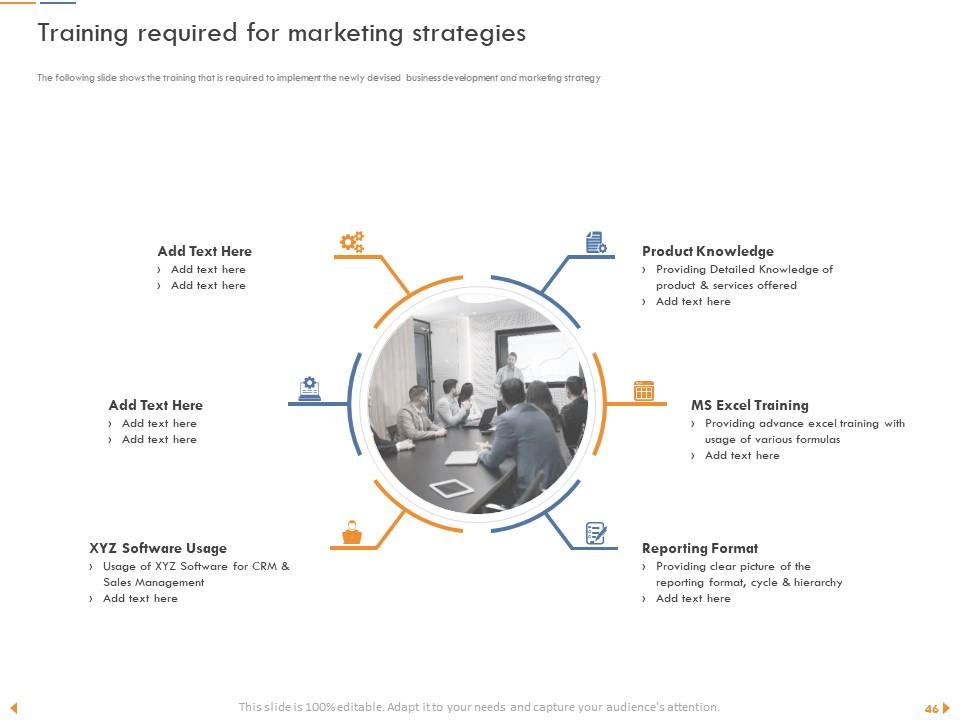
Slide 46: The following slide shows the training that is required to implement the newly devised business development and marketing strategy
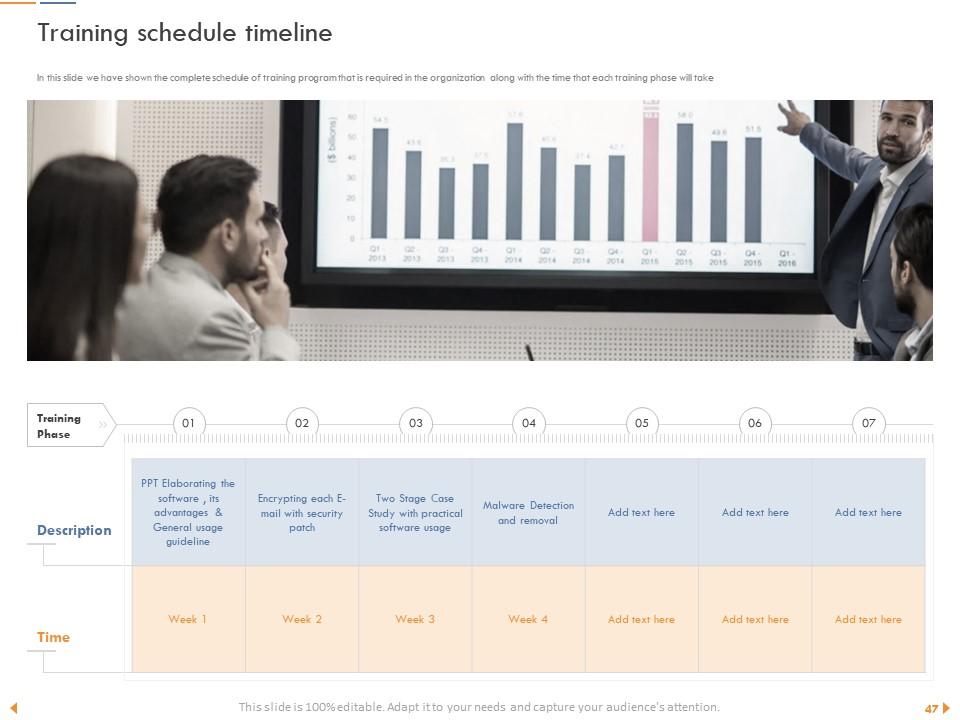
Slide 47: In this slide we have shown the complete schedule of training program that is required in the organization along with the time that each training phase will take
Slide 48: This slide displays Table of Contents.
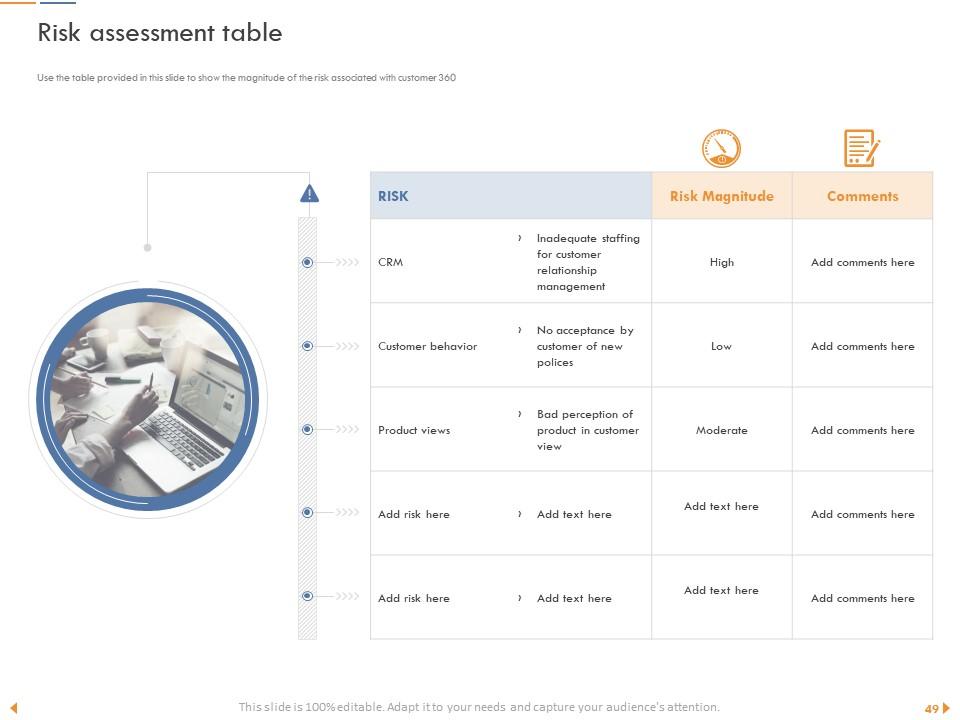
Slide 49: This slide presents Risk assessment table. Use the table provided in this slide to show the magnitude of the risk associated with customer 360
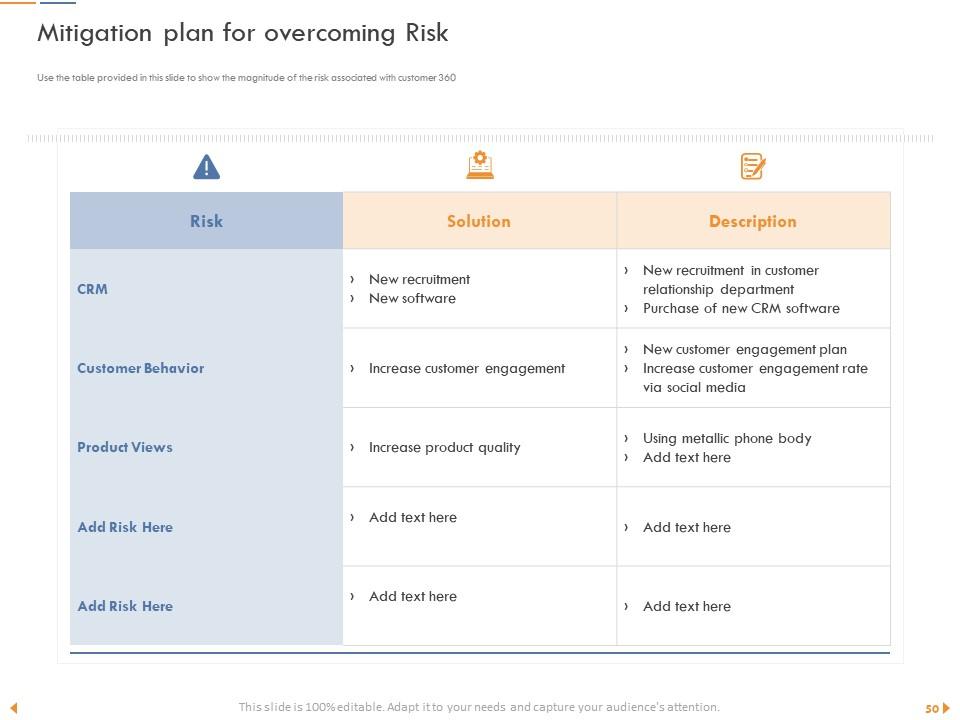
Slide 50: This slide shows Mitigation plan for overcoming Risk. Use the table provided in this slide to show the magnitude of the risk associated with customer 360
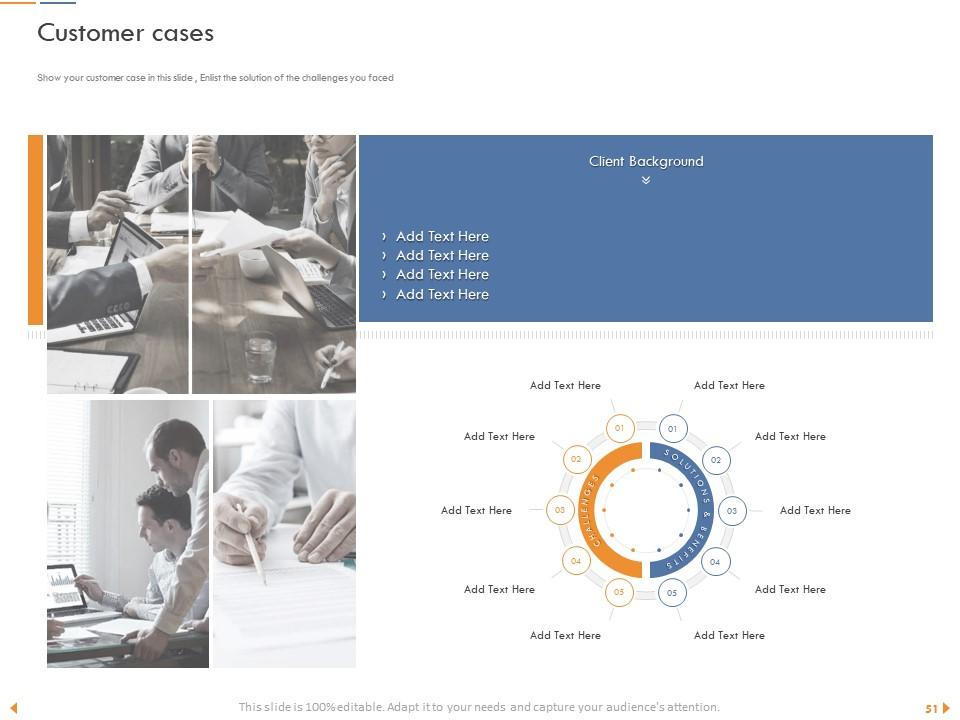
Slide 51: Use this slide to Show your customer case, Enlist the solution of the challenges you faced
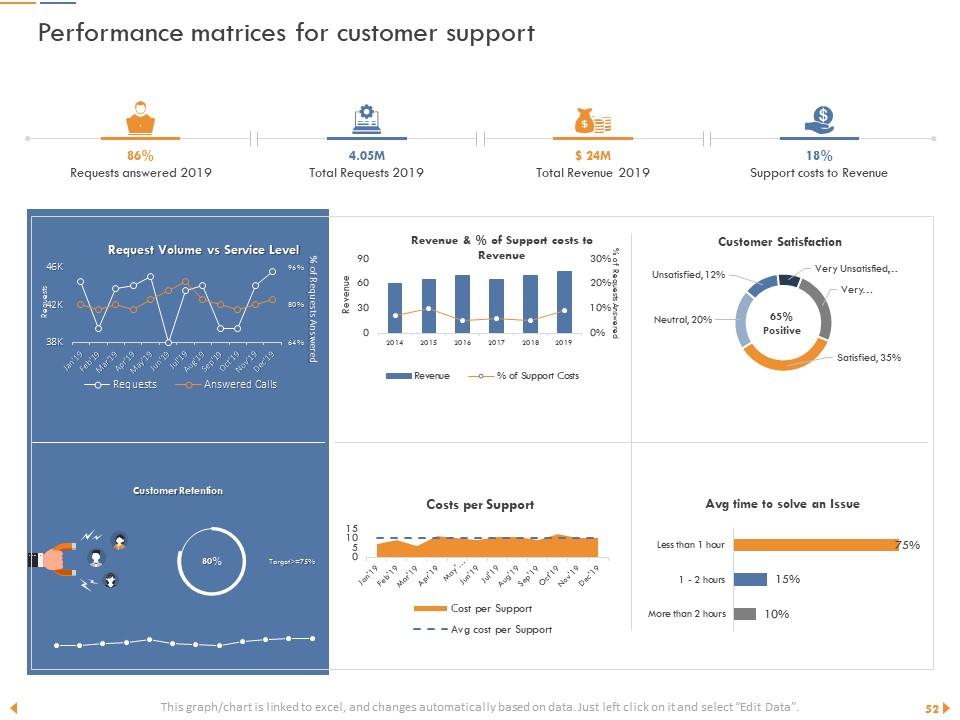
Slide 52: This slide shows Performance matrices for customer support.
Slide 53: This slide reminds about Coffee break.
Slide 54: This is Customer Churn Analysis Icons Slide.
Slide 55: This slide is titled as Additional Slides for moving forward.
Slide 56: This is About Us slide to showcase Company specifications.
Slide 57: This slide displays Our Mission, Vision and Goals.
Slide 58: This is Our Team slide with Names and Designations.
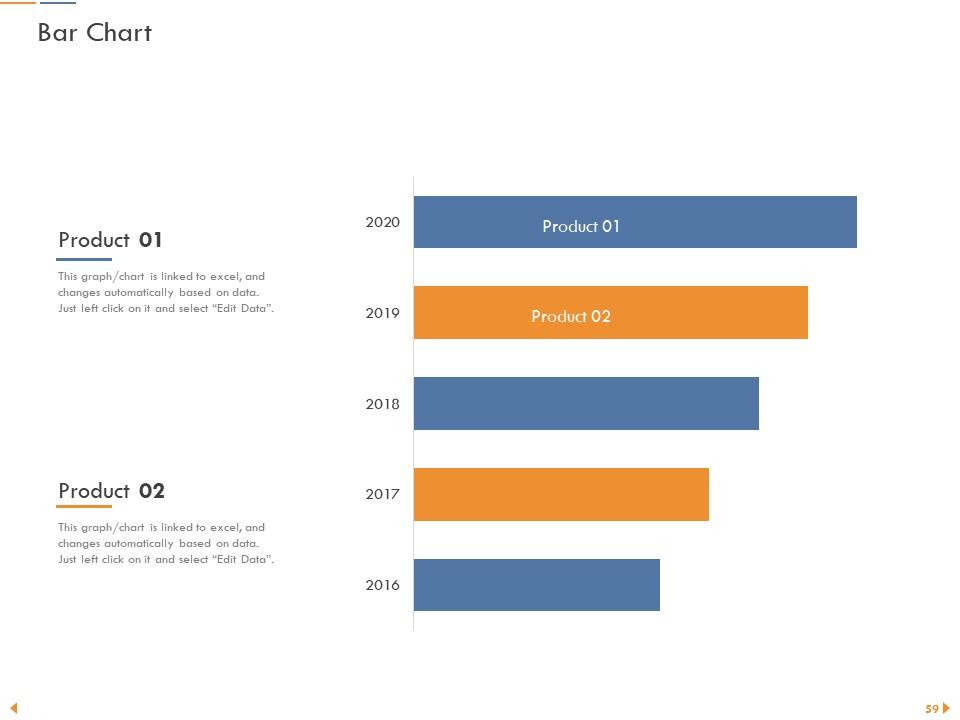
Slide 59: This slide shows Bar Chart for comparison of products.
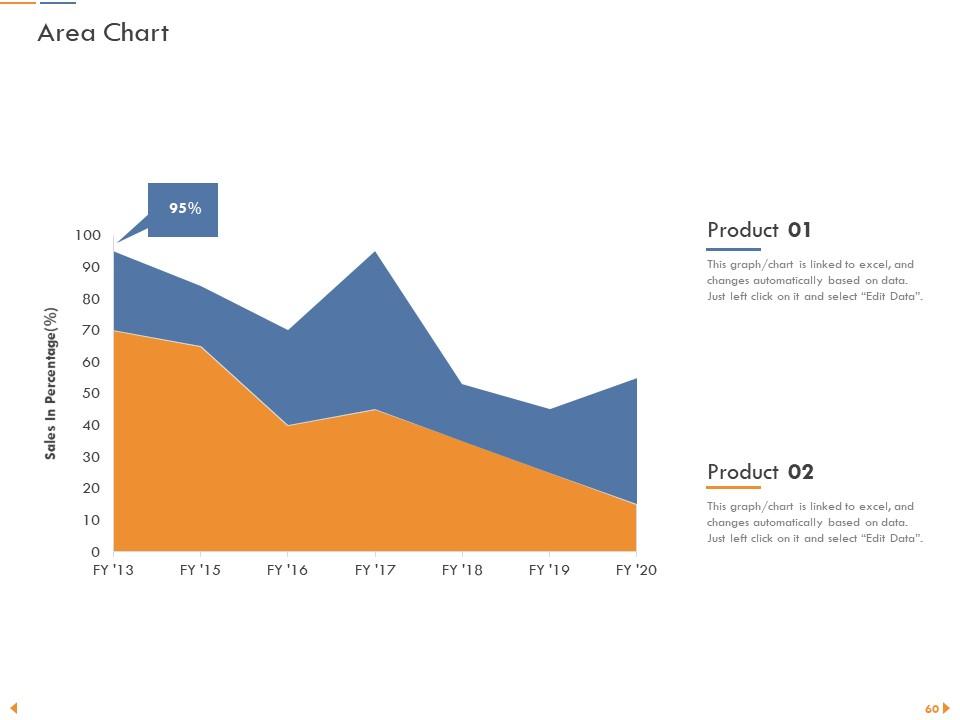
Slide 60: This slide displays Area Chart.
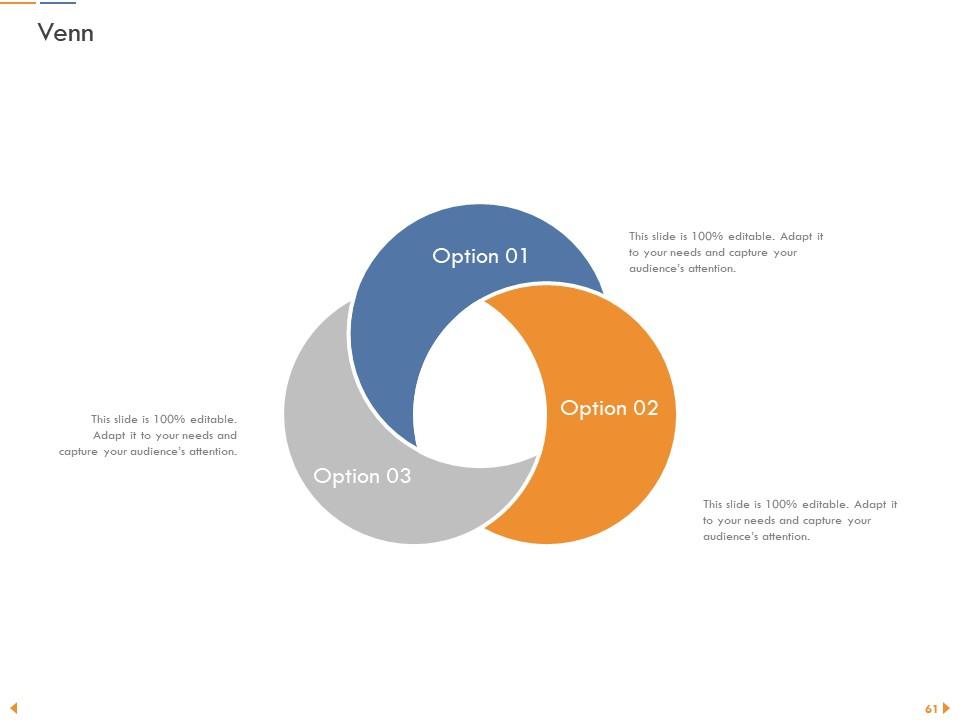
Slide 61: This is Venn slide.
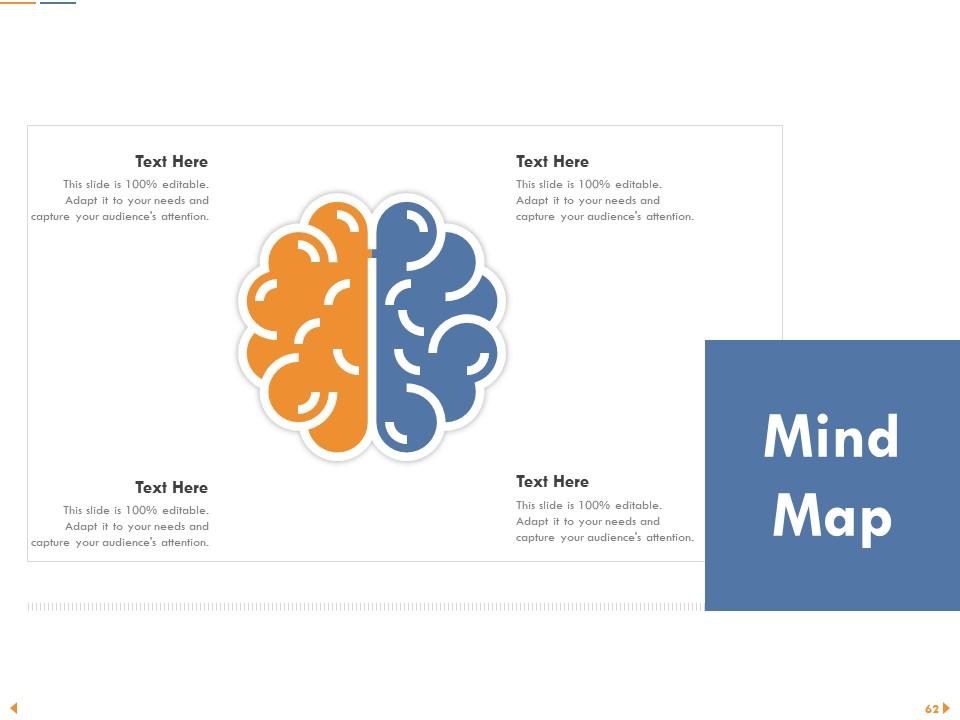
Slide 62: This slide represents Mind Map for showing entities.
Slide 63: This slide displays Puzzle
Slide 64: This is Thank You slide with Contact details.
Customer Churn Analysis Powerpoint Presentation Slides with all 64 slides:
Use our Customer Churn Analysis Powerpoint Presentation Slides to effectively help you save your valuable time. They are readymade to fit into any presentation structure.
-
Presentation Design is very nice, good work with the content as well.


