Customer data analytics tools comparison matrix
The SlideTeam team is excited to release our newest data analytics comparison matrix. This document will help you choose the best tool for your needs based on a variety of factors such as pricing, features, and integrations. We’ve included some of the top tools in the industry so that you can make an informed decision about which one is right for your business. Download these amazing set of data analytics powerpoint templates now to get started with turning your data into insights.
- Google Slides is a new FREE Presentation software from Google.
- All our content is 100% compatible with Google Slides.
- Just download our designs, and upload them to Google Slides and they will work automatically.
- Amaze your audience with SlideTeam and Google Slides.
-
Want Changes to This PPT Slide? Check out our Presentation Design Services
- WideScreen Aspect ratio is becoming a very popular format. When you download this product, the downloaded ZIP will contain this product in both standard and widescreen format.
-

- Some older products that we have may only be in standard format, but they can easily be converted to widescreen.
- To do this, please open the SlideTeam product in Powerpoint, and go to
- Design ( On the top bar) -> Page Setup -> and select "On-screen Show (16:9)” in the drop down for "Slides Sized for".
- The slide or theme will change to widescreen, and all graphics will adjust automatically. You can similarly convert our content to any other desired screen aspect ratio.
Compatible With Google Slides

Get This In WideScreen
You must be logged in to download this presentation.
PowerPoint presentation slides
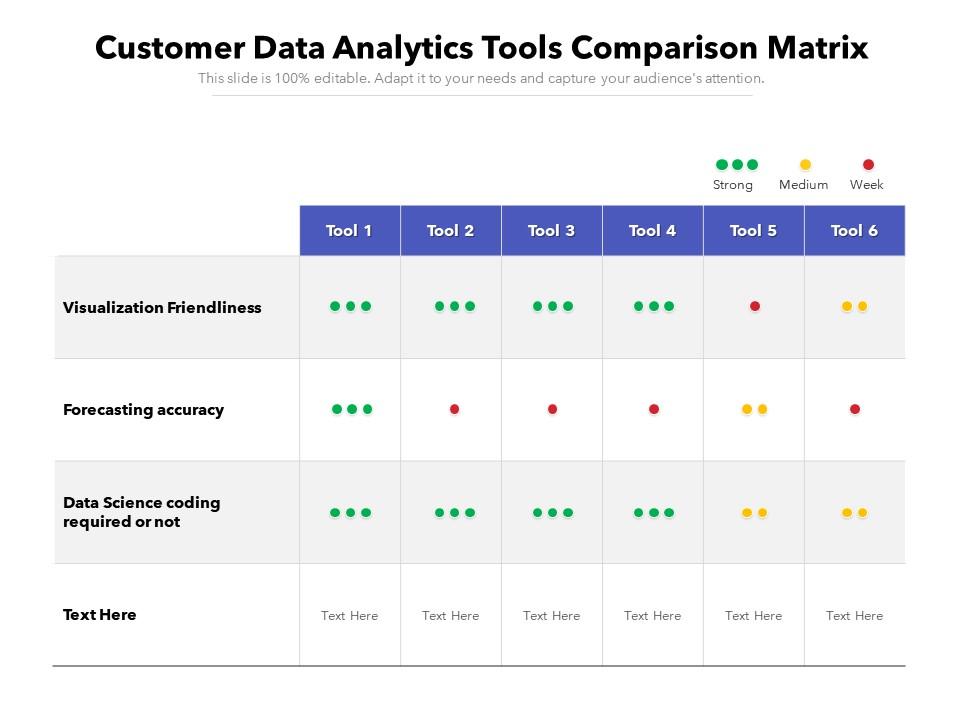
Presenting this set of slides with name Customer Data Analytics Tools Comparison Matrix. The topics discussed in these slides are Visualization Friendliness, Forecasting Accuracy, Data Science Coding. This is a completely editable PowerPoint presentation and is available for immediate download. Download now and impress your audience.
People who downloaded this PowerPoint presentation also viewed the following :
Content of this Powerpoint Presentation
Description:
The image displays a PowerPoint slide titled "Customer Data Analytics Tools Comparison Matrix". The matrix compares six different tools based on three criteria:
1. Visualization Friendliness:
Assesses how user-friendly the data visualization capabilities of the tools are.
2. Forecasting Accuracy:
Evaluates the precision with which the tools can forecast data trends.
3. Data Science Coding Required or Not:
Indicates whether the use of the tools requires knowledge of data science coding.
Each criterion has a row, and each tool has a column. The assessment is represented by colored dots, where green indicates strong capability, yellow medium, and red weak.
Use Cases:
Industries that can utilize this type of comparison matrix include:
1. E-commerce:
Use: To analyze customer behavior and sales data.
Presenter: Data Analyst.
Audience: Marketing team, strategic planners.
2. Finance:
Use: For evaluating tools to predict market trends and customer credit risk.
Presenter: Financial Data Scientist.
Audience: Risk management, investment strategists.
3. Healthcare:
Use: To select tools for patient data analysis and forecast healthcare outcomes.
Presenter: Health Informatics Specialist.
Audience: Hospital administrators, medical researchers.
4. Retail:
Use: To choose analytics tools for inventory management and customer purchase patterns.
Presenter: Retail Analyst.
Audience: Inventory managers, retail strategists.
5. Telecommunications:
Use: For determining the best tools to analyze customer usage data and network performance.
Presenter: Telecom Data Engineer.
Audience: Network operations, customer service managers.
6. Marketing and Advertising:
Use: To assess tools for campaign performance and consumer engagement.
Presenter: Marketing Manager.
Audience: Creative directors, campaign managers.
7. Manufacturing:
Use: To analyze supply chain efficiency and product demand forecasting.
Presenter: Operations Analyst.
Audience: Supply chain management, production planners.
Customer data analytics tools comparison matrix with all 2 slides:
Use our Customer Data Analytics Tools Comparison Matrix to effectively help you save your valuable time. They are readymade to fit into any presentation structure.
-
Wonderful templates design to use in business meetings.
-
Really like the color and design of the presentation.
-
Easily Understandable slides.
-
Attractive design and informative presentation.
-
Qualitative and comprehensive slides.
-
Awesome presentation, really professional and easy to edit.
-
Amazing product with appealing content and design.


