Dashboard To Measure Business Performance Guide To Introduce New Product Portfolio In The Target Region
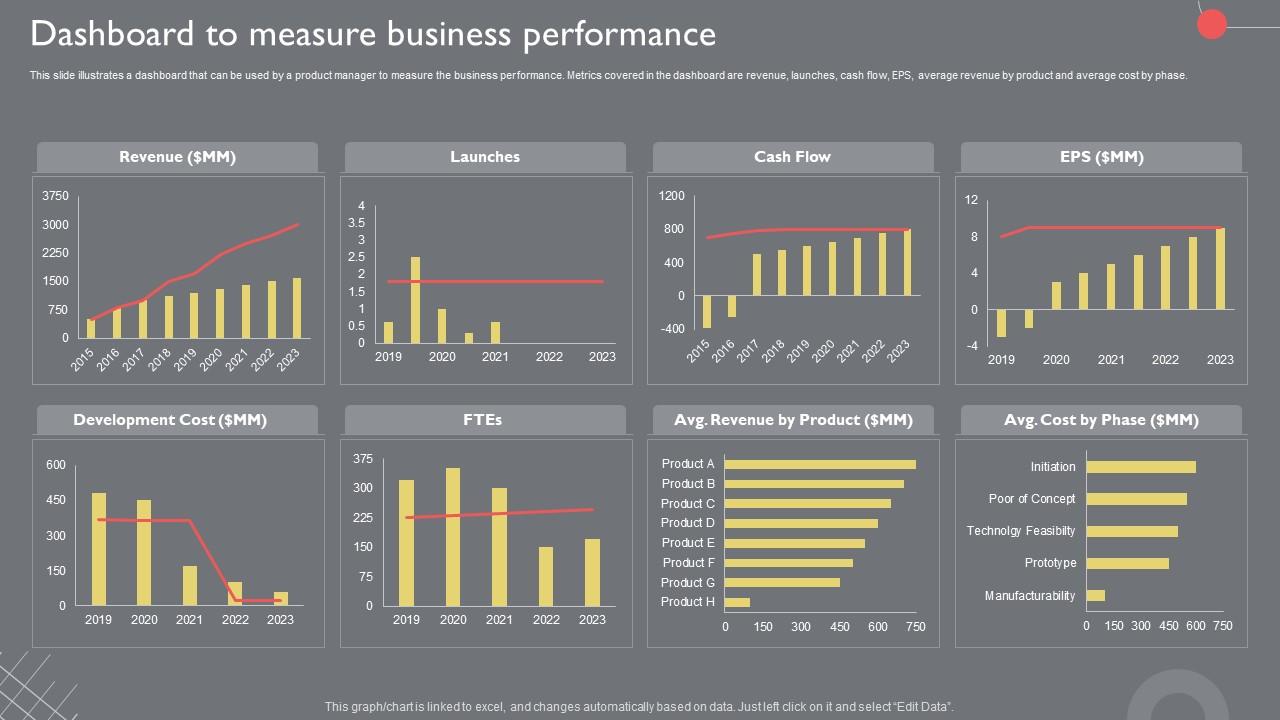
This slide illustrates a dashboard that can be used by a product manager to measure the business performance. Metrics covered in the dashboard are revenue, launches, cash flow, EPS, average revenue by product and average cost by phase.
This slide illustrates a dashboard that can be used by a product manager to measure the business performance. Metrics cover..
- Google Slides is a new FREE Presentation software from Google.
- All our content is 100% compatible with Google Slides.
- Just download our designs, and upload them to Google Slides and they will work automatically.
- Amaze your audience with SlideTeam and Google Slides.
-
Want Changes to This PPT Slide? Check out our Presentation Design Services
- WideScreen Aspect ratio is becoming a very popular format. When you download this product, the downloaded ZIP will contain this product in both standard and widescreen format.
-

- Some older products that we have may only be in standard format, but they can easily be converted to widescreen.
- To do this, please open the SlideTeam product in Powerpoint, and go to
- Design ( On the top bar) -> Page Setup -> and select "On-screen Show (16:9)” in the drop down for "Slides Sized for".
- The slide or theme will change to widescreen, and all graphics will adjust automatically. You can similarly convert our content to any other desired screen aspect ratio.
Compatible With Google Slides

Get This In WideScreen
You must be logged in to download this presentation.
PowerPoint presentation slides
This slide illustrates a dashboard that can be used by a product manager to measure the business performance. Metrics covered in the dashboard are revenue, launches, cash flow, EPS, average revenue by product and average cost by phase. Deliver an outstanding presentation on the topic using this Dashboard To Measure Business Performance Guide To Introduce New Product Portfolio In The Target Region. Dispense information and present a thorough explanation of Development Cost, Revenue, Cash Flow using the slides given. This template can be altered and personalized to fit your needs. It is also available for immediate download. So grab it now.
People who downloaded this PowerPoint presentation also viewed the following :
Dashboard To Measure Business Performance Guide To Introduce New Product Portfolio In The Target Region with all 7 slides:
Use our Dashboard To Measure Business Performance Guide To Introduce New Product Portfolio In The Target Region to effectively help you save your valuable time. They are readymade to fit into any presentation structure.
-
I was never satisfied with my own presentation design but SlideTeam has solved that problem for me. Thank you SlideTeam!
-
These stunning templates can help you create a presentation like a pro.


