Data Statistics PowerPoint Templates, PowerPoint Statistics Slides
- Sub Categories
-
- Agriculture
- Chemicals and Resources
- Construction
- Consumer Goods and FMCG
- E-Commerce
- Energy and Environmental Services
- Finance Insurance and Real Estate
- Health and Pharmaceuticals
- Internet
- Life
- Media and Advertising
- Metals and Electronics
- Retail and Trade
- Services
- Society
- Sports and Recreation
- Survey
- Technology and Telecommunications
- Transportation and Logistics
- Travel Tourism and Hospitality
- USA
-
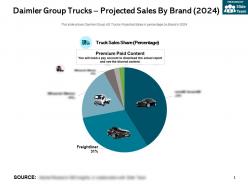 Daimler group trucks projected sales by brand 2024
The information presented in this slide has been researched by our team of professional business analysts. This is part of our Company Profiles products selection, and you will need a Paid account to download the actual report with accurate data and sources. Downloaded report will be in Powerpoint and will contain the actual editable slides with the actual data and sources for each data. This slide shows Daimler Group AG Trucks Projected Sales in percentage by Brand in 2024. Download it immediately and use it for your business.
-
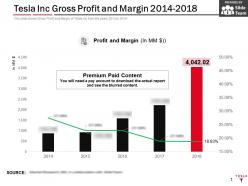 Tesla inc gross profit and margin 2014-2018
This is a professionally designed visual chart for Tesla Inc Gross Profit And Margin 2014 to 2018. This is part of our Data and Statistics products selection, and you will need a Paid account to download the actual report with accurate data and sources. Downloaded report will contain the editable graph with accurate data, an excel table with the actual data, the exact source of the data and the release date. This slide shows Gross Profit and Margin of Tesla Inc from the years 2014 to 2018. Download it immediately and use it for your business.
-
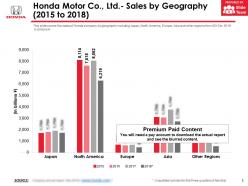 Honda motor co ltd sales by geography 2015-2018
This is a professionally designed visual chart for Honda Motor Co Ltd Sales By Geography 2015 to 2018. This is part of our Data and Statistics products selection, and you will need a Paid account to download the actual report with accurate data and sources. Downloaded report will contain the editable graph with accurate data, an excel table with the actual data, the exact source of the data and the release date. This slide covers the sales of Honda company by geography including Japan, North America, Europe, Asia and other regions from 2015 to 2018 in billions JPY. Download it immediately and use it for your business.
-
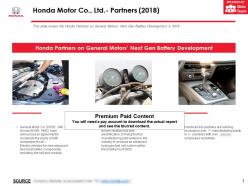 Honda motor co ltd partners 2018
The information presented in this slide has been researched by our team of professional business analysts. This is part of our Company Profiles products selection, and you will need a Paid account to download the actual report with accurate data and sources. Downloaded report will be in Powerpoint and will contain the actual editable slides with the actual data and sources for each data. This slide covers the Honda Partners on General Motors Next Gen Battery Development in 2018. Download it immediately and use it for your business.
-
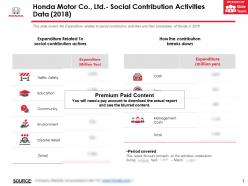 Honda motor co ltd social contribution activities data 2018
The information presented in this slide has been researched by our team of professional business analysts. This is part of our Company Profiles products selection, and you will need a Paid account to download the actual report with accurate data and sources. Downloaded report will be in Powerpoint and will contain the actual editable slides with the actual data and sources for each data. This slide covers the Expenditure related to social contribution activities and their breakdown of Honda in 2018. Download it immediately and use it for your business.
-
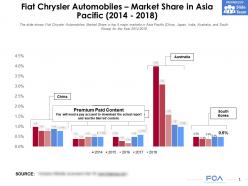 Fiat chrysler automobiles market share in asia pacific 2014-2018
This is a professionally designed visual chart for Fiat Chrysler Automobiles Market Share In Asia Pacific 2014 to 2018. This is part of our Data and Statistics products selection, and you will need a Paid account to download the actual report with accurate data and sources. Downloaded report will contain the editable graph with accurate data, an excel table with the actual data, the exact source of the data and the release date. The slide shows Fiat Chrysler Automobiles Market Share in top 5 major markets in Asia Pacific China, Japan, India, Australia, and South Korea for the Year 2014 to 2018. Download it immediately and use it for your business.
-
 Fiat chrysler automobiles market share in brazil 2014-2018
This is a professionally designed visual chart for Fiat Chrysler Automobiles Market Share In Brazil 2014 to 2018. This is part of our Data and Statistics products selection, and you will need a Paid account to download the actual report with accurate data and sources. Downloaded report will contain the editable graph with accurate data, an excel table with the actual data, the exact source of the data and the release date. The slide shows Fiat Chrysler Automobiles Market Share in Brazil Comparing to its competitors in the market General Motors, Volkswagen and Ford for the Year 2014 to 2018. Download it immediately and use it for your business.
-
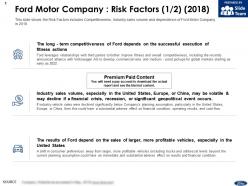 Ford motor company risk factors 2018
The information presented in this slide has been researched by our team of professional business analysts. This is part of our Company Profiles products selection, and you will need a Paid account to download the actual report with accurate data and sources. Downloaded report will be in Powerpoint and will contain the actual editable slides with the actual data and sources for each data. This slide shows the Risk Factors includes Competitiveness, Industry sales volume and dependence of Ford Motor Company in 2018. Download it immediately and use it for your business.
-
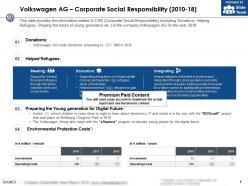 Volkswagen ag corporate social responsibility 2010-18
The information presented in this slide has been researched by our team of professional business analysts. This is part of our Company Profiles products selection, and you will need a Paid account to download the actual report with accurate data and sources. Downloaded report will be in Powerpoint and will contain the actual editable slides with the actual data and sources for each data. This slide provides the information related to CSR Corporate Social Responsibility including Donations, Helping Refugees, Shaping the future of young generation etc. of the company Volkswagen AG for the year 2018. Download it immediately and use it for your business.
-
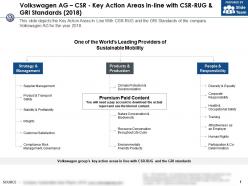 Volkswagen ag csr key action areas in line with csr rug and gri standards 2018
The information presented in this slide has been researched by our team of professional business analysts. This is part of our Company Profiles products selection, and you will need a Paid account to download the actual report with accurate data and sources. Downloaded report will be in Powerpoint and will contain the actual editable slides with the actual data and sources for each data. This slide depicts the Key Action Areas In Line With CSR RUG and the GRI Standards of the company Volkswagen AG for the year 2018. Download it immediately and use it for your business.
-
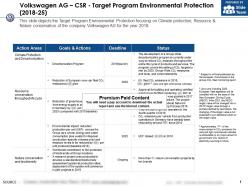 Volkswagen ag csr target program environmental protection 2018-25
The information presented in this slide has been researched by our team of professional business analysts. This is part of our Company Profiles products selection, and you will need a Paid account to download the actual report with accurate data and sources. Downloaded report will be in Powerpoint and will contain the actual editable slides with the actual data and sources for each data. This slide depicts the Target Program Environmental Protection focusing on Climate protection, Resource and Nature conservation of the company Volkswagen AG for the year 2018. Download it immediately and use it for your business.
-
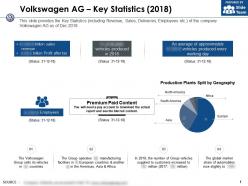 Volkswagen ag key statistics 2018
The information presented in this slide has been researched by our team of professional business analysts. This is part of our Company Profiles products selection, and you will need a Paid account to download the actual report with accurate data and sources. Downloaded report will be in Powerpoint and will contain the actual editable slides with the actual data and sources for each data. This slide provides the Key Statistics including Revenue, Sales, Deliveries, Employees etc. of the company Volkswagen AG as of Dec 2018. Download it immediately and use it for your business.
-
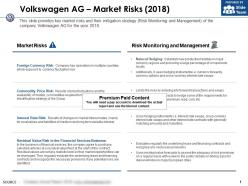 Volkswagen ag market risks 2018
The information presented in this slide has been researched by our team of professional business analysts. This is part of our Company Profiles products selection, and you will need a Paid account to download the actual report with accurate data and sources. Downloaded report will be in Powerpoint and will contain the actual editable slides with the actual data and sources for each data. This slide provides key market risks and their mitigation strategy Risk Monitoring and Management of the company Volkswagen AG for the year 2018. Download it immediately and use it for your business.
-
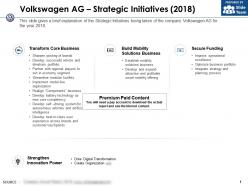 Volkswagen ag strategic initiatives 2018
The information presented in this slide has been researched by our team of professional business analysts. This is part of our Company Profiles products selection, and you will need a Paid account to download the actual report with accurate data and sources. Downloaded report will be in Powerpoint and will contain the actual editable slides with the actual data and sources for each data. This slide gives a brief explanation of the Strategic Initiatives being taken of the company Volkswagen AG for the year 2018. Download it immediately and use it for your business.
-
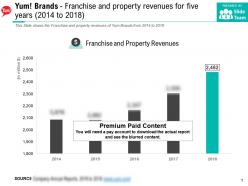 Yum brands franchise and property revenues for five years 2014-2018
This is a professionally designed visual chart for Yum Brands Franchise And Property Revenues For Five Years 2014 to 2018. This is part of our Data and Statistics products selection, and you will need a Paid account to download the actual report with accurate data and sources. Downloaded report will contain the editable graph with accurate data, an excel table with the actual data, the exact source of the data and the release date. This Slide shows the Franchise and property revenues of Yum Brands from 2014 to 2018. Download it immediately and use it for your business.
-
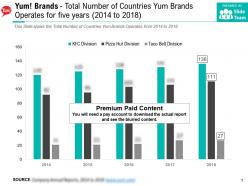 Yum brands total number of countries yum brands operates for five years 2014-2018
This is a professionally designed visual chart for Yum Brands Total Number Of Countries Yum Brands Operates For Five Years 2014 to 2018. This is part of our Data and Statistics products selection, and you will need a Paid account to download the actual report with accurate data and sources. Downloaded report will contain the editable graph with accurate data, an excel table with the actual data, the exact source of the data and the release date. This Slide shows the Total Number of Countries Yum Brands Operates from 2014 to 2018. Download it immediately and use it for your business.
-
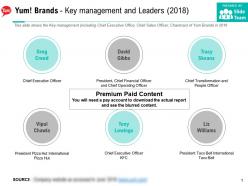 Yum brands key management and leaders 2018
The information presented in this slide has been researched by our team of professional business analysts. This is part of our Company Profiles products selection, and you will need a Paid account to download the actual report with accurate data and sources. Downloaded report will be in Powerpoint and will contain the actual editable slides with the actual data and sources for each data. This slide shows the Key management including Chief Executive Office, Chief Sales Officer, Chairman of Yum Brands in 2018. Download it immediately and use it for your business.
-
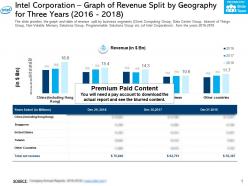 Intel corporation graph of revenue split by geography for three years 2016-2018
This is a professionally designed visual chart for Intel Corporation Graph Of Revenue Split By Geography For Three Years 2016 to 2018. This is part of our Data and Statistics products selection, and you will need a Paid account to download the actual report with accurate data and sources. Downloaded report will contain the editable graph with accurate data, an excel table with the actual data, the exact source of the data and the release date. The slide provides the graph and table of revenue split by business segments Client Computing Group Data Center Group Internet of Things Group Non-Volatile Memory Solutions Group Programmable Solutions Group etc of Intel Corporations from the years 2016 to 2018. Download it immediately and use it for your business.
-
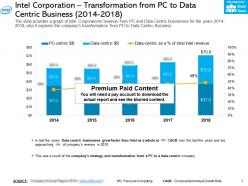 Intel corporation transformation from pc to data centric business 2014-2018
This is a professionally designed visual chart for Intel Corporation Transformation From Pc To Data Centric Business 2014 to 2018. This is part of our Data and Statistics products selection, and you will need a Paid account to download the actual report with accurate data and sources. Downloaded report will contain the editable graph with accurate data, an excel table with the actual data, the exact source of the data and the release date. The slide provides a graph of Intel Corporations revenue from PC and Data Centric businesses for the years 2014 to 2018 also it explains the companys transformation from PC to Data Centric Business. Download it immediately and use it for your business.
-
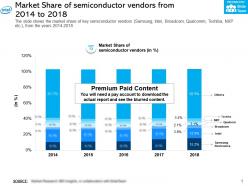 Market share of semiconductor vendors from 2014-2018
This is a professionally designed visual chart for Market Share Of Semiconductor Vendors From 2014 to 2018. This is part of our Data and Statistics products selection, and you will need a Paid account to download the actual report with accurate data and sources. Downloaded report will contain the editable graph with accurate data, an excel table with the actual data, the exact source of the data and the release date. The slide shows the market share of key semiconductor vendors Samsung, Intel Broadcom Qualcomm Toshiba NXP etc from the years 2014 to 2018. Download it immediately and use it for your business.
-
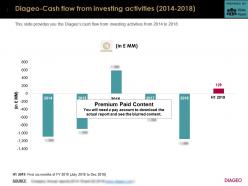 Diageo cash flow from investing activities 2014-2018
This is a professionally designed visual chart for Diageo Cash Flow From Investing Activities 2014 to 2018. This is part of our Data and Statistics products selection, and you will need a Paid account to download the actual report with accurate data and sources. Downloaded report will contain the editable graph with accurate data, an excel table with the actual data, the exact source of the data and the release date. This slide provides you the Diageos cash flow from investing activities from 2014 to 2018. Download it immediately and use it for your business.
-
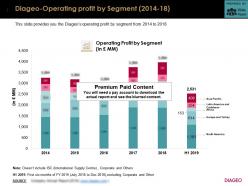 Diageo operating profit by segment 2014-18
This is a professionally designed visual chart for Diageo Operating Profit By Segment 2014 to 18. This is part of our Data and Statistics products selection, and you will need a Paid account to download the actual report with accurate data and sources. Downloaded report will contain the editable graph with accurate data, an excel table with the actual data, the exact source of the data and the release date. This slide provides you the Diageos operating profit by segment from 2014 to 2018. Download it immediately and use it for your business.
-
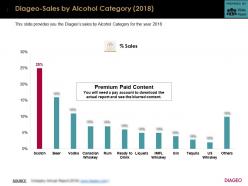 Diageo sales by alcohol category 2018
This is a professionally designed visual chart for Diageo Sales By Alcohol Category 2018. This is part of our Data and Statistics products selection, and you will need a Paid account to download the actual report with accurate data and sources. Downloaded report will contain the editable graph with accurate data, an excel table with the actual data, the exact source of the data and the release date. This slide provides you the Diageos sales by Alcohol Category for the year 2018. Download it immediately and use it for your business.
-
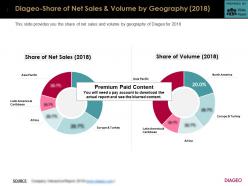 Diageo share of net sales and volume by geography 2018
This is a professionally designed visual chart for Diageo Share Of Net Sales And Volume By Geography 2018. This is part of our Data and Statistics products selection, and you will need a Paid account to download the actual report with accurate data and sources. Downloaded report will contain the editable graph with accurate data, an excel table with the actual data, the exact source of the data and the release date. This slide provides you the share of net sales and volume by geography of Diageo for 2018. Download it immediately and use it for your business.
-
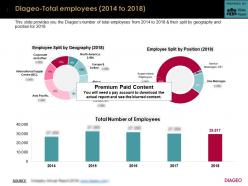 Diageo total employees 2014-2018
This is a professionally designed visual chart for Diageo Total Employees 2014 to 2018. This is part of our Data and Statistics products selection, and you will need a Paid account to download the actual report with accurate data and sources. Downloaded report will contain the editable graph with accurate data, an excel table with the actual data, the exact source of the data and the release date. This slide provides you the Diageos number of total employees from 2014 to 2018 and their split by geography and position for 2018. Download it immediately and use it for your business.
-
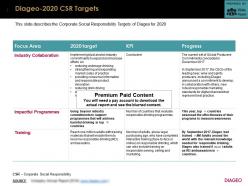 Diageo 2020 csr targets
The information presented in this slide has been researched by our team of professional business analysts. This is part of our Company Profiles products selection, and you will need a Paid account to download the actual report with accurate data and sources. Downloaded report will be in Powerpoint and will contain the actual editable slides with the actual data and sources for each data. This slide describes the Corporate Social Responsibility Targets of Diageo for 2020. Download it immediately and use it for your business.
-
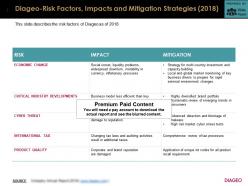 Diageo risk factors impacts and mitigation strategies 2018
The information presented in this slide has been researched by our team of professional business analysts. This is part of our Company Profiles products selection, and you will need a Paid account to download the actual report with accurate data and sources. Downloaded report will be in Powerpoint and will contain the actual editable slides with the actual data and sources for each data. This slide describes the risk factors of Diageo as of 2018. Download it immediately and use it for your business.
-
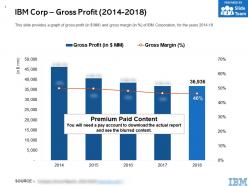 Ibm corp gross profit 2014-2018
This is a professionally designed visual chart for IBM Corp Gross Profit 2014 to 2018. This is part of our Data and Statistics products selection, and you will need a Paid account to download the actual report with accurate data and sources. Downloaded report will contain the editable graph with accurate data, an excel table with the actual data, the exact source of the data and the release date. This slide provides a graph of gross profit in JPY MM and gross margin in percent of IBM Corporation for the years 2014 to 18. Download it immediately and use it for your business.
-
 Ibm corp key ratios ie liquidity profitability debt ratio 2014-2018
This is a professionally designed visual chart for IBM Corp Key Ratios Ie Liquidity Profitability Debt Ratio 2014 to 2018. This is part of our Data and Statistics products selection, and you will need a Paid account to download the actual report with accurate data and sources. Downloaded report will contain the editable graph with accurate data, an excel table with the actual data, the exact source of the data and the release date. This slide provides a table of key ratios Current ratio, interest coverage ratio, Return on Equity, Return on Assets, Asset Turnover Ratio etc. of IBM Corporation for the years 2014 to 2018. Download it immediately and use it for your business.
-
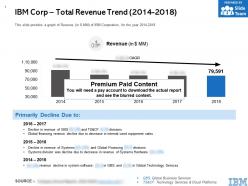 Ibm corp total revenue trend 2014-2018
This is a professionally designed visual chart for IBM Corp Total Revenue Trend 2014 to 2018. This is part of our Data and Statistics products selection, and you will need a Paid account to download the actual report with accurate data and sources. Downloaded report will contain the editable graph with accurate data, an excel table with the actual data, the exact source of the data and the release date. This slide provides a graph of Revenue in JPY MM of IBM Corporation for the year 2014 to 2018. Download it immediately and use it for your business.
-
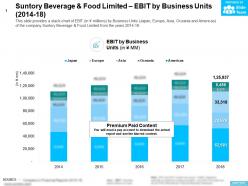 Suntory beverage and food limited ebit by business units 2014-18
This is a professionally designed visual chart for Suntory Beverage And Food Limited EBIT By Business Units 2014 to 18. This is part of our Data and Statistics products selection, and you will need a Paid account to download the actual report with accurate data and sources. Downloaded report will contain the editable graph with accurate data, an excel table with the actual data, the exact source of the data and the release date. This slide provides a stack chart of EBIT in JPY millions by Business Units Japan Europe Asia Oceania and Americas of the company Suntory Beverage and Food Limited from the years 2014 to 18. Download it immediately and use it for your business.
-
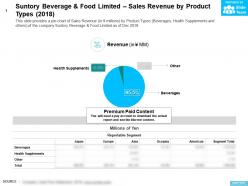 Suntory beverage and food limited sales revenue by product types 2018
This is a professionally designed visual chart for Suntory Beverage And Food Limited Sales Revenue By Product Types 2018. This is part of our Data and Statistics products selection, and you will need a Paid account to download the actual report with accurate data and sources. Downloaded report will contain the editable graph with accurate data, an excel table with the actual data, the exact source of the data and the release date. This slide provides a pie chart of Sales Revenue in JPY millions by Product Types Beverages Health Supplements and others of the company Suntory Beverage and Food Limited as of Dec 2018. Download it immediately and use it for your business.
-
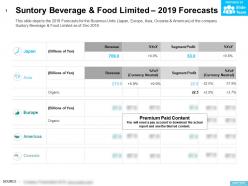 Suntory beverage and food limited 2019 forecasts
The information presented in this slide has been researched by our team of professional business analysts. This is part of our Company Profiles products selection, and you will need a Paid account to download the actual report with accurate data and sources. Downloaded report will be in Powerpoint and will contain the actual editable slides with the actual data and sources for each data. This slide depicts the 2019 Forecasts for the Business Units Japan Europe Asia Oceania and Americas of the company Suntory Beverage and Food Limited as of Dec 2018. Download it immediately and use it for your business.
-
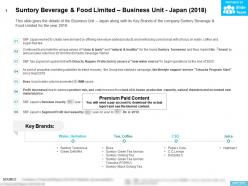 Suntory beverage and food limited business unit japan 2018
The information presented in this slide has been researched by our team of professional business analysts. This is part of our Company Profiles products selection, and you will need a Paid account to download the actual report with accurate data and sources. Downloaded report will be in Powerpoint and will contain the actual editable slides with the actual data and sources for each data. This slide gives the details of the Business Unit Japan along with its Key Brands of the company Suntory Beverage and Food Limited for the year 2018. Download it immediately and use it for your business.
-
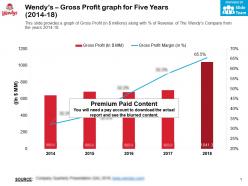 Wendys gross profit graph for five years 2014-18
This is a professionally designed visual chart for Wendys Gross Profit Graph For Five Years 2014 to 18. This is part of our Data and Statistics products selection, and you will need a Paid account to download the actual report with accurate data and sources. Downloaded report will contain the editable graph with accurate data, an excel table with the actual data, the exact source of the data and the release date. This slide provides a graph of Gross Profit in JPY millions along with percent of Revenue of The Wendys Company from the years 2014 to 18. Download it immediately and use it for your business.
-
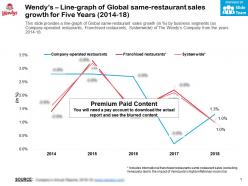 Wendys line graph of global same restaurant sales growth for five years 2014-18
This is a professionally designed visual chart for Wendys Line Graph Of Global Same Restaurant Sales Growth For Five Years 2014 to 18. This is part of our Data and Statistics products selection, and you will need a Paid account to download the actual report with accurate data and sources. Downloaded report will contain the editable graph with accurate data, an excel table with the actual data, the exact source of the data and the release date. This slide provides a line graph of Global same restaurant sales growth in percent by business segments as Company operated restaurants, Franchised restaurants, Systemwide of The Wendys Company from the years 2014 to 18. Download it immediately and use it for your business.
-
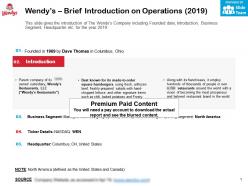 Wendys brief introduction on operations 2019
The information presented in this slide has been researched by our team of professional business analysts. This is part of our Company Profiles products selection, and you will need a Paid account to download the actual report with accurate data and sources. Downloaded report will be in Powerpoint and will contain the actual editable slides with the actual data and sources for each data. This slide gives the introduction of The Wendys Company including Founded date Introduction Business Segment Headquarter etc for the year 2019. Download it immediately and use it for your business.
-
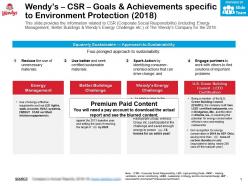 Wendys csr goals and achievements specific to environment protection 2018
The information presented in this slide has been researched by our team of professional business analysts. This is part of our Company Profiles products selection, and you will need a Paid account to download the actual report with accurate data and sources. Downloaded report will be in Powerpoint and will contain the actual editable slides with the actual data and sources for each data. This slide provides the information related to CSR Corporate Social Responsibility including Energy Management Better Buildings and Wendys Energy Challenge etc of The Wendys Company for the 2018. Download it immediately and use it for your business.
-
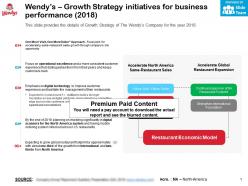 Wendys growth strategy initiatives for business performance 2018
The information presented in this slide has been researched by our team of professional business analysts. This is part of our Company Profiles products selection, and you will need a Paid account to download the actual report with accurate data and sources. Downloaded report will be in Powerpoint and will contain the actual editable slides with the actual data and sources for each data. This slide provides the details of Growth Strategy of The Wendys Company for the year 2018. Download it immediately and use it for your business.
-
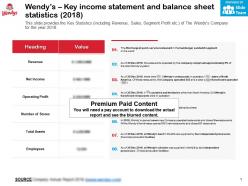 Wendys key income statement and balance sheet statistics 2018
The information presented in this slide has been researched by our team of professional business analysts. This is part of our Company Profiles products selection, and you will need a Paid account to download the actual report with accurate data and sources. Downloaded report will be in Powerpoint and will contain the actual editable slides with the actual data and sources for each data. This slide provides the Key Statistics including Revenue Sales Segment Profit etc of The Wendys Company for the year 2018. Download it immediately and use it for your business.
-
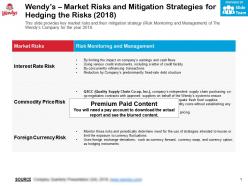 Wendys market risks and mitigation strategies for hedging the risks 2018
The information presented in this slide has been researched by our team of professional business analysts. This is part of our Company Profiles products selection, and you will need a Paid account to download the actual report with accurate data and sources. Downloaded report will be in Powerpoint and will contain the actual editable slides with the actual data and sources for each data. This slide provides key market risks and their mitigation strategy Risk Monitoring and Management of The Wendys Company for the year 2018. Download it immediately and use it for your business.
-
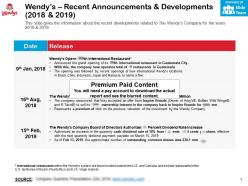 Wendys recent announcements and developments 2018-2019
The information presented in this slide has been researched by our team of professional business analysts. This is part of our Company Profiles products selection, and you will need a Paid account to download the actual report with accurate data and sources. Downloaded report will be in Powerpoint and will contain the actual editable slides with the actual data and sources for each data. This slide gives the information about the recent developments related to The Wendys Company for the years 2018 and 2019. Download it immediately and use it for your business.
-
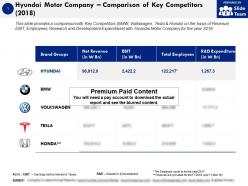 Hyundai motor company comparison of key competitors 2018
This is a professionally designed visual chart for Hyundai Motor Company Comparison Of Key Competitors 2018. This is part of our Data and Statistics products selection, and you will need a Paid account to download the actual report with accurate data and sources. Downloaded report will contain the editable graph with accurate data, an excel table with the actual data, the exact source of the data and the release date. This slide provides a comparison with Key Competitors BMW, Volkswagen, Tesla and Honda on the basis of Revenue, EBIT, Employees, Research and Development Expenditure with Hyundai Motor Company for the year 2018. Download it immediately and use it for your business.
-
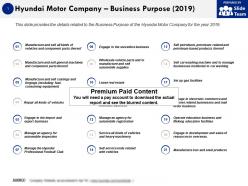 Hyundai motor company business purpose 2019
The information presented in this slide has been researched by our team of professional business analysts. This is part of our Company Profiles products selection, and you will need a Paid account to download the actual report with accurate data and sources. Downloaded report will be in Powerpoint and will contain the actual editable slides with the actual data and sources for each data. This slide provides the details related to the Business Purpose of the Hyundai Motor Company for the year 2019. Download it immediately and use it for your business.
-
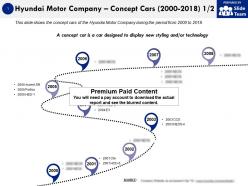 Hyundai motor company concept cars 2000-2018
The information presented in this slide has been researched by our team of professional business analysts. This is part of our Company Profiles products selection, and you will need a Paid account to download the actual report with accurate data and sources. Downloaded report will be in Powerpoint and will contain the actual editable slides with the actual data and sources for each data. This slide shows the concept cars of the Hyundai Motor Company during the period from 2000 to 2018. Download it immediately and use it for your business.
-
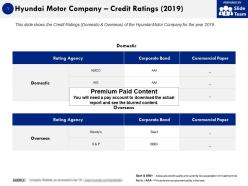 Hyundai motor company credit ratings 2019
The information presented in this slide has been researched by our team of professional business analysts. This is part of our Company Profiles products selection, and you will need a Paid account to download the actual report with accurate data and sources. Downloaded report will be in Powerpoint and will contain the actual editable slides with the actual data and sources for each data. This slide shows the Credit Ratings Domestic and Overseas of the Hyundai Motor Company for the year 2019. Download it immediately and use it for your business.
-
 Hyundai motor company csr csv strategy system 2018
The information presented in this slide has been researched by our team of professional business analysts. This is part of our Company Profiles products selection, and you will need a Paid account to download the actual report with accurate data and sources. Downloaded report will be in Powerpoint and will contain the actual editable slides with the actual data and sources for each data. This slide provides the information related to CSV Creating Shared Value Strategy System of the Hyundai Motor Company for the year 2018. Download it immediately and use it for your business.
-
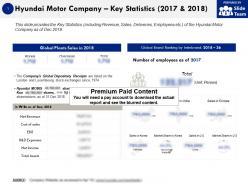 Hyundai motor company key statistics 2017-2018
The information presented in this slide has been researched by our team of professional business analysts. This is part of our Company Profiles products selection, and you will need a Paid account to download the actual report with accurate data and sources. Downloaded report will be in Powerpoint and will contain the actual editable slides with the actual data and sources for each data. This slide provides the Key Statistics including Revenue, Sales, Deliveries, Employees etc. of the Hyundai Motor Company as of Dec 2018. Download it immediately and use it for your business.
-
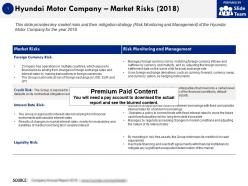 Hyundai motor company market risks 2018
The information presented in this slide has been researched by our team of professional business analysts. This is part of our Company Profiles products selection, and you will need a Paid account to download the actual report with accurate data and sources. Downloaded report will be in Powerpoint and will contain the actual editable slides with the actual data and sources for each data. This slide provides key market risks and their mitigation strategy Risk Monitoring and Management of the Hyundai Motor Company for the year 2018. Download it immediately and use it for your business.
-
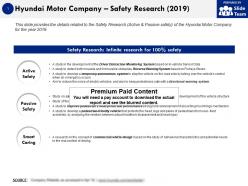 Hyundai motor company safety research 2019
The information presented in this slide has been researched by our team of professional business analysts. This is part of our Company Profiles products selection, and you will need a Paid account to download the actual report with accurate data and sources. Downloaded report will be in Powerpoint and will contain the actual editable slides with the actual data and sources for each data. This slide provides the details related to the Safety Research Active Passive safety of the Hyundai Motor Company for the year 2019. Download it immediately and use it for your business.
-
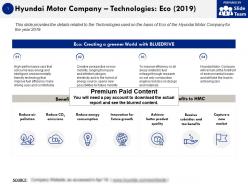 Hyundai motor company technologies eco 2019
The information presented in this slide has been researched by our team of professional business analysts. This is part of our Company Profiles products selection, and you will need a Paid account to download the actual report with accurate data and sources. Downloaded report will be in Powerpoint and will contain the actual editable slides with the actual data and sources for each data. This slide provides the details related to the Technologies used on the basis of Eco of the Hyundai Motor Company for the year 2019. Download it immediately and use it for your business.
-
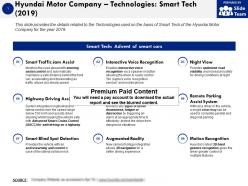 Hyundai motor company technologies smart tech 2019
The information presented in this slide has been researched by our team of professional business analysts. This is part of our Company Profiles products selection, and you will need a Paid account to download the actual report with accurate data and sources. Downloaded report will be in Powerpoint and will contain the actual editable slides with the actual data and sources for each data. This slide provides the details related to the Technologies used on the basis of Smart Tech of the Hyundai Motor Company for the year 2019. Download it immediately and use it for your business.
-
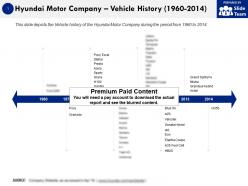 Hyundai motor company vehicle history 1960-2014
The information presented in this slide has been researched by our team of professional business analysts. This is part of our Company Profiles products selection, and you will need a Paid account to download the actual report with accurate data and sources. Downloaded report will be in Powerpoint and will contain the actual editable slides with the actual data and sources for each data. This slide depicts the Vehicle history of the Hyundai Motor Company during the period from 1960 to 2014. Download it immediately and use it for your business.
-
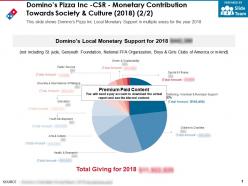 Dominos pizza inc csr monetary contribution towards society and culture 2018
This is a professionally designed visual chart for Dominos Pizza Inc CSR Monetary Contribution Towards Society And Culture 2018. This is part of our Data and Statistics products selection, and you will need a Paid account to download the actual report with accurate data and sources. Downloaded report will contain the editable graph with accurate data, an excel table with the actual data, the exact source of the data and the release date. This slide shows Dominos Pizza Inc Local Monetary Support in multiple areas for the year 2018. Download it immediately and use it for your business.
-
 Dominos pizza inc graph of key competitors store count comparison 2018
This is a professionally designed visual chart for Dominos Pizza Inc Graph Of Key Competitors Store Count Comparison 2018. This is part of our Data and Statistics products selection, and you will need a Paid account to download the actual report with accurate data and sources. Downloaded report will contain the editable graph with accurate data, an excel table with the actual data, the exact source of the data and the release date. This slide shows Dominos Pizza Inc Competitors Store Count Comparison in 2018. Download it immediately and use it for your business.
-
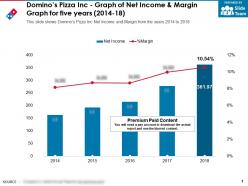 Dominos pizza inc graph of net income and margin graph for five years 2014-18
This is a professionally designed visual chart for Dominos Pizza Inc Graph Of Net Income And Margin Graph For Five Years 2014 to 18. This is part of our Data and Statistics products selection, and you will need a Paid account to download the actual report with accurate data and sources. Downloaded report will contain the editable graph with accurate data, an excel table with the actual data, the exact source of the data and the release date. This slide shows Dominos Pizza Inc Net Income and Margin from the years 2014 to 2018. Download it immediately and use it for your business.
-
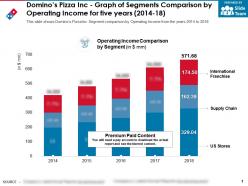 Dominos pizza inc graph of segments comparison by operating income for five years 2014-18
This is a professionally designed visual chart for Dominos Pizza Inc Graph Of Segments Comparison By Operating Income For Five Years 2014 to 18. This is part of our Data and Statistics products selection, and you will need a Paid account to download the actual report with accurate data and sources. Downloaded report will contain the editable graph with accurate data, an excel table with the actual data, the exact source of the data and the release date. This slide shows Dominos Pizza Inc Segment comparison by Operating Income from the years 2014 to 2018. Download it immediately and use it for your business.
-
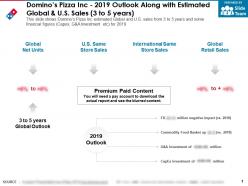 Dominos pizza inc 2019 outlook along with estimated global and us sales 3 to 5 years
The information presented in this slide has been researched by our team of professional business analysts. This is part of our Company Profiles products selection, and you will need a Paid account to download the actual report with accurate data and sources. Downloaded report will be in Powerpoint and will contain the actual editable slides with the actual data and sources for each data. This slide shows Dominos Pizza Inc estimated Global and U.S sales from 3 to 5 years and some financial figures Capex, G and A Investment etc for 2019. Download it immediately and use it for your business.
-
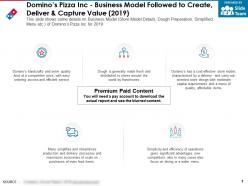 Dominos pizza inc business model followed to create deliver and capture value 2019
The information presented in this slide has been researched by our team of professional business analysts. This is part of our Company Profiles products selection, and you will need a Paid account to download the actual report with accurate data and sources. Downloaded report will be in Powerpoint and will contain the actual editable slides with the actual data and sources for each data. This slide shows some details on Business Model Store Model Details, Dough Preparation, Simplified Menu etc. of Dominos Pizza Inc for 2019. Download it immediately and use it for your business.
-
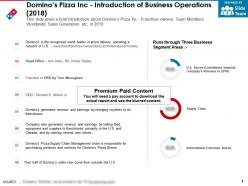 Dominos pizza inc introduction of business operations 2018
The information presented in this slide has been researched by our team of professional business analysts. This is part of our Company Profiles products selection, and you will need a Paid account to download the actual report with accurate data and sources. Downloaded report will be in Powerpoint and will contain the actual editable slides with the actual data and sources for each data. This slide gives a brief introduction about Dominos Pizza Inc Franchise owners, Team Members Worldwide, Sales Generation, etc. in 2018. Download it immediately and use it for your business.


