Data Statistics PowerPoint Templates, PowerPoint Statistics Slides
- Sub Categories
-
- Agriculture
- Chemicals and Resources
- Construction
- Consumer Goods and FMCG
- E-Commerce
- Energy and Environmental Services
- Finance Insurance and Real Estate
- Health and Pharmaceuticals
- Internet
- Life
- Media and Advertising
- Metals and Electronics
- Retail and Trade
- Services
- Society
- Sports and Recreation
- Survey
- Technology and Telecommunications
- Transportation and Logistics
- Travel Tourism and Hospitality
- USA
-
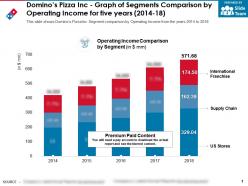 Dominos pizza inc graph of segments comparison by operating income for five years 2014-18
This is a professionally designed visual chart for Dominos Pizza Inc Graph Of Segments Comparison By Operating Income For Five Years 2014 to 18. This is part of our Data and Statistics products selection, and you will need a Paid account to download the actual report with accurate data and sources. Downloaded report will contain the editable graph with accurate data, an excel table with the actual data, the exact source of the data and the release date. This slide shows Dominos Pizza Inc Segment comparison by Operating Income from the years 2014 to 2018. Download it immediately and use it for your business.
-
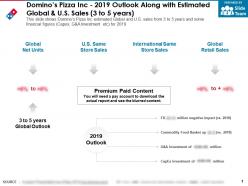 Dominos pizza inc 2019 outlook along with estimated global and us sales 3 to 5 years
The information presented in this slide has been researched by our team of professional business analysts. This is part of our Company Profiles products selection, and you will need a Paid account to download the actual report with accurate data and sources. Downloaded report will be in Powerpoint and will contain the actual editable slides with the actual data and sources for each data. This slide shows Dominos Pizza Inc estimated Global and U.S sales from 3 to 5 years and some financial figures Capex, G and A Investment etc for 2019. Download it immediately and use it for your business.
-
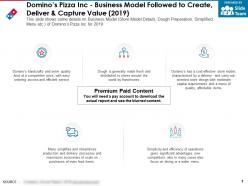 Dominos pizza inc business model followed to create deliver and capture value 2019
The information presented in this slide has been researched by our team of professional business analysts. This is part of our Company Profiles products selection, and you will need a Paid account to download the actual report with accurate data and sources. Downloaded report will be in Powerpoint and will contain the actual editable slides with the actual data and sources for each data. This slide shows some details on Business Model Store Model Details, Dough Preparation, Simplified Menu etc. of Dominos Pizza Inc for 2019. Download it immediately and use it for your business.
-
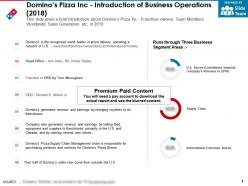 Dominos pizza inc introduction of business operations 2018
The information presented in this slide has been researched by our team of professional business analysts. This is part of our Company Profiles products selection, and you will need a Paid account to download the actual report with accurate data and sources. Downloaded report will be in Powerpoint and will contain the actual editable slides with the actual data and sources for each data. This slide gives a brief introduction about Dominos Pizza Inc Franchise owners, Team Members Worldwide, Sales Generation, etc. in 2018. Download it immediately and use it for your business.
-
 Dominos pizza inc key senior level executives 2018
The information presented in this slide has been researched by our team of professional business analysts. This is part of our Company Profiles products selection, and you will need a Paid account to download the actual report with accurate data and sources. Downloaded report will be in Powerpoint and will contain the actual editable slides with the actual data and sources for each data. This slide shows Key Management of Dominos Pizza Inc that includes CEO, COO, CFO, CIO, Chief People Officer etc in 2018. Download it immediately and use it for your business.
-
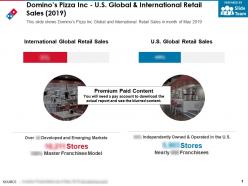 Dominos pizza inc us global and international retail sales 2019
The information presented in this slide has been researched by our team of professional business analysts. This is part of our Company Profiles products selection, and you will need a Paid account to download the actual report with accurate data and sources. Downloaded report will be in Powerpoint and will contain the actual editable slides with the actual data and sources for each data. This slide shows Dominos Pizza Inc Global and International Retail Sales in month of May 2019. Download it immediately and use it for your business.
-
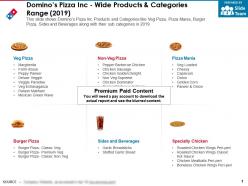 Dominos pizza inc wide products and categories range 2019
The information presented in this slide has been researched by our team of professional business analysts. This is part of our Company Profiles products selection, and you will need a Paid account to download the actual report with accurate data and sources. Downloaded report will be in Powerpoint and will contain the actual editable slides with the actual data and sources for each data. This slide shows Dominos Pizza Inc Products and Categories like Veg Pizza, Pizza Mania, Burger Pizza, Sides and Beverages along with their sub categories in 2019. Download it immediately and use it for your business.
-
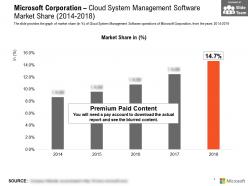 Microsoft corporation cloud system management software market share 2014-2018
This is a professionally designed visual chart for Microsoft Corporation Cloud System Management Software Market Share 2014 to 2018. This is part of our Data and Statistics products selection, and you will need a Paid account to download the actual report with accurate data and sources. Downloaded report will contain the editable graph with accurate data, an excel table with the actual data, the exact source of the data and the release date. The slide provides the graph of market share in Percentage of Cloud System Management Software operations of Microsoft Corporation from the years 2014 to 2018. Download it immediately and use it for your business.
-
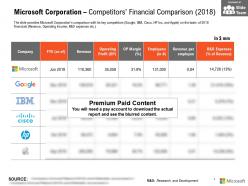 Microsoft corporation competitors financial comparison 2018
This is a professionally designed visual chart for Microsoft Corporation Competitors Financial Comparison 2018. This is part of our Data and Statistics products selection, and you will need a Paid account to download the actual report with accurate data and sources. Downloaded report will contain the editable graph with accurate data, an excel table with the actual data, the exact source of the data and the release date. The slide provides Microsoft Corporations comparison with its key competitors Google IBM Cisco HP Inc and Apple on the basis of 2018 financials Revenue Operating Income R and D expenses etc. Download it immediately and use it for your business.
-
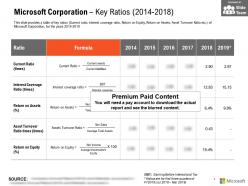 Microsoft corporation key ratios 2014-2018
This is a professionally designed visual chart for Microsoft Corporation Key Ratios 2014 to 2018. This is part of our Data and Statistics products selection, and you will need a Paid account to download the actual report with accurate data and sources. Downloaded report will contain the editable graph with accurate data, an excel table with the actual data, the exact source of the data and the release date. This slide provides a table of key ratios Current ratio interest coverage ratio Return on Equity Return on Assets Asset Turnover Ratio etc of Microsoft Corporation for the years 2014 to 2018. Download it immediately and use it for your business.
-
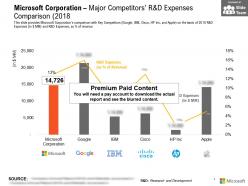 Microsoft corporation major competitors r and d expenses comparison 2018
This is a professionally designed visual chart for Microsoft Corporation Major Competitors R And D Expenses Comparison 2018. This is part of our Data and Statistics products selection, and you will need a Paid account to download the actual report with accurate data and sources. Downloaded report will contain the editable graph with accurate data, an excel table with the actual data, the exact source of the data and the release date. This slide provides Microsoft Corporations comparison with Key Competitors Google IBM Cisco HP Inc and Apple on the basis of 2018 R and D Expenses in JPY MM and R and D Expenses as Percentage of revenue. Download it immediately and use it for your business.
-
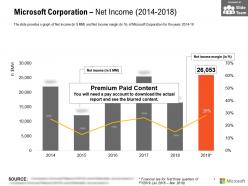 Microsoft corporation net income 2014-2018
This is a professionally designed visual chart for Microsoft Corporation Net Income 2014 to 2018. This is part of our Data and Statistics products selection, and you will need a Paid account to download the actual report with accurate data and sources. Downloaded report will contain the editable graph with accurate data, an excel table with the actual data, the exact source of the data and the release date. The slide provides a graph of Net income in JPY MM and Net income margin in Percentage of Microsoft Corporation for the years 2014 to 18. Download it immediately and use it for your business.
-
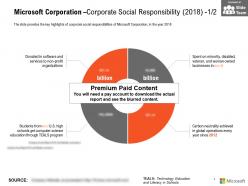 Microsoft corporation corporate social responsibility 2018
The information presented in this slide has been researched by our team of professional business analysts. This is part of our Company Profiles products selection, and you will need a Paid account to download the actual report with accurate data and sources. Downloaded report will be in Powerpoint and will contain the actual editable slides with the actual data and sources for each data. The slide provides the key highlights of corporate social responsibilities of Microsoft Corporation in the year 2018. Download it immediately and use it for your business.
-
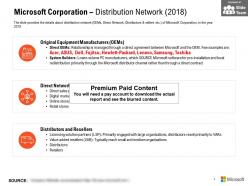 Microsoft corporation distribution network 2018
The information presented in this slide has been researched by our team of professional business analysts. This is part of our Company Profiles products selection, and you will need a Paid account to download the actual report with accurate data and sources. Downloaded report will be in Powerpoint and will contain the actual editable slides with the actual data and sources for each data. The slide provides the details about distribution network OEMs Direct Network Distributors and sellers etc of Microsoft Corporation in the year 2018. Download it immediately and use it for your business.
-
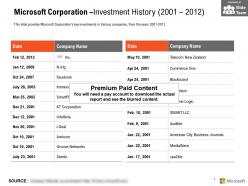 Microsoft corporation investment history 2001-2012
The information presented in this slide has been researched by our team of professional business analysts. This is part of our Company Profiles products selection, and you will need a Paid account to download the actual report with accurate data and sources. Downloaded report will be in Powerpoint and will contain the actual editable slides with the actual data and sources for each data. This slide provides Microsoft Corporations key investments in Various companies from the years 2001 to 2012. Download it immediately and use it for your business.
-
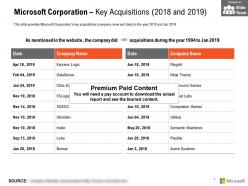 Microsoft corporation key acquisitions 2018-2019
The information presented in this slide has been researched by our team of professional business analysts. This is part of our Company Profiles products selection, and you will need a Paid account to download the actual report with accurate data and sources. Downloaded report will be in Powerpoint and will contain the actual editable slides with the actual data and sources for each data. This slide provides Microsoft Corporations key acquisitions company name and date in the year 2018 and Jan 2019. Download it immediately and use it for your business.
-
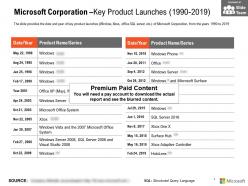 Microsoft corporation key product launches 1990-2019
The information presented in this slide has been researched by our team of professional business analysts. This is part of our Company Profiles products selection, and you will need a Paid account to download the actual report with accurate data and sources. Downloaded report will be in Powerpoint and will contain the actual editable slides with the actual data and sources for each data. The slide provides the date and year of key product launches Window Xbox office SQL server etc of Microsoft Corporation from the years 1990 to 2019. Download it immediately and use it for your business.
-
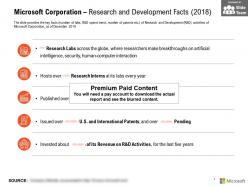 Microsoft corporation research and development facts 2018
The information presented in this slide has been researched by our team of professional business analysts. This is part of our Company Profiles products selection, and you will need a Paid account to download the actual report with accurate data and sources. Downloaded report will be in Powerpoint and will contain the actual editable slides with the actual data and sources for each data. The slide provides the key facts number of labs R and D spend trend number of patents etc of Research and Development R and D activities of Microsoft Corporation as of December 2018. Download it immediately and use it for your business.
-
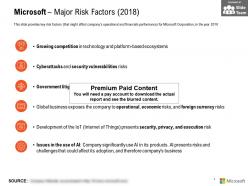 Microsoft major risk factors 2018
The information presented in this slide has been researched by our team of professional business analysts. This is part of our Company Profiles products selection, and you will need a Paid account to download the actual report with accurate data and sources. Downloaded report will be in Powerpoint and will contain the actual editable slides with the actual data and sources for each data. This slide provides key risk factors that might affect companys operational and financials performance for Microsoft Corporation in the year 2018. Download it immediately and use it for your business.
-
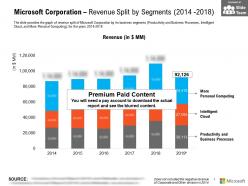 Microsoft corporation revenue split by segments 2014-2018
This is a professionally designed visual chart for Microsoft Corporation Revenue Split By Segments 2014 to 2018. This is part of our Data and Statistics products selection, and you will need a Paid account to download the actual report with accurate data and sources. Downloaded report will contain the editable graph with accurate data, an excel table with the actual data, the exact source of the data and the release date. The slide provides the graph of revenue split of Microsoft Corporation by its business segments Productivity and Business Processes Intelligent Cloud and More Personal Computing for the years 2014 to 2018. Download it immediately and use it for your business.
-
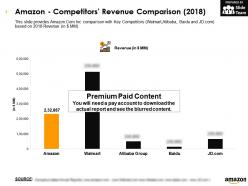 Amazon competitors revenue comparison 2018
This is a professionally designed visual chart for Amazon Competitors Revenue Comparison 2018. This is part of our Data and Statistics products selection, and you will need a Paid account to download the actual report with accurate data and sources. Downloaded report will contain the editable graph with accurate data, an excel table with the actual data, the exact source of the data and the release date. This slide provides Amazon.Com Inc comparison with Key Competitors Walmart, Alibaba, Baidu and JD.com based on 2018 Revenue in JPY MM. Download it immediately and use it for your business.
-
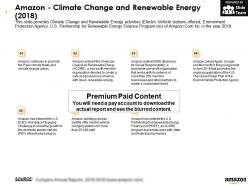 Amazon climate change and renewable energy 2018
The information presented in this slide has been researched by our team of professional business analysts. This is part of our Company Profiles products selection, and you will need a Paid account to download the actual report with accurate data and sources. Downloaded report will be in Powerpoint and will contain the actual editable slides with the actual data and sources for each data. This slide provides Climate Change and Renewable Energy activities Electric Vehicle stations offered, Environment Protection Agency, U.S Partnership for Renewable Energy Finance Program etc of Amazon.Com Inc in the year 2018. Download it immediately and use it for your business.
-
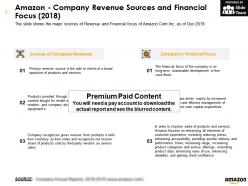 Amazon company revenue sources and financial focus 2018
The information presented in this slide has been researched by our team of professional business analysts. This is part of our Company Profiles products selection, and you will need a Paid account to download the actual report with accurate data and sources. Downloaded report will be in Powerpoint and will contain the actual editable slides with the actual data and sources for each data. The slide shows the major sources of Revenue and Financial focus of Amazon.Com Inc as of Dec 2018. Download it immediately and use it for your business.
-
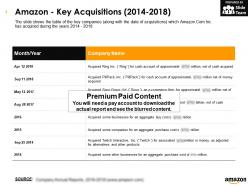 Amazon key acquisitions 2014-2018
The information presented in this slide has been researched by our team of professional business analysts. This is part of our Company Profiles products selection, and you will need a Paid account to download the actual report with accurate data and sources. Downloaded report will be in Powerpoint and will contain the actual editable slides with the actual data and sources for each data. The slide shows the table of the key companies along with the date of acquisitions which Amazon.Com Inc has acquired during the years 2014 to 2018. Download it immediately and use it for your business.
-
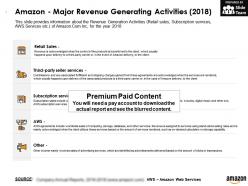 Amazon major revenue generating activities 2018
The information presented in this slide has been researched by our team of professional business analysts. This is part of our Company Profiles products selection, and you will need a Paid account to download the actual report with accurate data and sources. Downloaded report will be in Powerpoint and will contain the actual editable slides with the actual data and sources for each data. This slide provides information about the Revenue Generation Activities Retail sales, Subscription services, AWS Services etc. of Amazon.Com Inc for the year 2018. Download it immediately and use it for your business.
-
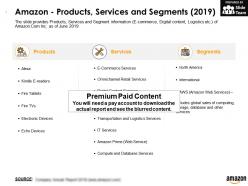 Amazon products services and segments 2019
The information presented in this slide has been researched by our team of professional business analysts. This is part of our Company Profiles products selection, and you will need a Paid account to download the actual report with accurate data and sources. Downloaded report will be in Powerpoint and will contain the actual editable slides with the actual data and sources for each data. The slide provides Products, Services and Segment information E commerce, Digital content, Logistics etc. of Amazon.Com Inc as of June 2019. Download it immediately and use it for your business.
-
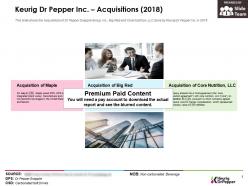 Keurig dr pepper inc acquisitions 2018
The information presented in this slide has been researched by our team of professional business analysts. This is part of our Company Profiles products selection, and you will need a Paid account to download the actual report with accurate data and sources. Downloaded report will be in Powerpoint and will contain the actual editable slides with the actual data and sources for each data. This slide shows the Acquisitions of Dr Pepper Snapple Group, Inc, Big Red and Core Nutrition, LLC done by Keurig Dr Pepper Inc. in 2018. Download it immediately and use it for your business.
-
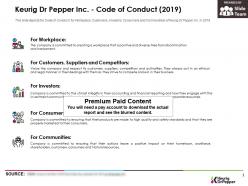 Keurig dr pepper inc code of conduct 2019
The information presented in this slide has been researched by our team of professional business analysts. This is part of our Company Profiles products selection, and you will need a Paid account to download the actual report with accurate data and sources. Downloaded report will be in Powerpoint and will contain the actual editable slides with the actual data and sources for each data. This slide depicts the Code of Conduct for Workplace, Customers, Investors, Consumers and Communities of Keurig Dr Pepper Inc. in 2019. Download it immediately and use it for your business.
-
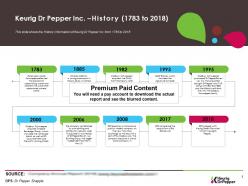 Keurig dr pepper inc history 1783-2018
The information presented in this slide has been researched by our team of professional business analysts. This is part of our Company Profiles products selection, and you will need a Paid account to download the actual report with accurate data and sources. Downloaded report will be in Powerpoint and will contain the actual editable slides with the actual data and sources for each data. This slide shows the History Information of Keurig Dr Pepper Inc. from 1783 to 2018. Download it immediately and use it for your business.
-
 Keurig dr pepper inc leadership 2019
The information presented in this slide has been researched by our team of professional business analysts. This is part of our Company Profiles products selection, and you will need a Paid account to download the actual report with accurate data and sources. Downloaded report will be in Powerpoint and will contain the actual editable slides with the actual data and sources for each data. This slide shows the Key Management of Keurig Dr Pepper Inc. Including CEO, Chief Legal Officer, Financial Officer, Corporate Affairs Officer, Commercial Officer, Marketing Officer Etc. In 2019. Download it immediately and use it for your business.
-
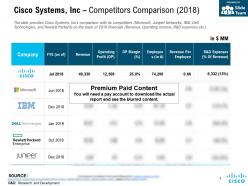 Cisco systems inc competitors comparison 2018
This is a professionally designed visual chart for Cisco Systems Inc Competitors Comparison 2018. This is part of our Data and Statistics products selection, and you will need a Paid account to download the actual report with accurate data and sources. Downloaded report will contain the editable graph with accurate data, an excel table with the actual data, the exact source of the data and the release date. The slide provides Cisco Systems, Incs comparison with its competitors Microsoft, Juniper Networks, IBM, Dell Technologies and Hewlett Packard on the basis of 2018 financials Revenue, Operating Income, R and D expenses etc. Download it immediately and use it for your business.
-
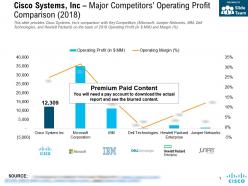 Cisco systems inc major competitors operating profit comparison 2018
This is a professionally designed visual chart for Cisco Systems Inc Major Competitors Operating Profit Comparison 2018. This is part of our Data and Statistics products selection, and you will need a Paid account to download the actual report with accurate data and sources. Downloaded report will contain the editable graph with accurate data, an excel table with the actual data, the exact source of the data and the release date. This slide provides Cisco Systems, Incs comparison with Key Competitors Microsoft, Juniper Networks, IBM, Dell Technologies and Hewlett Packard on the basis of 2018 Operating Profit in JPY MM and Margin percent. Download it immediately and use it for your business.
-
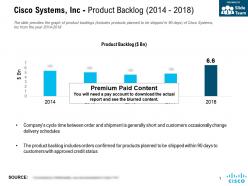 Cisco systems inc product backlog 2014-2018
This is a professionally designed visual chart for Cisco Systems Inc Product Backlog 2014 to 2018. This is part of our Data and Statistics products selection, and you will need a Paid account to download the actual report with accurate data and sources. Downloaded report will contain the editable graph with accurate data, an excel table with the actual data, the exact source of the data and the release date. The slide provides the graph of product backlogs includes products planned to be shipped in 90 days of Cisco Systems, Inc from the year 2014 to 2018. Download it immediately and use it for your business.
-
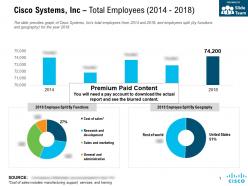 Cisco systems inc total employees 2014-2018
This is a professionally designed visual chart for Cisco Systems Inc Total Employees 2014 to 2018. This is part of our Data and Statistics products selection, and you will need a Paid account to download the actual report with accurate data and sources. Downloaded report will contain the editable graph with accurate data, an excel table with the actual data, the exact source of the data and the release date. The slide provides graph of Cisco Systems, Incs total employees from 2014 to 2018 and employees split by functions and geography for the year 2018. Download it immediately and use it for your business.
-
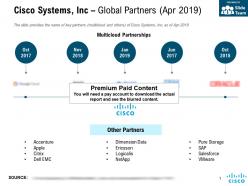 Cisco systems inc global partners apr 2019
The information presented in this slide has been researched by our team of professional business analysts. This is part of our Company Profiles products selection, and you will need a Paid account to download the actual report with accurate data and sources. Downloaded report will be in Powerpoint and will contain the actual editable slides with the actual data and sources for each data. The slide provides the name of key partners multicloud and others of Cisco Systems, Inc, as of Apr 2019. Download it immediately and use it for your business.
-
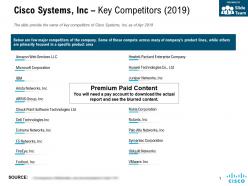 Cisco systems inc key competitors 2019
The information presented in this slide has been researched by our team of professional business analysts. This is part of our Company Profiles products selection, and you will need a Paid account to download the actual report with accurate data and sources. Downloaded report will be in Powerpoint and will contain the actual editable slides with the actual data and sources for each data. The slide provide the name of key competitors of Cisco Systems, Inc as of Apr 2019. Download it immediately and use it for your business.
-
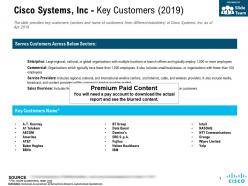 Cisco systems inc key customers 2019
The information presented in this slide has been researched by our team of professional business analysts. This is part of our Company Profiles products selection, and you will need a Paid account to download the actual report with accurate data and sources. Downloaded report will be in Powerpoint and will contain the actual editable slides with the actual data and sources for each data. The slide provides key customers sectors and name of customers from different industries of Cisco Systems, Inc as of Apr 2019. Download it immediately and use it for your business.
-
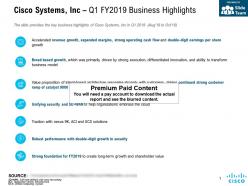 Cisco systems inc q1 fy 2019 business highlights
The information presented in this slide has been researched by our team of professional business analysts. This is part of our Company Profiles products selection, and you will need a Paid account to download the actual report with accurate data and sources. Downloaded report will be in Powerpoint and will contain the actual editable slides with the actual data and sources for each data. The slide provides the key business highlights of Cisco Systems, Inc in Q1 2019 Aug 18 to Oct 18. Download it immediately and use it for your business.
-
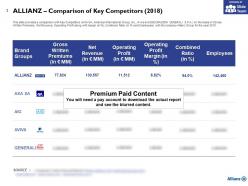 Allianz comparison of key competitors 2018
This is a professionally designed visual chart for Allianz Comparison Of Key Competitors 2018. This is part of our Data and Statistics products selection, and you will need a Paid account to download the actual report with accurate data and sources. Downloaded report will contain the editable graph with accurate data, an excel table with the actual data, the exact source of the data and the release date. This slide provides a comparison with Key Competitors AXA SA, American International Group, Inc. Aviva and ASSICURAZIONI GENERALI S.P.A. on the basis of Gross Written Premiums, Net Revenue, Operating Profit along with margin in percent, Combined Ratio in percent and Employees with the company Allianz Group for the year 2018. Download it immediately and use it for your business.
-
 Allianz total revenue split by segment 2014-18
This is a professionally designed visual chart for Allianz Total Revenue Split By Segment 2014 to 18. This is part of our Data and Statistics products selection, and you will need a Paid account to download the actual report with accurate data and sources. Downloaded report will contain the editable graph with accurate data, an excel table with the actual data, the exact source of the data and the release date. This slide shows Allianz Group Total Revenue split by segment Property and Casualty, Life Segment, Asset Management and Corporate and Others earned from the years 2014 to 18. Download it immediately and use it for your business.
-
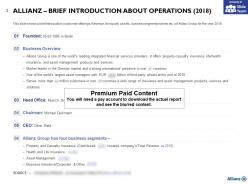 Allianz brief introduction about operations 2018
The information presented in this slide has been researched by our team of professional business analysts. This is part of our Company Profiles products selection, and you will need a Paid account to download the actual report with accurate data and sources. Downloaded report will be in Powerpoint and will contain the actual editable slides with the actual data and sources for each data. This slide shows a brief introduction customer offerings, Revenue, third party assets, business segments names etc. of Allianz Group for the year 2018. Download it immediately and use it for your business.
-
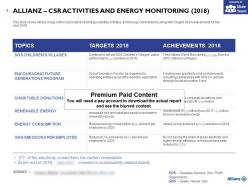 Allianz csr activities and energy monitoring 2018
The information presented in this slide has been researched by our team of professional business analysts. This is part of our Company Profiles products selection, and you will need a Paid account to download the actual report with accurate data and sources. Downloaded report will be in Powerpoint and will contain the actual editable slides with the actual data and sources for each data. This slide shows Allianz Group CSR Corporate Social Responsibility Activities and Energy Contributions along with Targets and Achievements for the year 2018. Download it immediately and use it for your business.
-
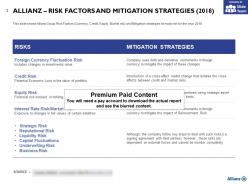 Allianz risk factors and mitigation strategies 2018
The information presented in this slide has been researched by our team of professional business analysts. This is part of our Company Profiles products selection, and you will need a Paid account to download the actual report with accurate data and sources. Downloaded report will be in Powerpoint and will contain the actual editable slides with the actual data and sources for each data. This slide shows Allianz Group Risk Factors Currency, Credit, Equity, Market etc. and Mitigation strategies for each risk for the year 2018. Download it immediately and use it for your business.
-
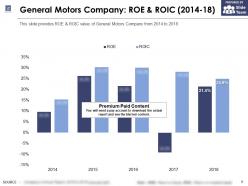 General motors company roe and roic 2014-18
This is a professionally designed visual chart for General Motors Company Roe And ROIC 2014 to 2018. This is part of our Data and Statistics products selection, and you will need a Paid account to download the actual report with accurate data and sources. Downloaded report will contain the editable graph with accurate data, an excel table with the actual data, the exact source of the data and the release date. This slide provides ROE and ROIC value of General Motors Company from 2014 to 2018. Download it immediately and use it for your business.
-
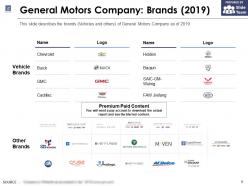 General motors company brands 2019
The information presented in this slide has been researched by our team of professional business analysts. This is part of our Company Profiles products selection, and you will need a Paid account to download the actual report with accurate data and sources. Downloaded report will be in Powerpoint and will contain the actual editable slides with the actual data and sources for each data. This slide describes the brands Vehicles and others of General Motors Company as of 2019. Download it immediately and use it for your business.
-
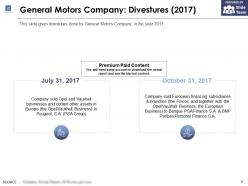 General motors company divestures 2017
The information presented in this slide has been researched by our team of professional business analysts. This is part of our Company Profiles products selection, and you will need a Paid account to download the actual report with accurate data and sources. Downloaded report will be in Powerpoint and will contain the actual editable slides with the actual data and sources for each data. This slide gives divestures done by General Motors Company in the year 2017. Download it immediately and use it for your business.
-
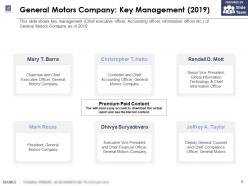 General motors company key management 2019
The information presented in this slide has been researched by our team of professional business analysts. This is part of our Company Profiles products selection, and you will need a Paid account to download the actual report with accurate data and sources. Downloaded report will be in Powerpoint and will contain the actual editable slides with the actual data and sources for each data. This slide shows key management Chief executive officer, Accounting officer, information officer etc. of General Motors Company as of 2019. Download it immediately and use it for your business.
-
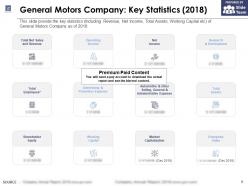 General motors company key statistics 2018
The information presented in this slide has been researched by our team of professional business analysts. This is part of our Company Profiles products selection, and you will need a Paid account to download the actual report with accurate data and sources. Downloaded report will be in Powerpoint and will contain the actual editable slides with the actual data and sources for each data. This slide provide the key statistics Including Revenue, Net Income, Total Assets, Working Capital etc. of General Motors Company as of 2018. Download it immediately and use it for your business.
-
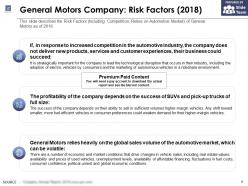 General motors company risk factors 2018
The information presented in this slide has been researched by our team of professional business analysts. This is part of our Company Profiles products selection, and you will need a Paid account to download the actual report with accurate data and sources. Downloaded report will be in Powerpoint and will contain the actual editable slides with the actual data and sources for each data. This slide describes the Risk Factors Including Competition, Relies on Automotive Market of General Motors as of 2018. Download it immediately and use it for your business.
-
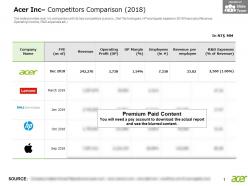 Acer inc competitors comparison 2018
This is a professionally designed visual chart for Acer Inc Competitors Comparison 2018. This is part of our Data and Statistics products selection, and you will need a Paid account to download the actual report with accurate data and sources. Downloaded report will contain the editable graph with accurate data, an excel table with the actual data, the exact source of the data and the release date. The slide provides Acer Inc comparison with its key competitors Lenovo, Dell Technologies, HP and Apple based on 2018 financials Revenue, Operating Income, R and D expenses etc. Download it immediately and use it for your business.
-
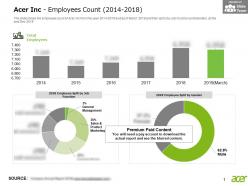 Acer inc employees count 2014-2018
This is a professionally designed visual chart for Acer Inc Employees Count 2014 to 2018. This is part of our Data and Statistics products selection, and you will need a Paid account to download the actual report with accurate data and sources. Downloaded report will contain the editable graph with accurate data, an excel table with the actual data, the exact source of the data and the release date. The slide shows the employee count of Acer Inc from the year 2014 to 2018 and as of March 2019 and their split by Job Function and Gender at the end Dec 2018. Download it immediately and use it for your business.
-
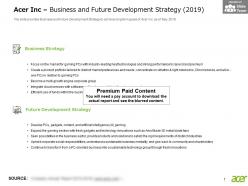 Acer inc business and future development strategy 2019
The information presented in this slide has been researched by our team of professional business analysts. This is part of our Company Profiles products selection, and you will need a Paid account to download the actual report with accurate data and sources. Downloaded report will be in Powerpoint and will contain the actual editable slides with the actual data and sources for each data. The slide provides Business and Future Development Strategy to achieve long term goals of Acer Inc, as of May 2019. Download it immediately and use it for your business.
-
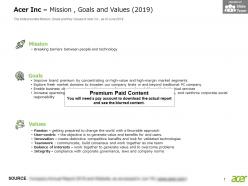 Acer inc mission goals and values 2019
The information presented in this slide has been researched by our team of professional business analysts. This is part of our Company Profiles products selection, and you will need a Paid account to download the actual report with accurate data and sources. Downloaded report will be in Powerpoint and will contain the actual editable slides with the actual data and sources for each data. The slide provides Mission, Goals and Key Values of Acer Inc, as of June 2019. Download it immediately and use it for your business.
-
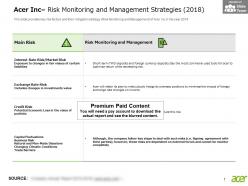 Acer inc risk monitoring and management strategies 2018
The information presented in this slide has been researched by our team of professional business analysts. This is part of our Company Profiles products selection, and you will need a Paid account to download the actual report with accurate data and sources. Downloaded report will be in Powerpoint and will contain the actual editable slides with the actual data and sources for each data. This slide provides key risk factors and their mitigation strategy Risk Monitoring and Management of Acer Inc in the year 2018. Download it immediately and use it for your business.
-
 Acer inc research and development expenses 2019
The information presented in this slide has been researched by our team of professional business analysts. This is part of our Company Profiles products selection, and you will need a Paid account to download the actual report with accurate data and sources. Downloaded report will be in Powerpoint and will contain the actual editable slides with the actual data and sources for each data. This slide provides Acer Inc Research and Development R and D plan in the year 2019. Download it immediately and use it for your business.
-
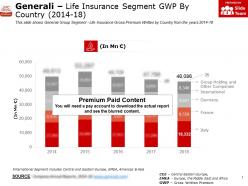 Generali life insurance segment gwp by country 2014-18
This is a professionally designed visual chart for Generali Life Insurance Segment GWP By Country 2014 to 18. This is part of our Data and Statistics products selection, and you will need a Paid account to download the actual report with accurate data and sources. Downloaded report will contain the editable graph with accurate data, an excel table with the actual data, the exact source of the data and the release date. This slide shows Generali Group Segment Life Insurance Gross Premium Written by Country from the years 2014 to 18. Download it immediately and use it for your business.
-
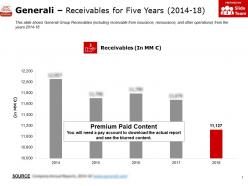 Generali receivables for five years 2014-18
This is a professionally designed visual chart for Generali Receivables For Five Years 2014 to 18. This is part of our Data and Statistics products selection, and you will need a Paid account to download the actual report with accurate data and sources. Downloaded report will contain the editable graph with accurate data, an excel table with the actual data, the exact source of the data and the release date. This slide shows Generali Group Receivables including receivable from insurance, reinsurance and other operations from the years 2014 to 18. Download it immediately and use it for your business.
-
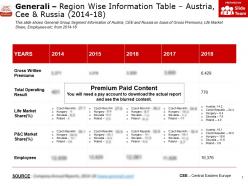 Generali region wise information table austria cee and russia 2014-18
This is a professionally designed visual chart for Generali Region Wise Information Table Austria Cee And Russia 2014 to 18. This is part of our Data and Statistics products selection, and you will need a Paid account to download the actual report with accurate data and sources. Downloaded report will contain the editable graph with accurate data, an excel table with the actual data, the exact source of the data and the release date. This slide shows Generali Group Segment Information of Austria, CEE and Russia on basis of Gross Premiums, Life Market Share, Employees etc. from 2014 to 18. Download it immediately and use it for your business.
-
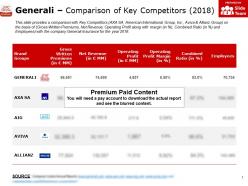 Generali comparison of key competitors 2018
This is a professionally designed visual chart for Generali Comparison Of Key Competitors 2018. This is part of our Data and Statistics products selection, and you will need a Paid account to download the actual report with accurate data and sources. Downloaded report will contain the editable graph with accurate data, an excel table with the actual data, the exact source of the data and the release date. This slide provides a comparison with Key Competitors AXA SA, American International Group, Inc. Aviva and Allianz Group on the basis of Gross Written Premiums, Net Revenue, Operating Profit along with margin in percent, Combined Ratio in percent and Employees with the company Generali Insurance for the year 2018. Download it immediately and use it for your business.
-
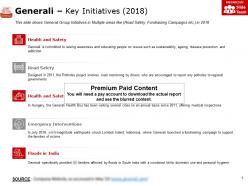 Generali key initiatives 2018
The information presented in this slide has been researched by our team of professional business analysts. This is part of our Company Profiles products selection, and you will need a Paid account to download the actual report with accurate data and sources. Downloaded report will be in Powerpoint and will contain the actual editable slides with the actual data and sources for each data. This slide shows Generali Group Initiatives in Multiple areas like Road Safety, Fundraising Campaigns etc. in 2018. Download it immediately and use it for your business.


