Consumer Goods and FMCG Data Statistics PowerPoint Templates, PowerPoint Statistics Slides
- Sub Categories
-
- Agriculture
- Chemicals and Resources
- Construction
- Consumer Goods and FMCG
- E-Commerce
- Energy and Environmental Services
- Finance Insurance and Real Estate
- Health and Pharmaceuticals
- Internet
- Life
- Media and Advertising
- Metals and Electronics
- Retail and Trade
- Services
- Society
- Sports and Recreation
- Survey
- Technology and Telecommunications
- Transportation and Logistics
- Travel Tourism and Hospitality
- USA
-
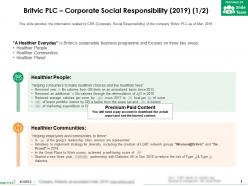 Britvic plc corporate social responsibility 2019
The information presented in this slide has been researched by our team of professional business analysts. This is part of our Company Profiles products selection, and you will need a Paid account to download the actual report with accurate data and sources. Downloaded report will be in Powerpoint and will contain the actual editable slides with the actual data and sources for each data. This slide provides the information related to CSR Corporate Social Responsibility of the company Britvic PLC as of Mar 2019. Download it immediately and use it for your business.
-
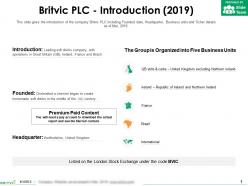 Britvic plc introduction 2019
The information presented in this slide has been researched by our team of professional business analysts. This is part of our Company Profiles products selection, and you will need a Paid account to download the actual report with accurate data and sources. Downloaded report will be in Powerpoint and will contain the actual editable slides with the actual data and sources for each data. This slide gives the introduction of the company Britvic PLC including Founded date, Headquarter, Business units and Ticker details as of Mar 2019. Download it immediately and use it for your business.
-
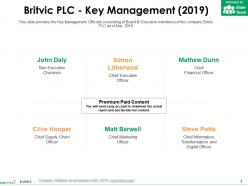 Britvic plc key management 2019
The information presented in this slide has been researched by our team of professional business analysts. This is part of our Company Profiles products selection, and you will need a Paid account to download the actual report with accurate data and sources. Downloaded report will be in Powerpoint and will contain the actual editable slides with the actual data and sources for each data. This slide provides the Key Management Officials consisting of Board and Executive members of the company Britvic PLC as of Mar 2019. Download it immediately and use it for your business.
-
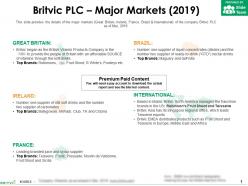 Britvic plc major markets 2019
The information presented in this slide has been researched by our team of professional business analysts. This is part of our Company Profiles products selection, and you will need a Paid account to download the actual report with accurate data and sources. Downloaded report will be in Powerpoint and will contain the actual editable slides with the actual data and sources for each data. This slide provides the details of the major markets Great Britain, Ireland, France, Brazil and International of the company Britvic PLC as of Mar 2019. Download it immediately and use it for your business.
-
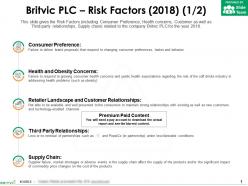 Britvic plc risk factors 2018
The information presented in this slide has been researched by our team of professional business analysts. This is part of our Company Profiles products selection, and you will need a Paid account to download the actual report with accurate data and sources. Downloaded report will be in Powerpoint and will contain the actual editable slides with the actual data and sources for each data. This slide gives the Risk Factors including Consumer Preference, Health concerns, Customer as well as Third party relationships, Supply chain related to the company Britvic PLC for the year 2018. Download it immediately and use it for your business.
-
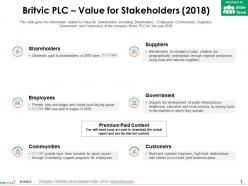 Britvic plc value for stakeholders 2018
The information presented in this slide has been researched by our team of professional business analysts. This is part of our Company Profiles products selection, and you will need a Paid account to download the actual report with accurate data and sources. Downloaded report will be in Powerpoint and will contain the actual editable slides with the actual data and sources for each data. This slide gives the information related to Value for Stakeholders including Shareholders, Employees, Communities, Suppliers, Government and Customers of the company Britvic PLC for the year 2018. Download it immediately and use it for your business.
-
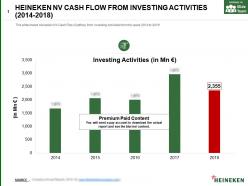 Heineken nv cash flow from investing activities 2014-2018
This is a professionally designed visual chart for Heineken Nv Cash Flow From Investing Activities 2014 to 2018. This is part of our Data and Statistics products selection, and you will need a Paid account to download the actual report with accurate data and sources. Downloaded report will contain the editable graph with accurate data, an excel table with the actual data, the exact source of the data and the release date. This slide shows Heineken NV Cash Flow Outflow from Investing Activities from the years 2014 to 2018. Download it immediately and use it for your business.
-
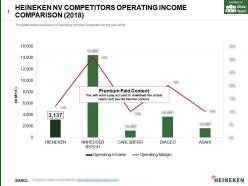 Heineken nv competitors operating income comparison 2018
This is a professionally designed visual chart for Heineken Nv Competitors Operating Income Comparison 2018. This is part of our Data and Statistics products selection, and you will need a Paid account to download the actual report with accurate data and sources. Downloaded report will contain the editable graph with accurate data, an excel table with the actual data, the exact source of the data and the release date. This slide shows Heineken NV Operating Income Comparison for the year 2018. Download it immediately and use it for your business.
-
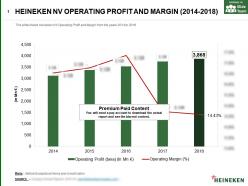 Heineken nv operating profit and margin 2014-2018
This is a professionally designed visual chart for Heineken Nv Operating Profit And Margin 2014 to 2018. This is part of our Data and Statistics products selection, and you will need a Paid account to download the actual report with accurate data and sources. Downloaded report will contain the editable graph with accurate data, an excel table with the actual data, the exact source of the data and the release date. This slide shows Heineken NV Operating Profit and Margin from the years 2014 to 2018. Download it immediately and use it for your business.
-
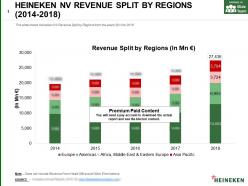 Heineken nv revenue split by regions 2014-2018
This is a professionally designed visual chart for Heineken Nv Revenue Split By Regions 2014 to 2018. This is part of our Data and Statistics products selection, and you will need a Paid account to download the actual report with accurate data and sources. Downloaded report will contain the editable graph with accurate data, an excel table with the actual data, the exact source of the data and the release date. This slide shows Heineken NV Revenue Split by Regions from the years 2014 to 2018. Download it immediately and use it for your business.
-
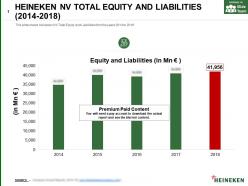 Heineken nv total equity and liabilities 2014-2018
This is a professionally designed visual chart for Heineken Nv Total Equity And Liabilities 2014 to 2018. This is part of our Data and Statistics products selection, and you will need a Paid account to download the actual report with accurate data and sources. Downloaded report will contain the editable graph with accurate data, an excel table with the actual data, the exact source of the data and the release date. This slide shows Heineken NV Total Equity and Liabilities from the years 2014 to 2018. Download it immediately and use it for your business.
-
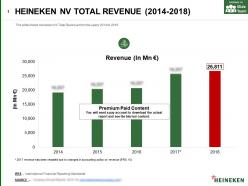 Heineken nv total revenue 2014-2018
This is a professionally designed visual chart for Heineken Nv Total Revenue 2014 to 2018. This is part of our Data and Statistics products selection, and you will need a Paid account to download the actual report with accurate data and sources. Downloaded report will contain the editable graph with accurate data, an excel table with the actual data, the exact source of the data and the release date. This slide shows Heineken NV Total Revenue from the years 2014 to 2018. Download it immediately and use it for your business.
-
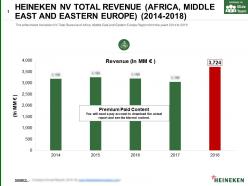 Heineken nv total revenue africa middle east and eastern europe 2014-2018
This is a professionally designed visual chart for Heineken Nv Total Revenue Africa Middle East And Eastern Europe 2014 to 2018. This is part of our Data and Statistics products selection, and you will need a Paid account to download the actual report with accurate data and sources. Downloaded report will contain the editable graph with accurate data, an excel table with the actual data, the exact source of the data and the release date. This slide shows Heineken NV Total Revenue of Africa, Middle East and Eastern Europe Region from the years 2014 to 2018. Download it immediately and use it for your business.
-
 Heineken nv highlights 2018-19
The information presented in this slide has been researched by our team of professional business analysts. This is part of our Company Profiles products selection, and you will need a Paid account to download the actual report with accurate data and sources. Downloaded report will be in Powerpoint and will contain the actual editable slides with the actual data and sources for each data. This slide shows the highlights of Heineken NV for the years 2018 to 2019. Download it immediately and use it for your business.
-
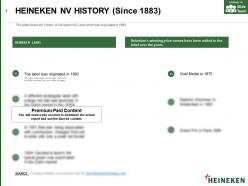 Heineken nv history since 1883
The information presented in this slide has been researched by our team of professional business analysts. This is part of our Company Profiles products selection, and you will need a Paid account to download the actual report with accurate data and sources. Downloaded report will be in Powerpoint and will contain the actual editable slides with the actual data and sources for each data. This slide shows the History of Heineken NV Label which was originated in 1883. Download it immediately and use it for your business.
-
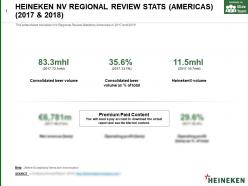 Heineken nv regional review stats americas 2017-2018
The information presented in this slide has been researched by our team of professional business analysts. This is part of our Company Profiles products selection, and you will need a Paid account to download the actual report with accurate data and sources. Downloaded report will be in Powerpoint and will contain the actual editable slides with the actual data and sources for each data. This slide shows Heineken NV Regional Review Statistics Americas in 2017 to 2018. Download it immediately and use it for your business.
-
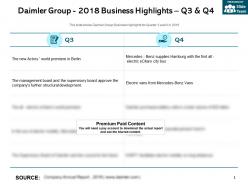 Daimler group 2018 business highlights q3 and q4
The information presented in this slide has been researched by our team of professional business analysts. This is part of our Company Profiles products selection, and you will need a Paid account to download the actual report with accurate data and sources. Downloaded report will be in Powerpoint and will contain the actual editable slides with the actual data and sources for each data. This slide shows Daimler Group Business Highlights for Quarter 3 and 4 in 2018. Download it immediately and use it for your business.
-
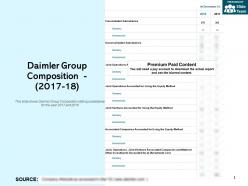 Daimler group composition 2017-18
The information presented in this slide has been researched by our team of professional business analysts. This is part of our Company Profiles products selection, and you will need a Paid account to download the actual report with accurate data and sources. Downloaded report will be in Powerpoint and will contain the actual editable slides with the actual data and sources for each data. This slide shows Daimler Group Composition stating subsidiaries for the year 2017 to 2018. Download it immediately and use it for your business.
-
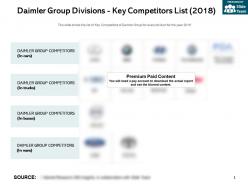 Daimler group divisions key competitors list 2018
The information presented in this slide has been researched by our team of professional business analysts. This is part of our Company Profiles products selection, and you will need a Paid account to download the actual report with accurate data and sources. Downloaded report will be in Powerpoint and will contain the actual editable slides with the actual data and sources for each data. This slide shows the list of Key Competitors of Daimler Group for every division for the year 2018. Download it immediately and use it for your business.
-
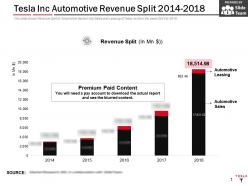 Tesla inc automotive revenue split 2014-2018
This is a professionally designed visual chart for Tesla Inc Automotive Revenue Split 2014 to 2018. This is part of our Data and Statistics products selection, and you will need a Paid account to download the actual report with accurate data and sources. Downloaded report will contain the editable graph with accurate data, an excel table with the actual data, the exact source of the data and the release date. This slide shows Revenue Split of Automotive Section into Sales and Leasing of Tesla Inc from the years 2014 to 2018. Download it immediately and use it for your business.
-
 Tesla inc financial comparison of key competitors 2018
This is a professionally designed visual chart for Tesla Inc Financial Comparison Of Key Competitors 2018. This is part of our Data and Statistics products selection, and you will need a Paid account to download the actual report with accurate data and sources. Downloaded report will contain the editable graph with accurate data, an excel table with the actual data, the exact source of the data and the release date. This slide shows the Financial Comparison of Tesla Inc with Key Competitors i.e. BMW, AUDI, FORD and DAIMLER for 2018. Download it immediately and use it for your business.
-
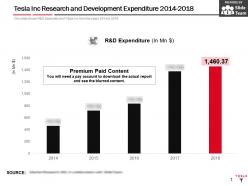 Tesla inc research and development expenditure 2014-2018
This is a professionally designed visual chart for Tesla Inc Research And Development Expenditure 2014 to 2018. This is part of our Data and Statistics products selection, and you will need a Paid account to download the actual report with accurate data and sources. Downloaded report will contain the editable graph with accurate data, an excel table with the actual data, the exact source of the data and the release date. This slide shows R and D Expenditure of Tesla Inc from the years 2014 to 2018. Download it immediately and use it for your business.
-
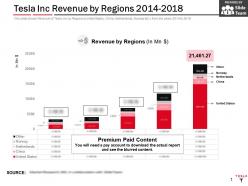 Tesla inc revenue by regions 2014-2018
This is a professionally designed visual chart for Tesla Inc Revenue By Regions 2014 to 2018. This is part of our Data and Statistics products selection, and you will need a Paid account to download the actual report with accurate data and sources. Downloaded report will contain the editable graph with accurate data, an excel table with the actual data, the exact source of the data and the release date. This slide shows Revenue of Tesla Inc by Regions United States, China, Netherlands, Norway etc. from the years 2014 to 2018. Download it immediately and use it for your business.
-
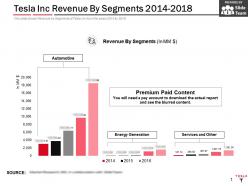 Tesla inc revenue by segments 2014-2018
This is a professionally designed visual chart for Tesla Inc Revenue By Segments 2014 to 2018. This is part of our Data and Statistics products selection, and you will need a Paid account to download the actual report with accurate data and sources. Downloaded report will contain the editable graph with accurate data, an excel table with the actual data, the exact source of the data and the release date. This slide shows Revenue by Segments of Tesla Inc from the years 2014 to 2018. Download it immediately and use it for your business.
-
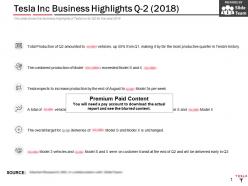 Tesla inc business highlights q2 2018
The information presented in this slide has been researched by our team of professional business analysts. This is part of our Company Profiles products selection, and you will need a Paid account to download the actual report with accurate data and sources. Downloaded report will be in Powerpoint and will contain the actual editable slides with the actual data and sources for each data. This slide shows the Business Highlights of Tesla Inc for Q2 for the year 2018. Download it immediately and use it for your business.
-
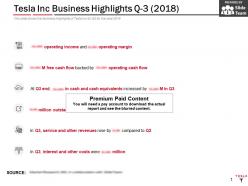 Tesla inc business highlights q3 2018
The information presented in this slide has been researched by our team of professional business analysts. This is part of our Company Profiles products selection, and you will need a Paid account to download the actual report with accurate data and sources. Downloaded report will be in Powerpoint and will contain the actual editable slides with the actual data and sources for each data. This slide shows the Business Highlights of Tesla Inc for Q3 for the year 2018. Download it immediately and use it for your business.
-
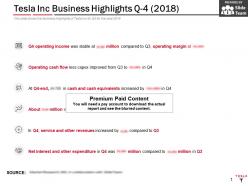 Tesla inc business highlights q4 2018
The information presented in this slide has been researched by our team of professional business analysts. This is part of our Company Profiles products selection, and you will need a Paid account to download the actual report with accurate data and sources. Downloaded report will be in Powerpoint and will contain the actual editable slides with the actual data and sources for each data. This slide shows the Business Highlights of Tesla Inc for Q4 for the year 2018. Download it immediately and use it for your business.
-
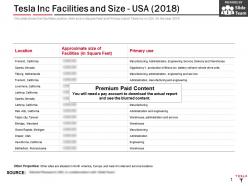 Tesla inc facilities and size usa 2018
The information presented in this slide has been researched by our team of professional business analysts. This is part of our Company Profiles products selection, and you will need a Paid account to download the actual report with accurate data and sources. Downloaded report will be in Powerpoint and will contain the actual editable slides with the actual data and sources for each data. This slide shows the Facilities Location their size in Square Feet and Primary Use of Tesla Inc in USA for the year 2018. Download it immediately and use it for your business.
-
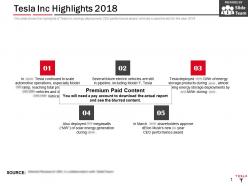 Tesla inc highlights 2018
The information presented in this slide has been researched by our team of professional business analysts. This is part of our Company Profiles products selection, and you will need a Paid account to download the actual report with accurate data and sources. Downloaded report will be in Powerpoint and will contain the actual editable slides with the actual data and sources for each data. This slide shows the highlights of Tesla Inc energy deployment, CEO performance award, vehicles in pipeline etc. for the year 2018. Download it immediately and use it for your business.
-
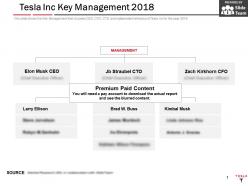 Tesla inc key management 2018
The information presented in this slide has been researched by our team of professional business analysts. This is part of our Company Profiles products selection, and you will need a Paid account to download the actual report with accurate data and sources. Downloaded report will be in Powerpoint and will contain the actual editable slides with the actual data and sources for each data. This slide shows the Key Management that includes CEO, CFO ,CTO and independent directors of Tesla Inc for the year 2018. Download it immediately and use it for your business.
-
 Tesla inc key stats 2018
The information presented in this slide has been researched by our team of professional business analysts. This is part of our Company Profiles products selection, and you will need a Paid account to download the actual report with accurate data and sources. Downloaded report will be in Powerpoint and will contain the actual editable slides with the actual data and sources for each data. This slide shows the brief introduction about Tesla Inc such as founder, employees, revenue, market cap etc. for 2018. Download it immediately and use it for your business.
-
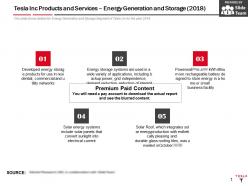 Tesla inc products and services energy generation and storage 2018
The information presented in this slide has been researched by our team of professional business analysts. This is part of our Company Profiles products selection, and you will need a Paid account to download the actual report with accurate data and sources. Downloaded report will be in Powerpoint and will contain the actual editable slides with the actual data and sources for each data. This slide shows details for Energy Generation and Storage Segment of Tesla Inc for the year 2018. Download it immediately and use it for your business.
-
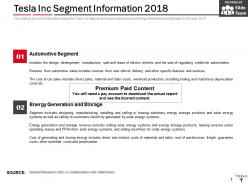 Tesla inc segment information 2018
The information presented in this slide has been researched by our team of professional business analysts. This is part of our Company Profiles products selection, and you will need a Paid account to download the actual report with accurate data and sources. Downloaded report will be in Powerpoint and will contain the actual editable slides with the actual data and sources for each data. This slide gives a brief information about the Tesla Inc Segments that are Automotive and Energy Generation and Storage for the year 2018. Download it immediately and use it for your business.
-
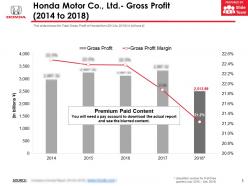 Honda motor co ltd gross profit 2014-2018
This is a professionally designed visual chart for Honda Motor Co Ltd Gross Profit 2014 to 2018. This is part of our Data and Statistics products selection, and you will need a Paid account to download the actual report with accurate data and sources. Downloaded report will contain the editable graph with accurate data, an excel table with the actual data, the exact source of the data and the release date. This slide shows the Total Gross Profit of Honda from 2014 to 2018 In billions JPY. Download it immediately and use it for your business.
-
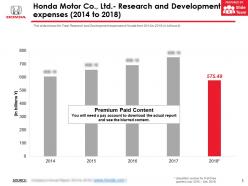 Honda motor co ltd research and development expenses 2014-2018
This is a professionally designed visual chart for Honda Motor Co Ltd Research And Development Expenses 2014 to 2018. This is part of our Data and Statistics products selection, and you will need a Paid account to download the actual report with accurate data and sources. Downloaded report will contain the editable graph with accurate data, an excel table with the actual data, the exact source of the data and the release date. This slide shows the Total Research and Development expenses of Honda from 2014 to 2018 in billions JPY. Download it immediately and use it for your business.
-
 Honda motor co ltd total sales revenue by region of automobile business by percent 2018
This is a professionally designed visual chart for Honda Motor Co Ltd Total Sales Revenue By Region Of Automobile Business By Percent 2018. This is part of our Data and Statistics products selection, and you will need a Paid account to download the actual report with accurate data and sources. Downloaded report will contain the editable graph with accurate data, an excel table with the actual data, the exact source of the data and the release date. This slide shows the Total Sales Revenue by Region of Automobile Business by Percent of Honda in 2018. Download it immediately and use it for your business.
-
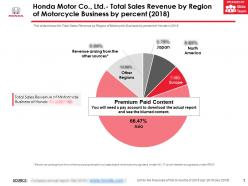 Honda motor co ltd total sales revenue by region of motorcycle business by percent 2018
This is a professionally designed visual chart for Honda Motor Co Ltd Total Sales Revenue By Region Of Motorcycle Business By Percent 2018. This is part of our Data and Statistics products selection, and you will need a Paid account to download the actual report with accurate data and sources. Downloaded report will contain the editable graph with accurate data, an excel table with the actual data, the exact source of the data and the release date. This slide shows the Total Sales Revenue by Region of Motorcycle Business by percent of Honda in 2018. Download it immediately and use it for your business.
-
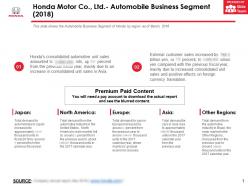 Honda motor co ltd automobile business segment 2018
The information presented in this slide has been researched by our team of professional business analysts. This is part of our Company Profiles products selection, and you will need a Paid account to download the actual report with accurate data and sources. Downloaded report will be in Powerpoint and will contain the actual editable slides with the actual data and sources for each data. This slide shows the Automobile Business Segment of Honda by region as of March 2018. Download it immediately and use it for your business.
-
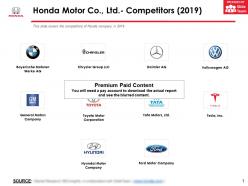 Honda motor co ltd competitors 2019
The information presented in this slide has been researched by our team of professional business analysts. This is part of our Company Profiles products selection, and you will need a Paid account to download the actual report with accurate data and sources. Downloaded report will be in Powerpoint and will contain the actual editable slides with the actual data and sources for each data. This slide covers the competitors of Honda company in 2019. Download it immediately and use it for your business.
-
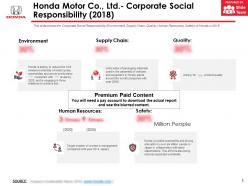 Honda motor co ltd corporate social responsibility 2018
The information presented in this slide has been researched by our team of professional business analysts. This is part of our Company Profiles products selection, and you will need a Paid account to download the actual report with accurate data and sources. Downloaded report will be in Powerpoint and will contain the actual editable slides with the actual data and sources for each data. This slide shows the Corporate Social Responsibility Environment, Supply Chain, Quality, Human Resources, Safety of Honda in 2018. Download it immediately and use it for your business.
-
 Honda motor co ltd financial services business segment 2018
The information presented in this slide has been researched by our team of professional business analysts. This is part of our Company Profiles products selection, and you will need a Paid account to download the actual report with accurate data and sources. Downloaded report will be in Powerpoint and will contain the actual editable slides with the actual data and sources for each data. This slide shows the Financial Services Business Segment with Customer sales, Operating Cost Expenses and Operating Profit of Honda as of March 2018. Download it immediately and use it for your business.
-
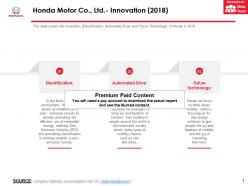 Honda motor co ltd innovation 2018
The information presented in this slide has been researched by our team of professional business analysts. This is part of our Company Profiles products selection, and you will need a Paid account to download the actual report with accurate data and sources. Downloaded report will be in Powerpoint and will contain the actual editable slides with the actual data and sources for each data. This slide covers the Innovation Electrification, Automated Drive and Future Technology of Honda in 2018. Download it immediately and use it for your business.
-
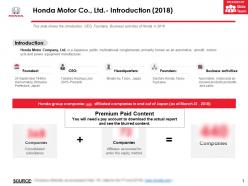 Honda motor co ltd introduction 2018
The information presented in this slide has been researched by our team of professional business analysts. This is part of our Company Profiles products selection, and you will need a Paid account to download the actual report with accurate data and sources. Downloaded report will be in Powerpoint and will contain the actual editable slides with the actual data and sources for each data. This slide shows the introduction, CEO, Founders, Business activities of Honda in 2018. Download it immediately and use it for your business.
-
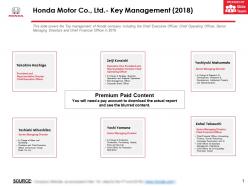 Honda motor co ltd key management 2018
The information presented in this slide has been researched by our team of professional business analysts. This is part of our Company Profiles products selection, and you will need a Paid account to download the actual report with accurate data and sources. Downloaded report will be in Powerpoint and will contain the actual editable slides with the actual data and sources for each data. This slide covers the Top management of Honda company including the Chief Executive Officer, Chief Operating Officer, Senior Managing Directors and Chief Financial Officer in 2018. Download it immediately and use it for your business.
-
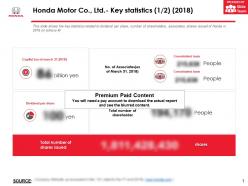 Honda motor co ltd key statistics 2018
The information presented in this slide has been researched by our team of professional business analysts. This is part of our Company Profiles products selection, and you will need a Paid account to download the actual report with accurate data and sources. Downloaded report will be in Powerpoint and will contain the actual editable slides with the actual data and sources for each data. This slide shows the key statistics related to dividend per share, number of shareholders, associates, shares issued of Honda in 2018 in billions JPY. Download it immediately and use it for your business.
-
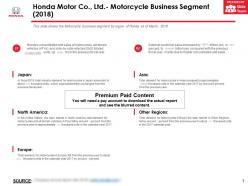 Honda motor co ltd motorcycle business segment 2018
The information presented in this slide has been researched by our team of professional business analysts. This is part of our Company Profiles products selection, and you will need a Paid account to download the actual report with accurate data and sources. Downloaded report will be in Powerpoint and will contain the actual editable slides with the actual data and sources for each data. This slide shows the Motorcycle business segment by region of Honda as of March 2018. Download it immediately and use it for your business.
-
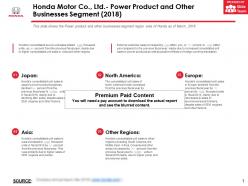 Honda motor co ltd power product and other businesses segment 2018
The information presented in this slide has been researched by our team of professional business analysts. This is part of our Company Profiles products selection, and you will need a Paid account to download the actual report with accurate data and sources. Downloaded report will be in Powerpoint and will contain the actual editable slides with the actual data and sources for each data. This slide shows the Power product and other businesses segment region wise of Honda as of March 2018. Download it immediately and use it for your business.
-
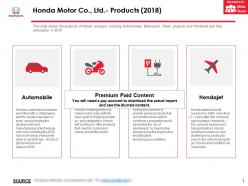 Honda motor co ltd products 2018
The information presented in this slide has been researched by our team of professional business analysts. This is part of our Company Profiles products selection, and you will need a Paid account to download the actual report with accurate data and sources. Downloaded report will be in Powerpoint and will contain the actual editable slides with the actual data and sources for each data. This slide shows the products of Honda company including Automobiles, Motorcycle, Power products and HondaJet and their information in 2018. Download it immediately and use it for your business.
-
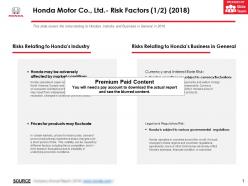 Honda motor co ltd risk factors 2018
The information presented in this slide has been researched by our team of professional business analysts. This is part of our Company Profiles products selection, and you will need a Paid account to download the actual report with accurate data and sources. Downloaded report will be in Powerpoint and will contain the actual editable slides with the actual data and sources for each data. This slide covers the risks relating to Hondas Industry and Business in General in 2018. Download it immediately and use it for your business.
-
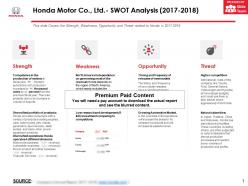 Honda motor co ltd swot analysis 2017-2018
The information presented in this slide has been researched by our team of professional business analysts. This is part of our Company Profiles products selection, and you will need a Paid account to download the actual report with accurate data and sources. Downloaded report will be in Powerpoint and will contain the actual editable slides with the actual data and sources for each data. This slide Covers the Strength, Weakness, Opportunity and Threat related to Honda in 2017 to 2018. Download it immediately and use it for your business.
-
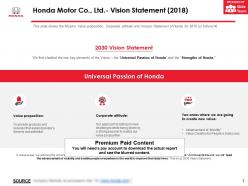 Honda motor co ltd vision statement 2018
The information presented in this slide has been researched by our team of professional business analysts. This is part of our Company Profiles products selection, and you will need a Paid account to download the actual report with accurate data and sources. Downloaded report will be in Powerpoint and will contain the actual editable slides with the actual data and sources for each data. This slide shows the Mission Value proposition, Corporate attitude and mission Statement of Honda for 2018 in billions JPY. Download it immediately and use it for your business.
-
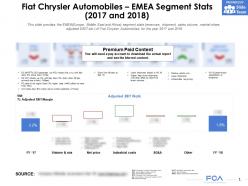 Fiat chrysler automobiles emea segment stats 2017-2018
This is a professionally designed visual chart for Fiat Chrysler Automobiles EMEA Segment Stats 2017 to 2018. This is part of our Data and Statistics products selection, and you will need a Paid account to download the actual report with accurate data and sources. Downloaded report will contain the editable graph with accurate data, an excel table with the actual data, the exact source of the data and the release date. This slide provides the EMEA Europe, Middle East and Africa segment stats revenues, shipment, sales volume, market share, adjusted EBIT etc. of Fiat Chrysler Automobiles, for the year 2017 to 2018. Download it immediately and use it for your business.
-
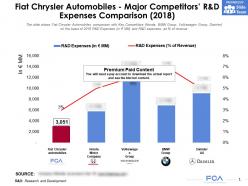 Fiat chrysler automobiles major competitors r and d expenses comparison 2018
This is a professionally designed visual chart for Fiat Chrysler Automobiles Major Competitors R And D Expenses Comparison 2018. This is part of our Data and Statistics products selection, and you will need a Paid account to download the actual report with accurate data and sources. Downloaded report will contain the editable graph with accurate data, an excel table with the actual data, the exact source of the data and the release date. The slide shows Fiat Chrysler Automobiles comparison with Key Competitors Honda, BMW Group, Volkswagen Group, Daimler on the basis of 2018 R and D Expenses in JPY MM and R and D expenses as percent of revenue. Download it immediately and use it for your business.
-
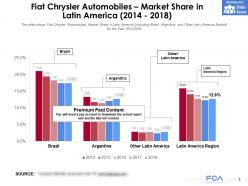 Fiat chrysler automobiles market share in latin america 2014-2018
This is a professionally designed visual chart for Fiat Chrysler Automobiles Market Share In Latin America 2014 to 2018. This is part of our Data and Statistics products selection, and you will need a Paid account to download the actual report with accurate data and sources. Downloaded report will contain the editable graph with accurate data, an excel table with the actual data, the exact source of the data and the release date. The slide shows Fiat Chrysler Automobiles Market Share in Latin America including Brazil, Argentina, and Other Latin America Market for the Year 2014 to 2018. Download it immediately and use it for your business.
-
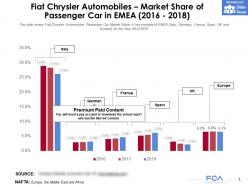 Fiat chrysler automobiles market share of passenger car in emea 2016-2018
This is a professionally designed visual chart for Fiat Chrysler Automobiles Market Share Of Passenger Car In EMEA 2016 to 2018. This is part of our Data and Statistics products selection, and you will need a Paid account to download the actual report with accurate data and sources. Downloaded report will contain the editable graph with accurate data, an excel table with the actual data, the exact source of the data and the release date. This slide shows Fiat Chrysler Automobiles Passenger Car Market Share in key markets of EMEA Italy, Germany, France, Spain, UK and Europe for the Year 2014 to 2018. Download it immediately and use it for your business.
-
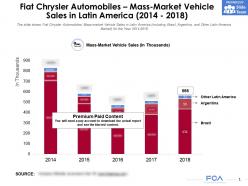 Fiat chrysler automobiles mass market vehicle sales in latin america 2014-2018
This is a professionally designed visual chart for Fiat Chrysler Automobiles Mass Market Vehicle Sales In Latin America 2014 to 2018. This is part of our Data and Statistics products selection, and you will need a Paid account to download the actual report with accurate data and sources. Downloaded report will contain the editable graph with accurate data, an excel table with the actual data, the exact source of the data and the release date. This slide shows Fiat Chrysler Automobiles Mass-market Vehicle Sales in Latin America including Brazil, Argentina, and Other Latin America Market for the Year 2014 to 2018. Download it immediately and use it for your business.
-
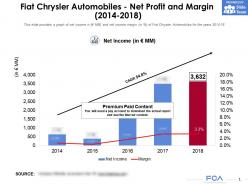 Fiat chrysler automobiles net profit and margin 2014-2018
This is a professionally designed visual chart for Fiat Chrysler Automobiles Net Profit And Margin 2014 to 2018. This is part of our Data and Statistics products selection, and you will need a Paid account to download the actual report with accurate data and sources. Downloaded report will contain the editable graph with accurate data, an excel table with the actual data, the exact source of the data and the release date. This slide provides a graph of net income in JPY MM and net income margin in percent of Fiat Chrysler Automobiles for the years 2014 to 18. Download it immediately and use it for your business.
-
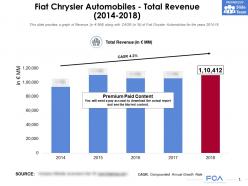 Fiat chrysler automobiles total revenue 2014-2018
This is a professionally designed visual chart for Fiat Chrysler Automobiles Total Revenue 2014 to 2018. This is part of our Data and Statistics products selection, and you will need a Paid account to download the actual report with accurate data and sources. Downloaded report will contain the editable graph with accurate data, an excel table with the actual data, the exact source of the data and the release date. This slide provides a graph of Revenue in JPY MM along with CAGR in percent of Fiat Chrysler Automobiles for the years 2014 to 18. Download it immediately and use it for your business.
-
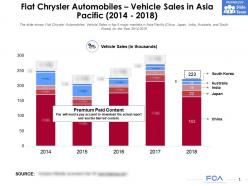 Fiat chrysler automobiles vehicle sales in asia pacific 2014-2018
This is a professionally designed visual chart for Fiat Chrysler Automobiles Vehicle Sales In Asia Pacific 2014 to 2018. This is part of our Data and Statistics products selection, and you will need a Paid account to download the actual report with accurate data and sources. Downloaded report will contain the editable graph with accurate data, an excel table with the actual data, the exact source of the data and the release date. The slide shows Fiat Chrysler Automobiles Vehicle Sales in top 5 major markets in Asia Pacific China, Japan, India, Australia, and South Korea for the Year 2014 to 2018. Download it immediately and use it for your business.
-
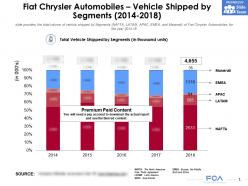 Fiat chrysler automobiles vehicle shipped by segments 2014-2018
This is a professionally designed visual chart for Fiat Chrysler Automobiles Vehicle Shipped By Segments 2014 to 2018. This is part of our Data and Statistics products selection, and you will need a Paid account to download the actual report with accurate data and sources. Downloaded report will contain the editable graph with accurate data, an excel table with the actual data, the exact source of the data and the release date. This slide provides the total volume of vehicle shipped by Segments NAFTA, LATAM, APAC, EMEA, and Maserati of Fiat Chrysler Automobiles, for the year 2014 to 18. Download it immediately and use it for your business.


